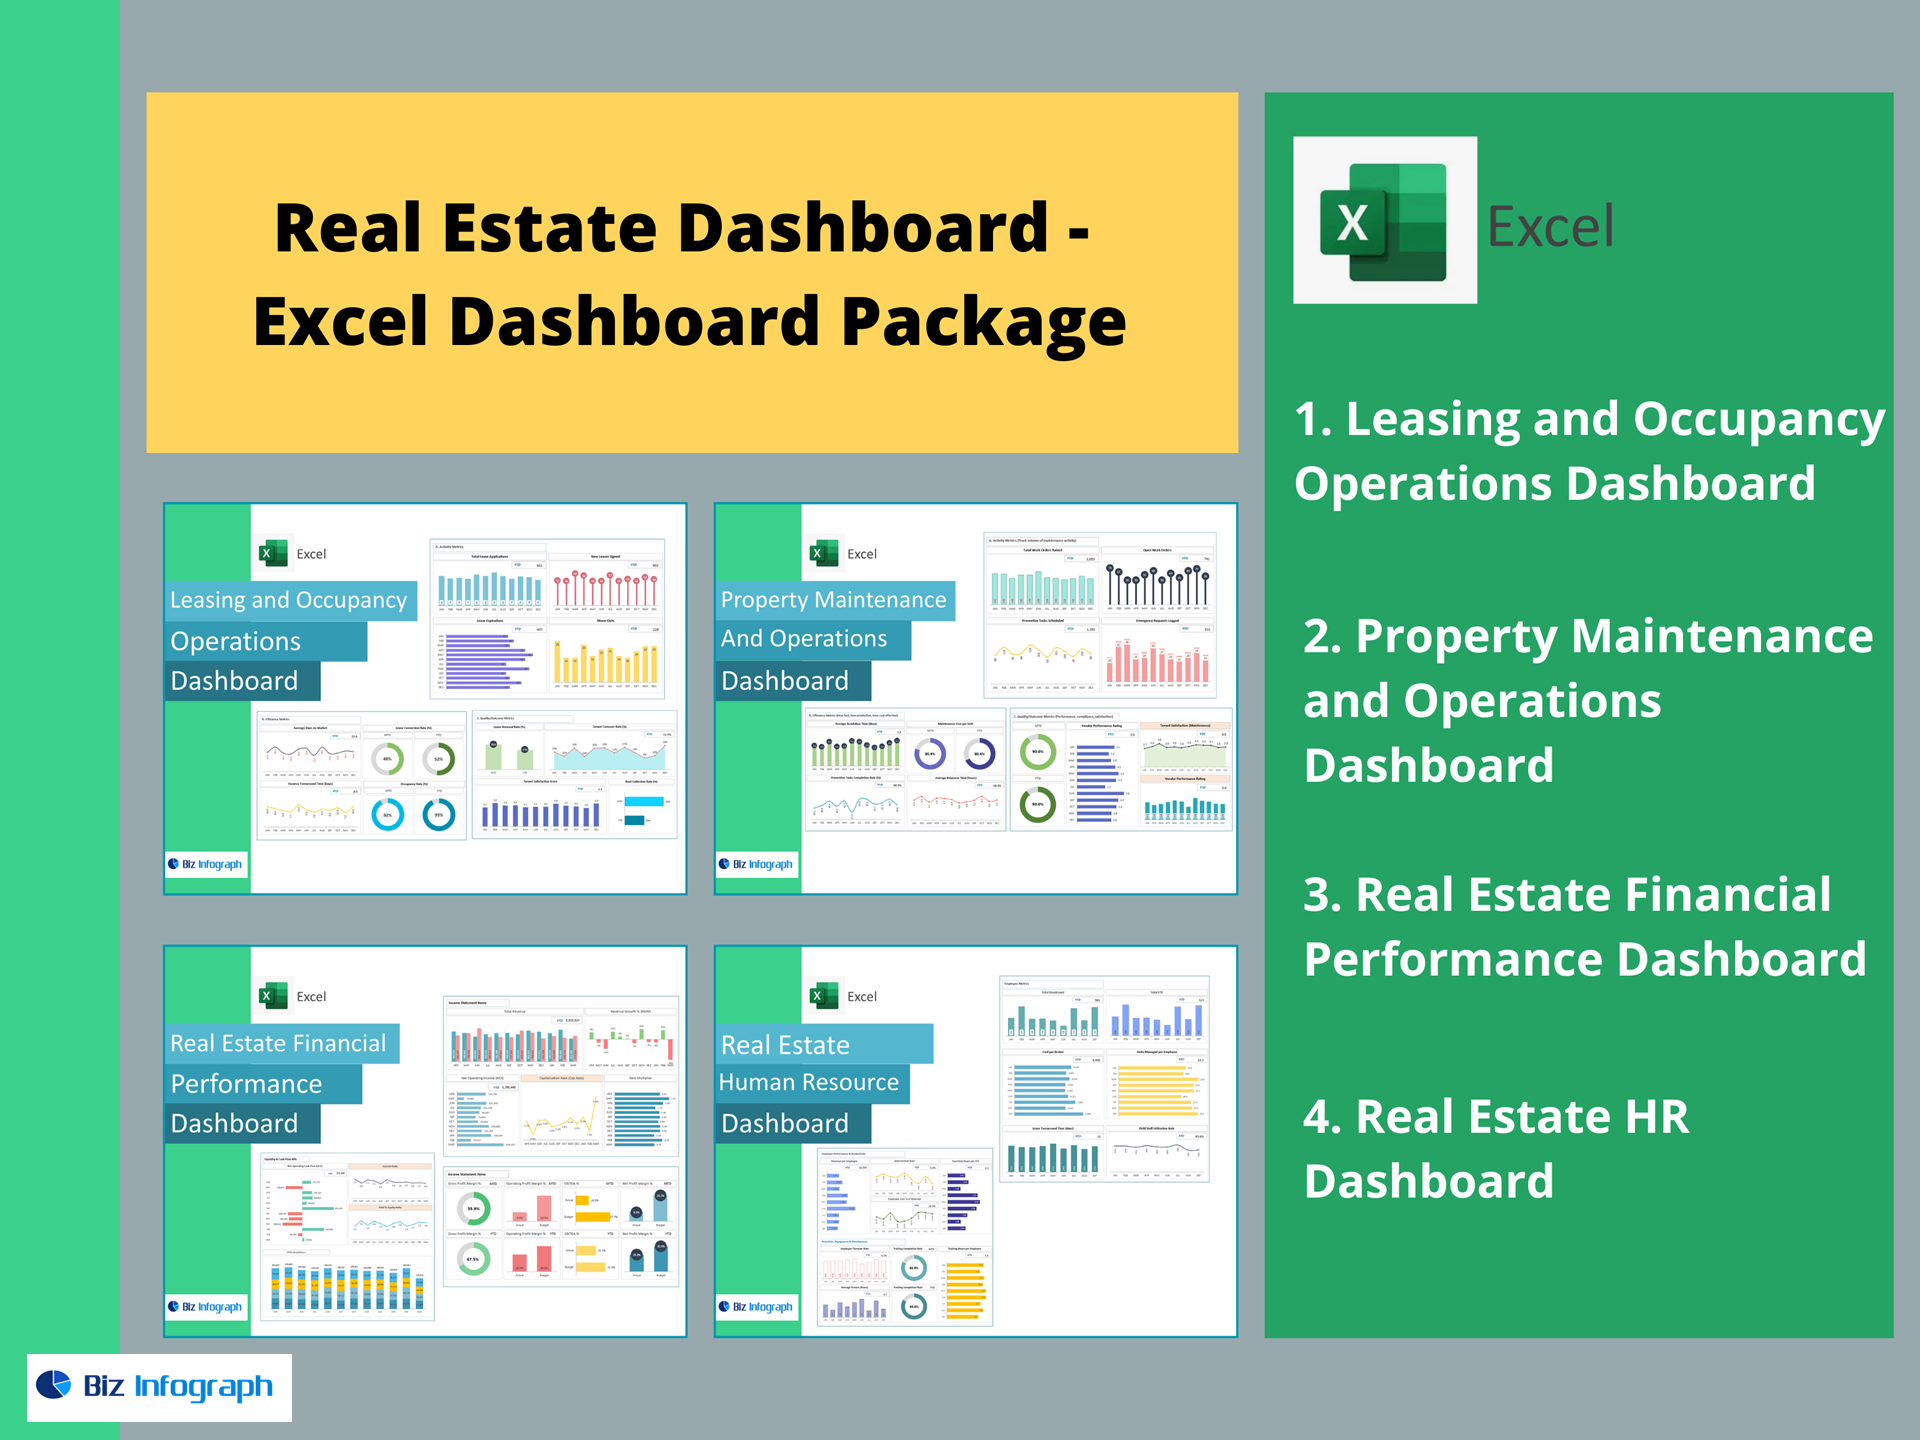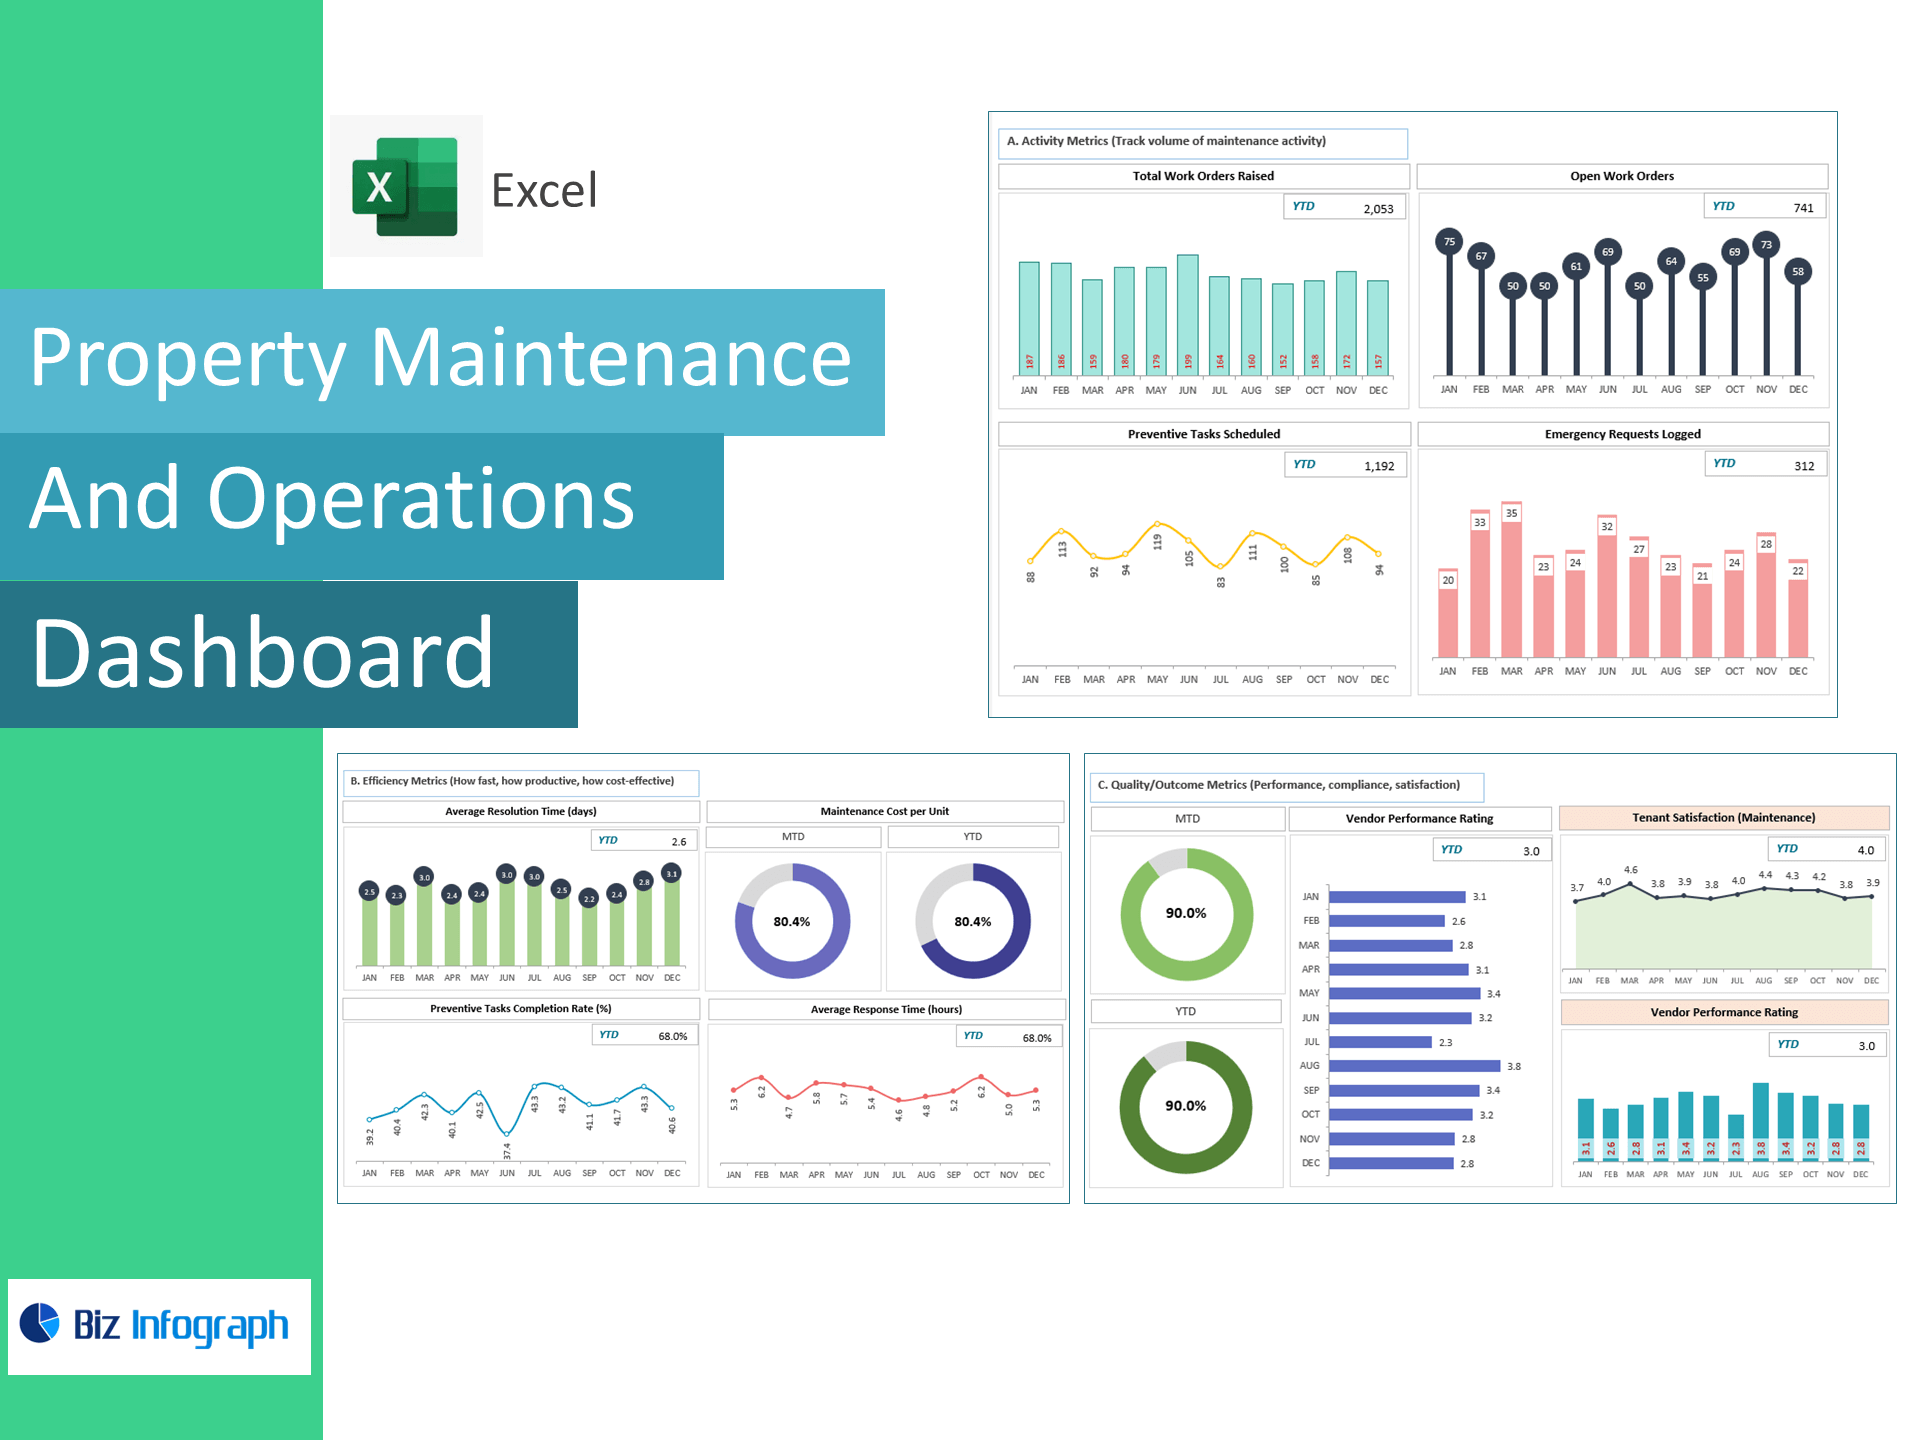
Property Maintenance & Operations Dashboard — Excel Template
Reduce downtime, control costs, and keep tenants happy—right in Excel. This template turns work orders, preventive maintenance, vendor jobs, and feedback into a live dashboard tracking work order volume, average response & resolution time, preventive completion, maintenance cost per unit, SLA compliance, tenant satisfaction, repeat issue rate, and vendor performance so you can run maintenance like a pro.
Why property teams choose this template
-
Full visibility: Monitor activity, efficiency, and quality from request to resolution.
-
Fewer emergencies: Raise preventive completion, spot repeat issues, and fix root causes.
-
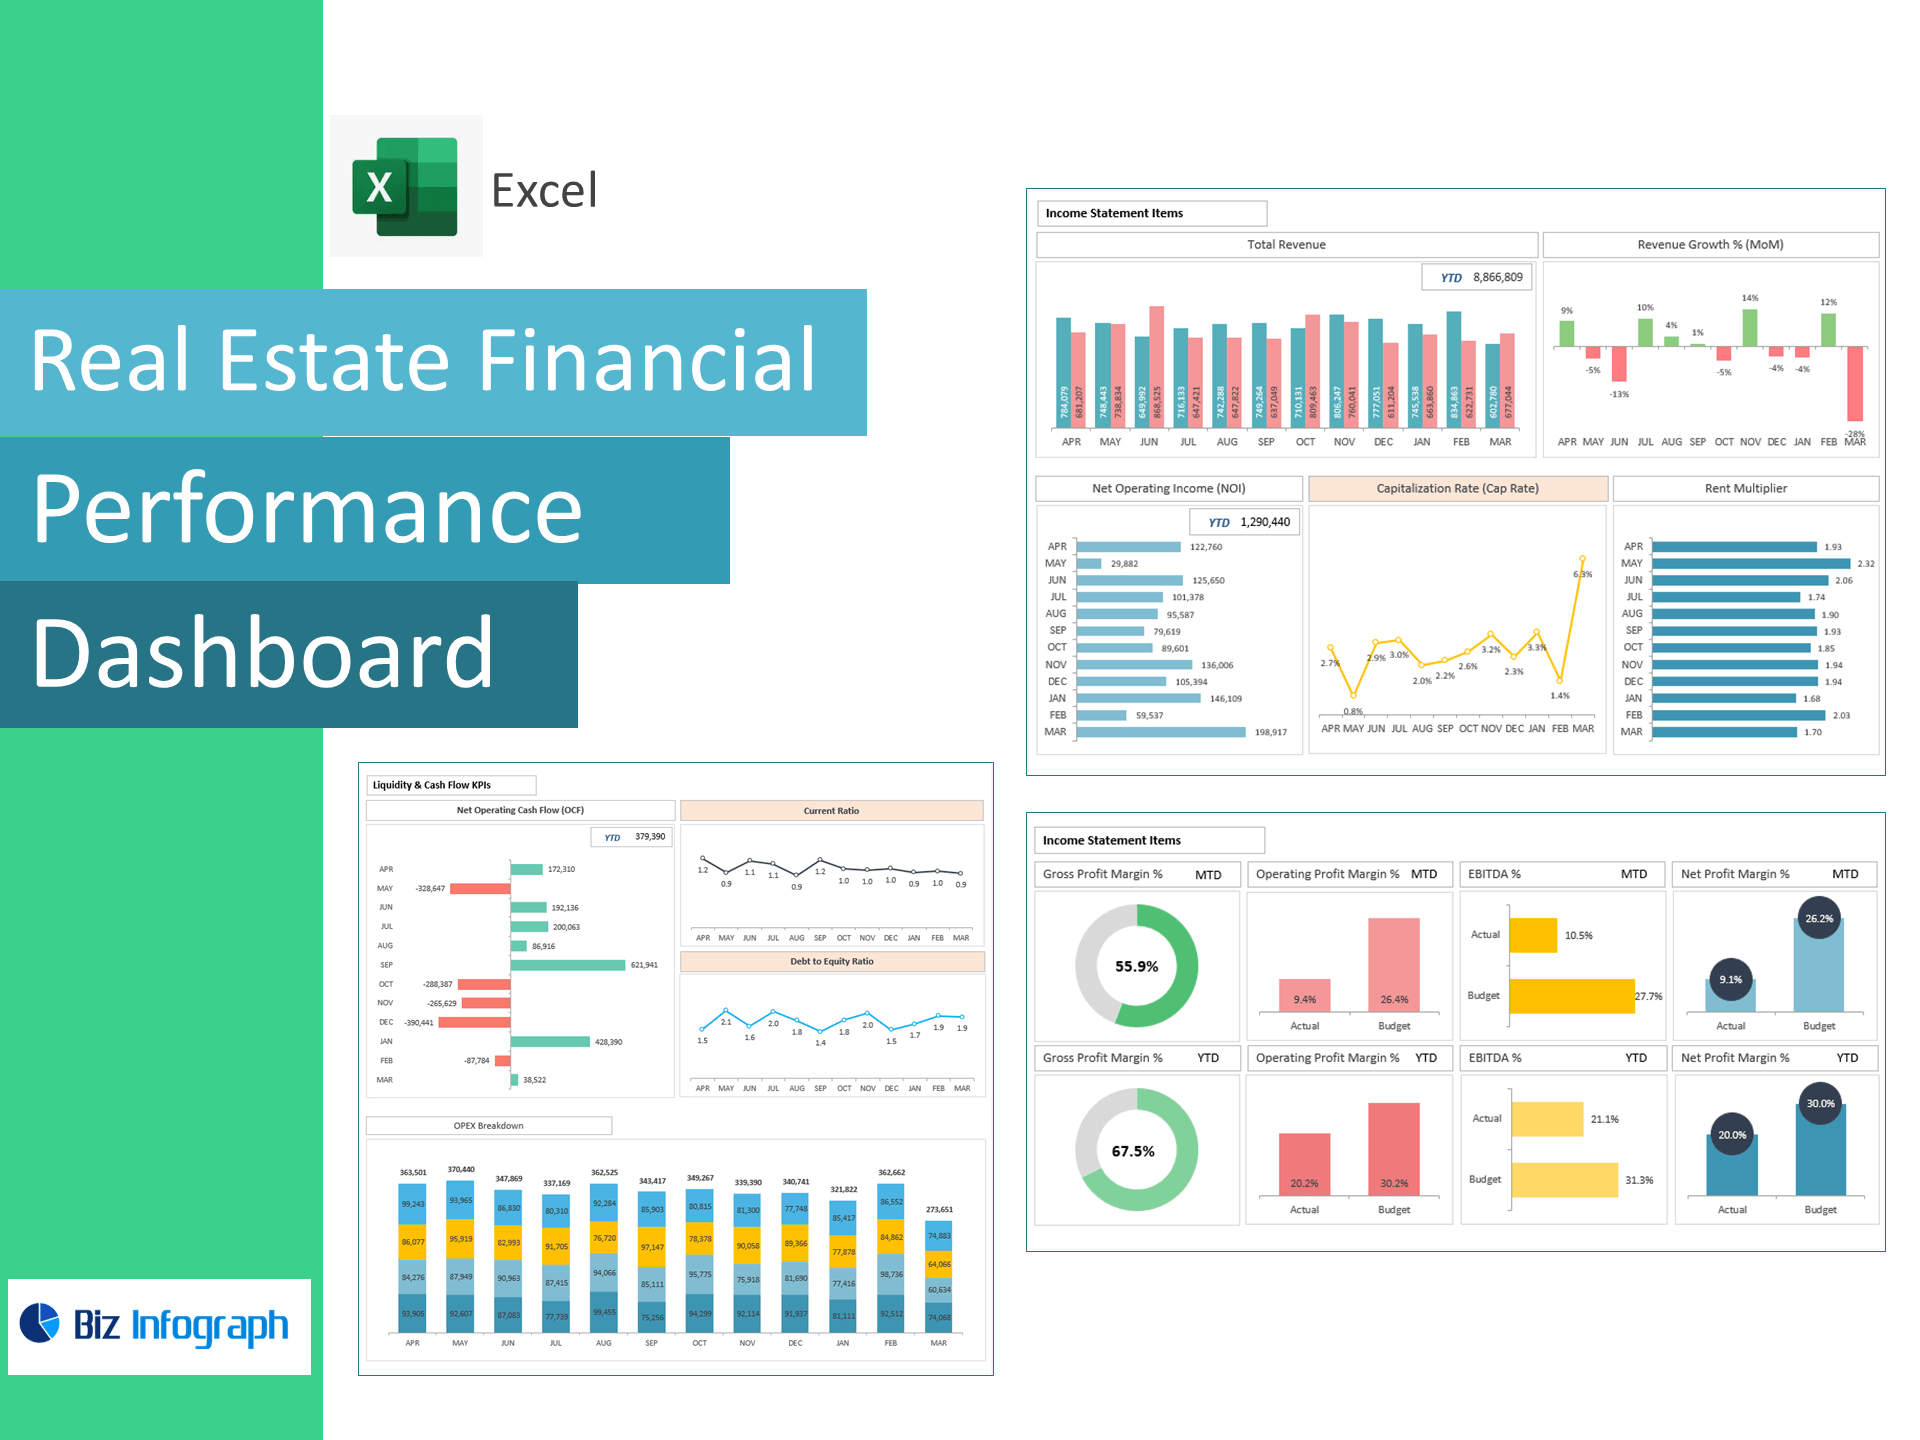
Lower cost per unit: Track spend by property and prove savings with trend lines & targets.
-
Excel-native: Paste data and go—no add-ins or BI tools required.
KPIs included (with ready-made formulas)
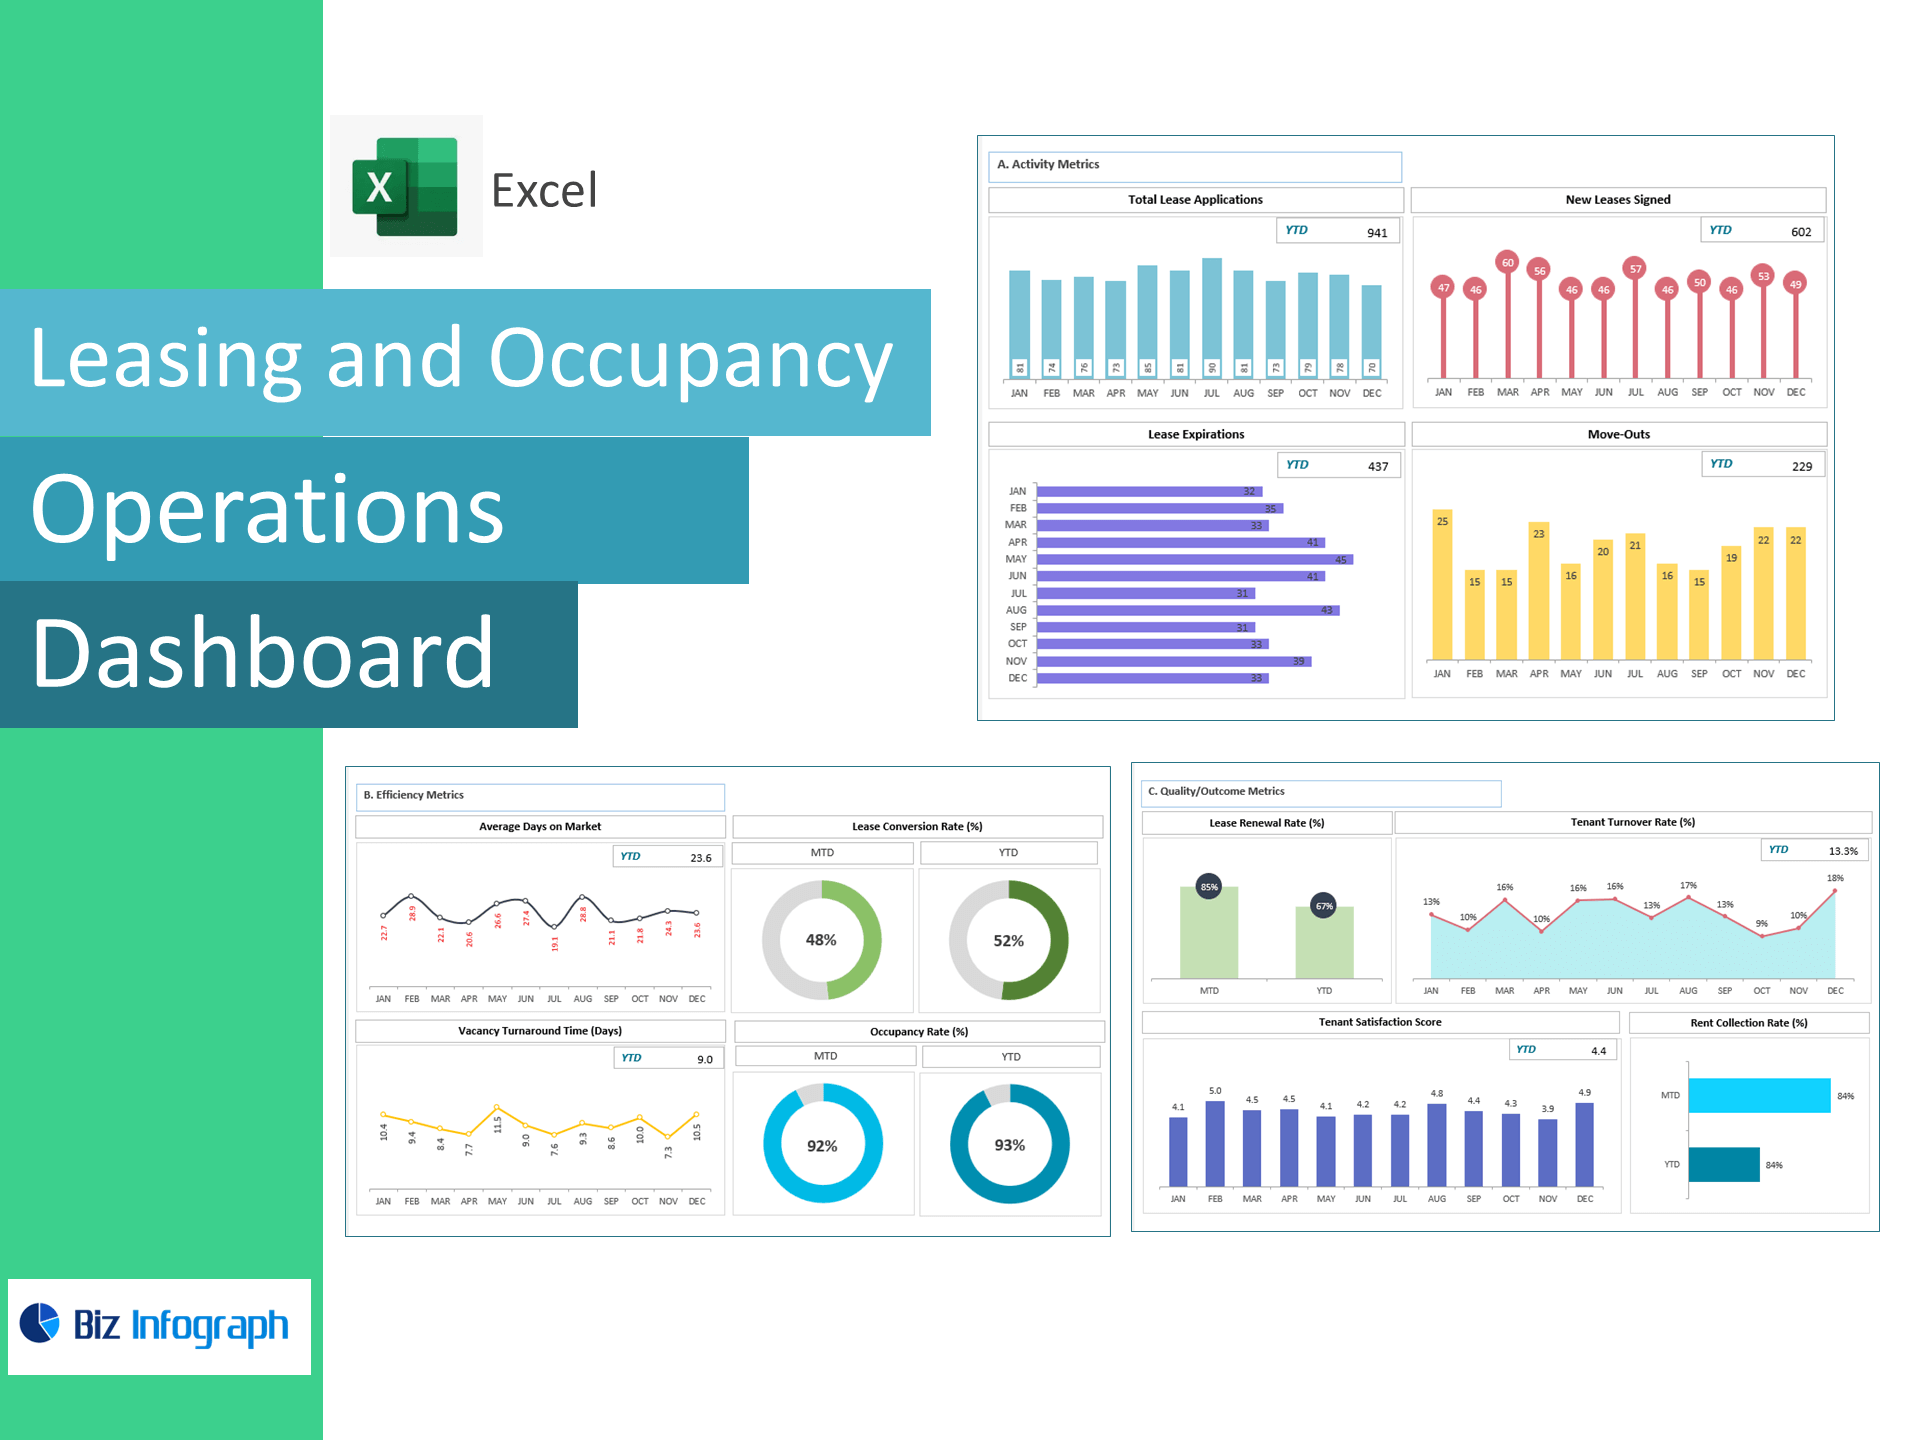
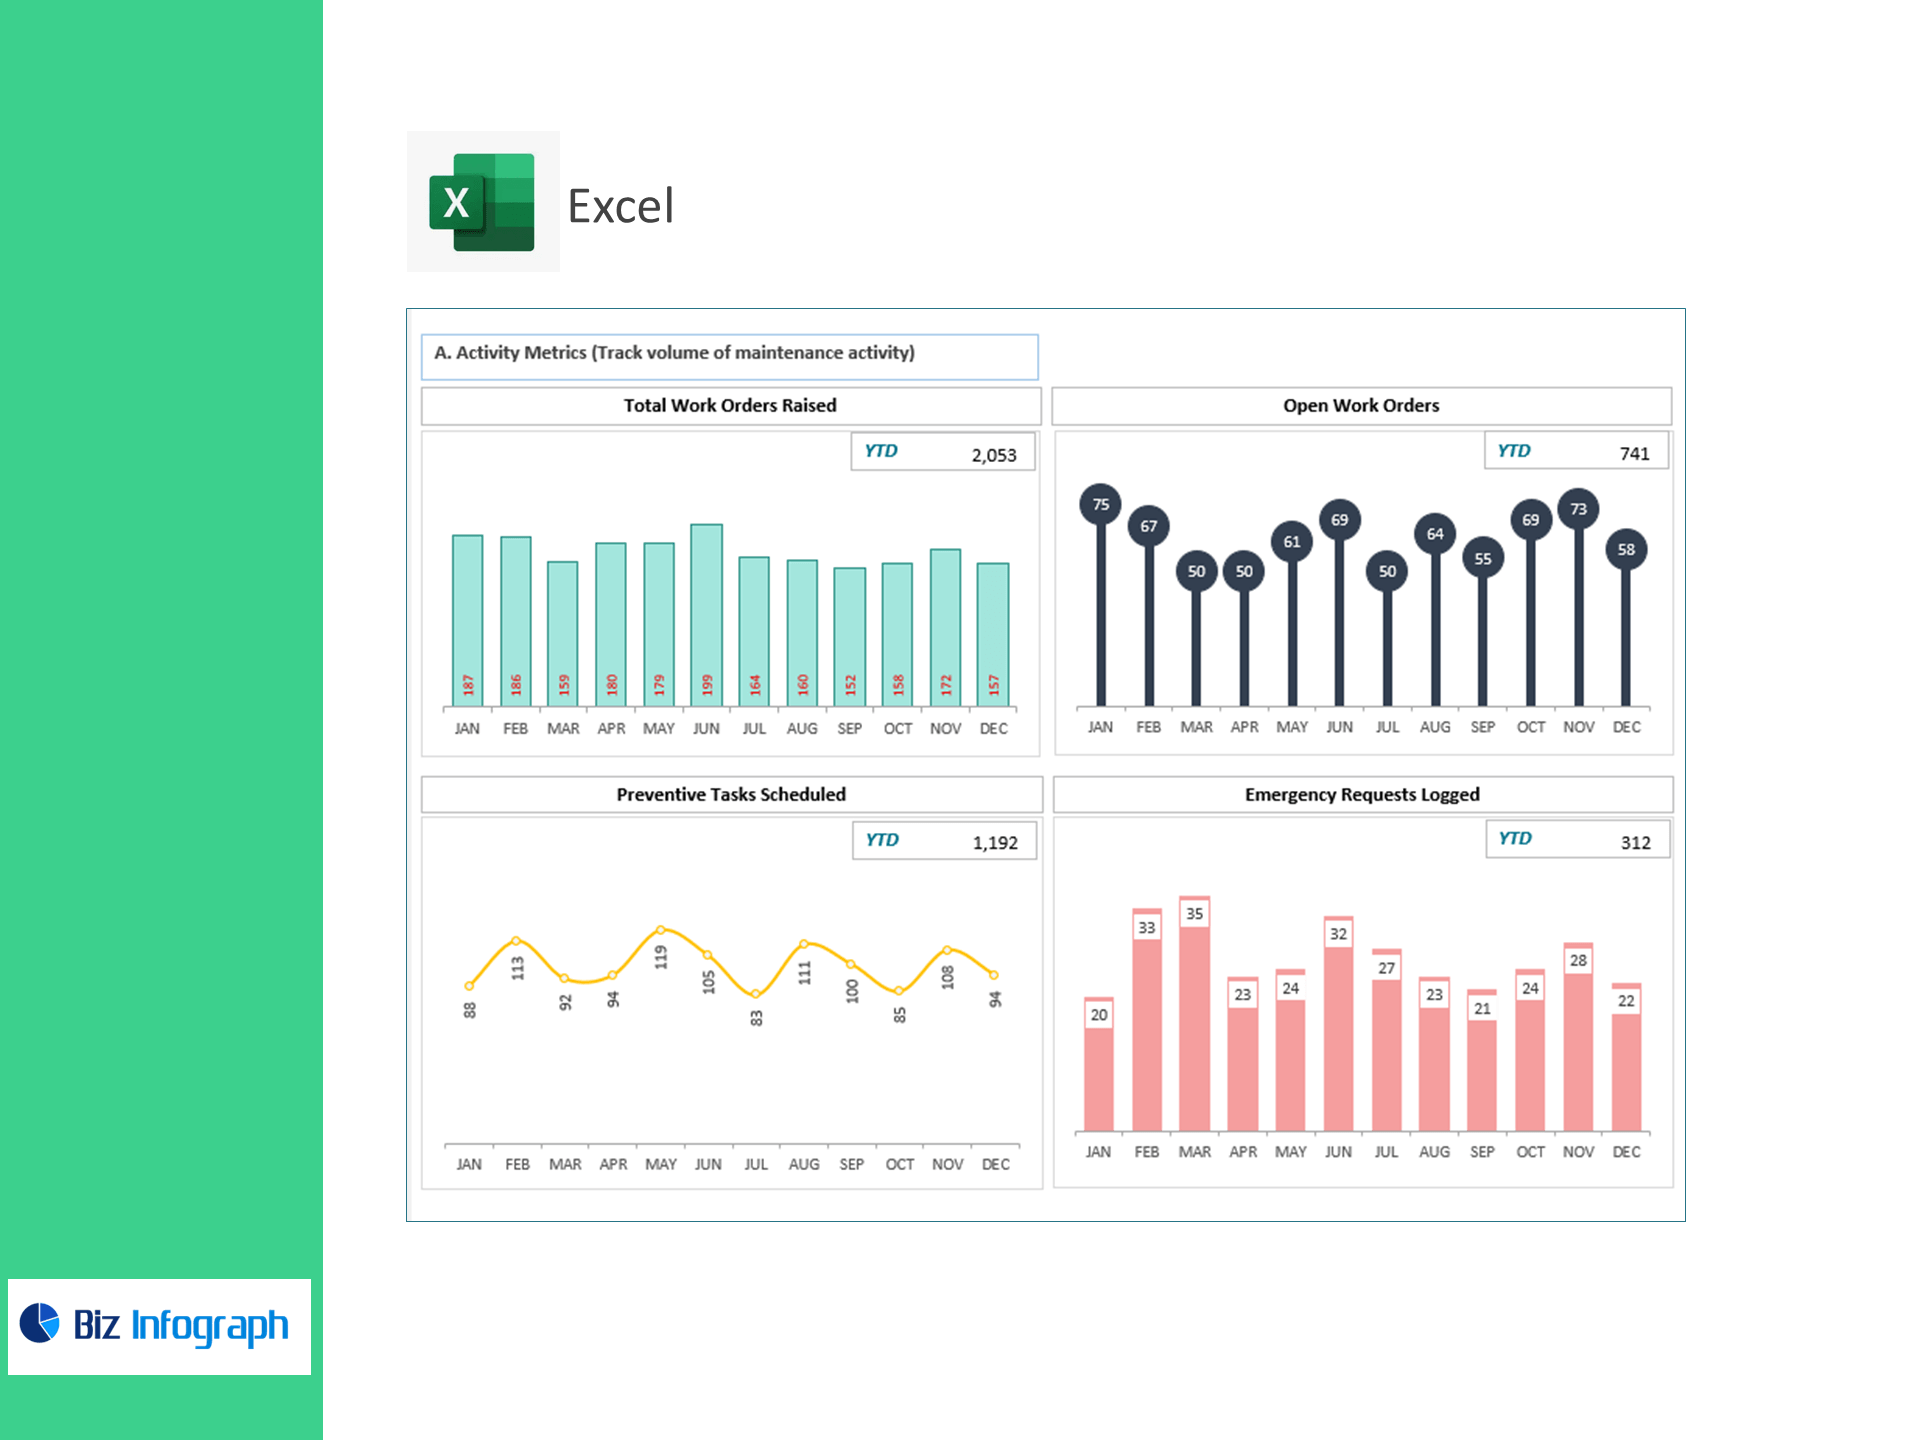
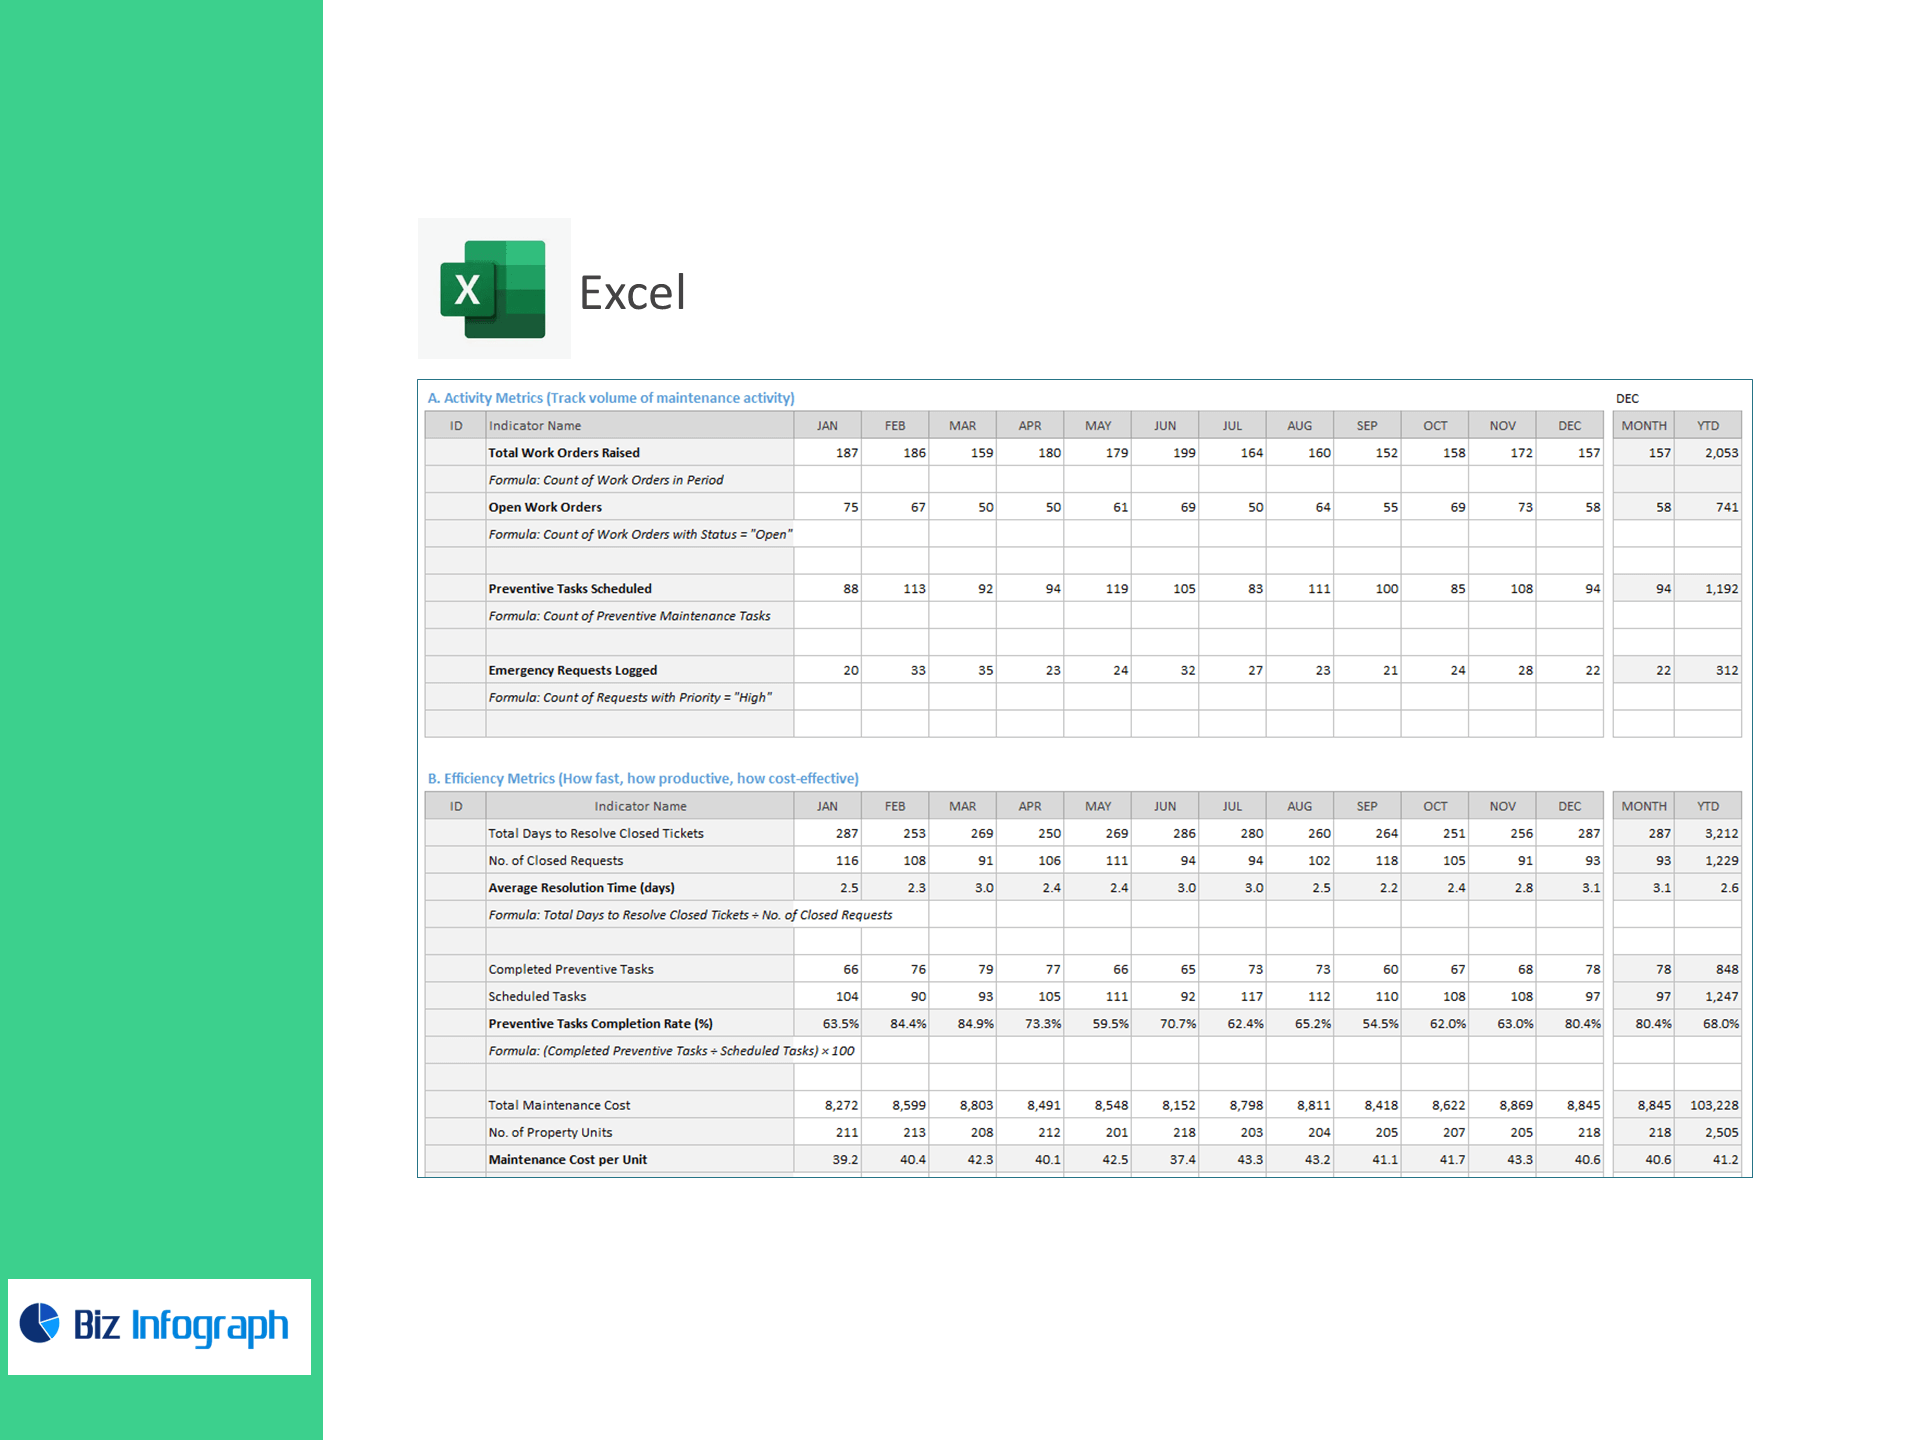
A) Activity Metrics (volume)
-
Total Work Orders Raised — count in period
-
Open Work Orders — count with Status = “Open”
-
Preventive Tasks Scheduled — count of PM tasks
-
Emergency Requests Logged — count with Priority = “High”
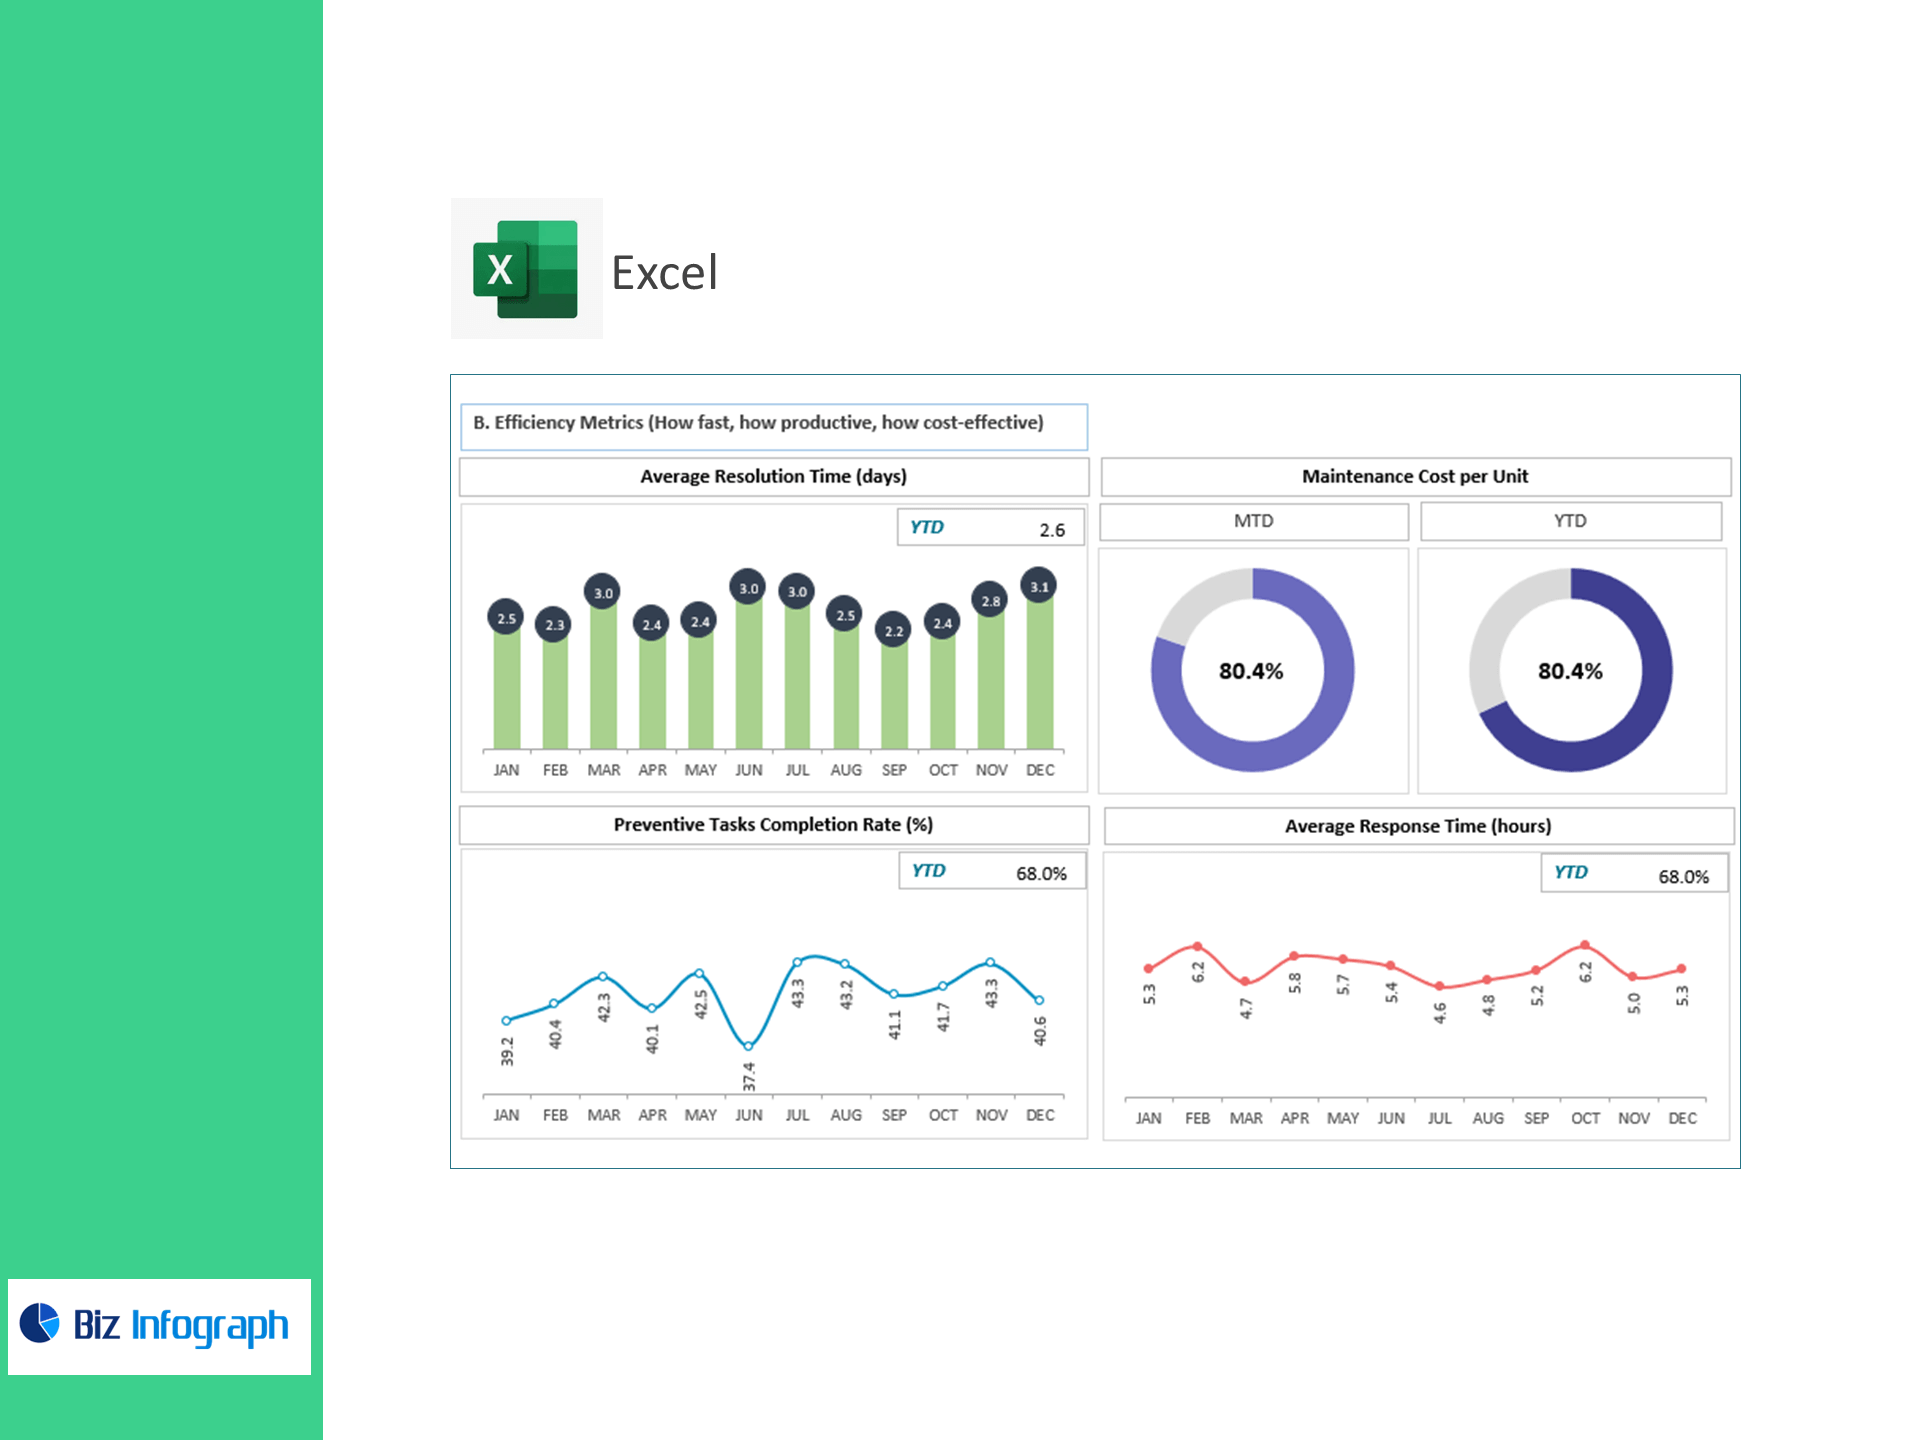
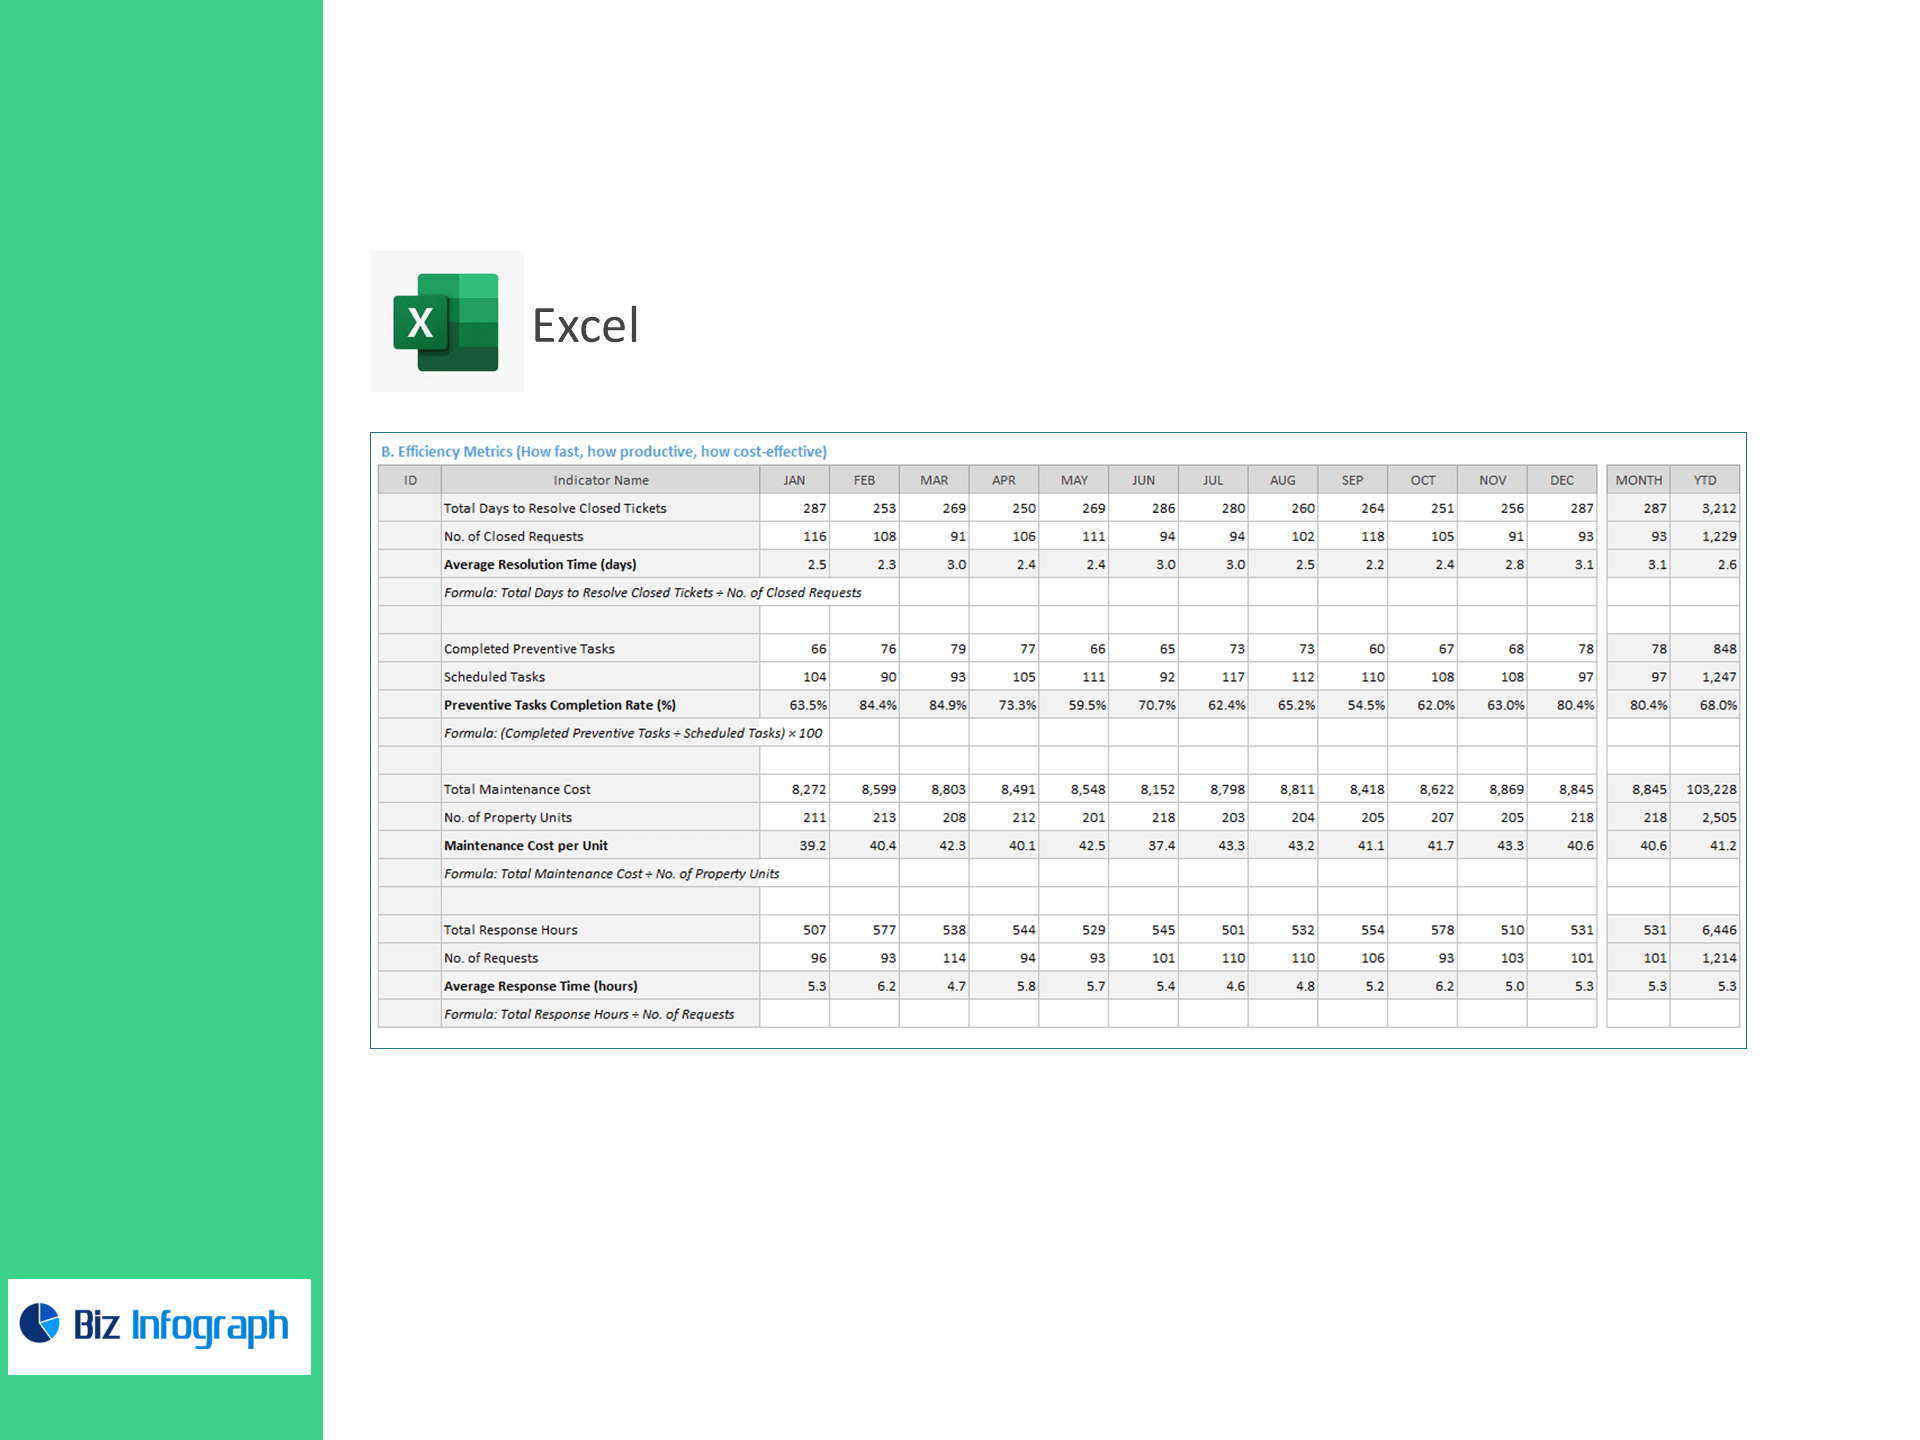
B) Efficiency Metrics (speed, productivity, cost)
-
Average Resolution Time (days) = Total Days to Resolve Closed Tickets ÷ No. of Closed Requests
-
Preventive Tasks Completion Rate (%) = (Completed PM Tasks ÷ Scheduled Tasks) × 100
-
Maintenance Cost per Unit = Total Maintenance Cost ÷ No. of Property Units
-
Average Response Time (hours) = Total Response Hours ÷ No. of Requests
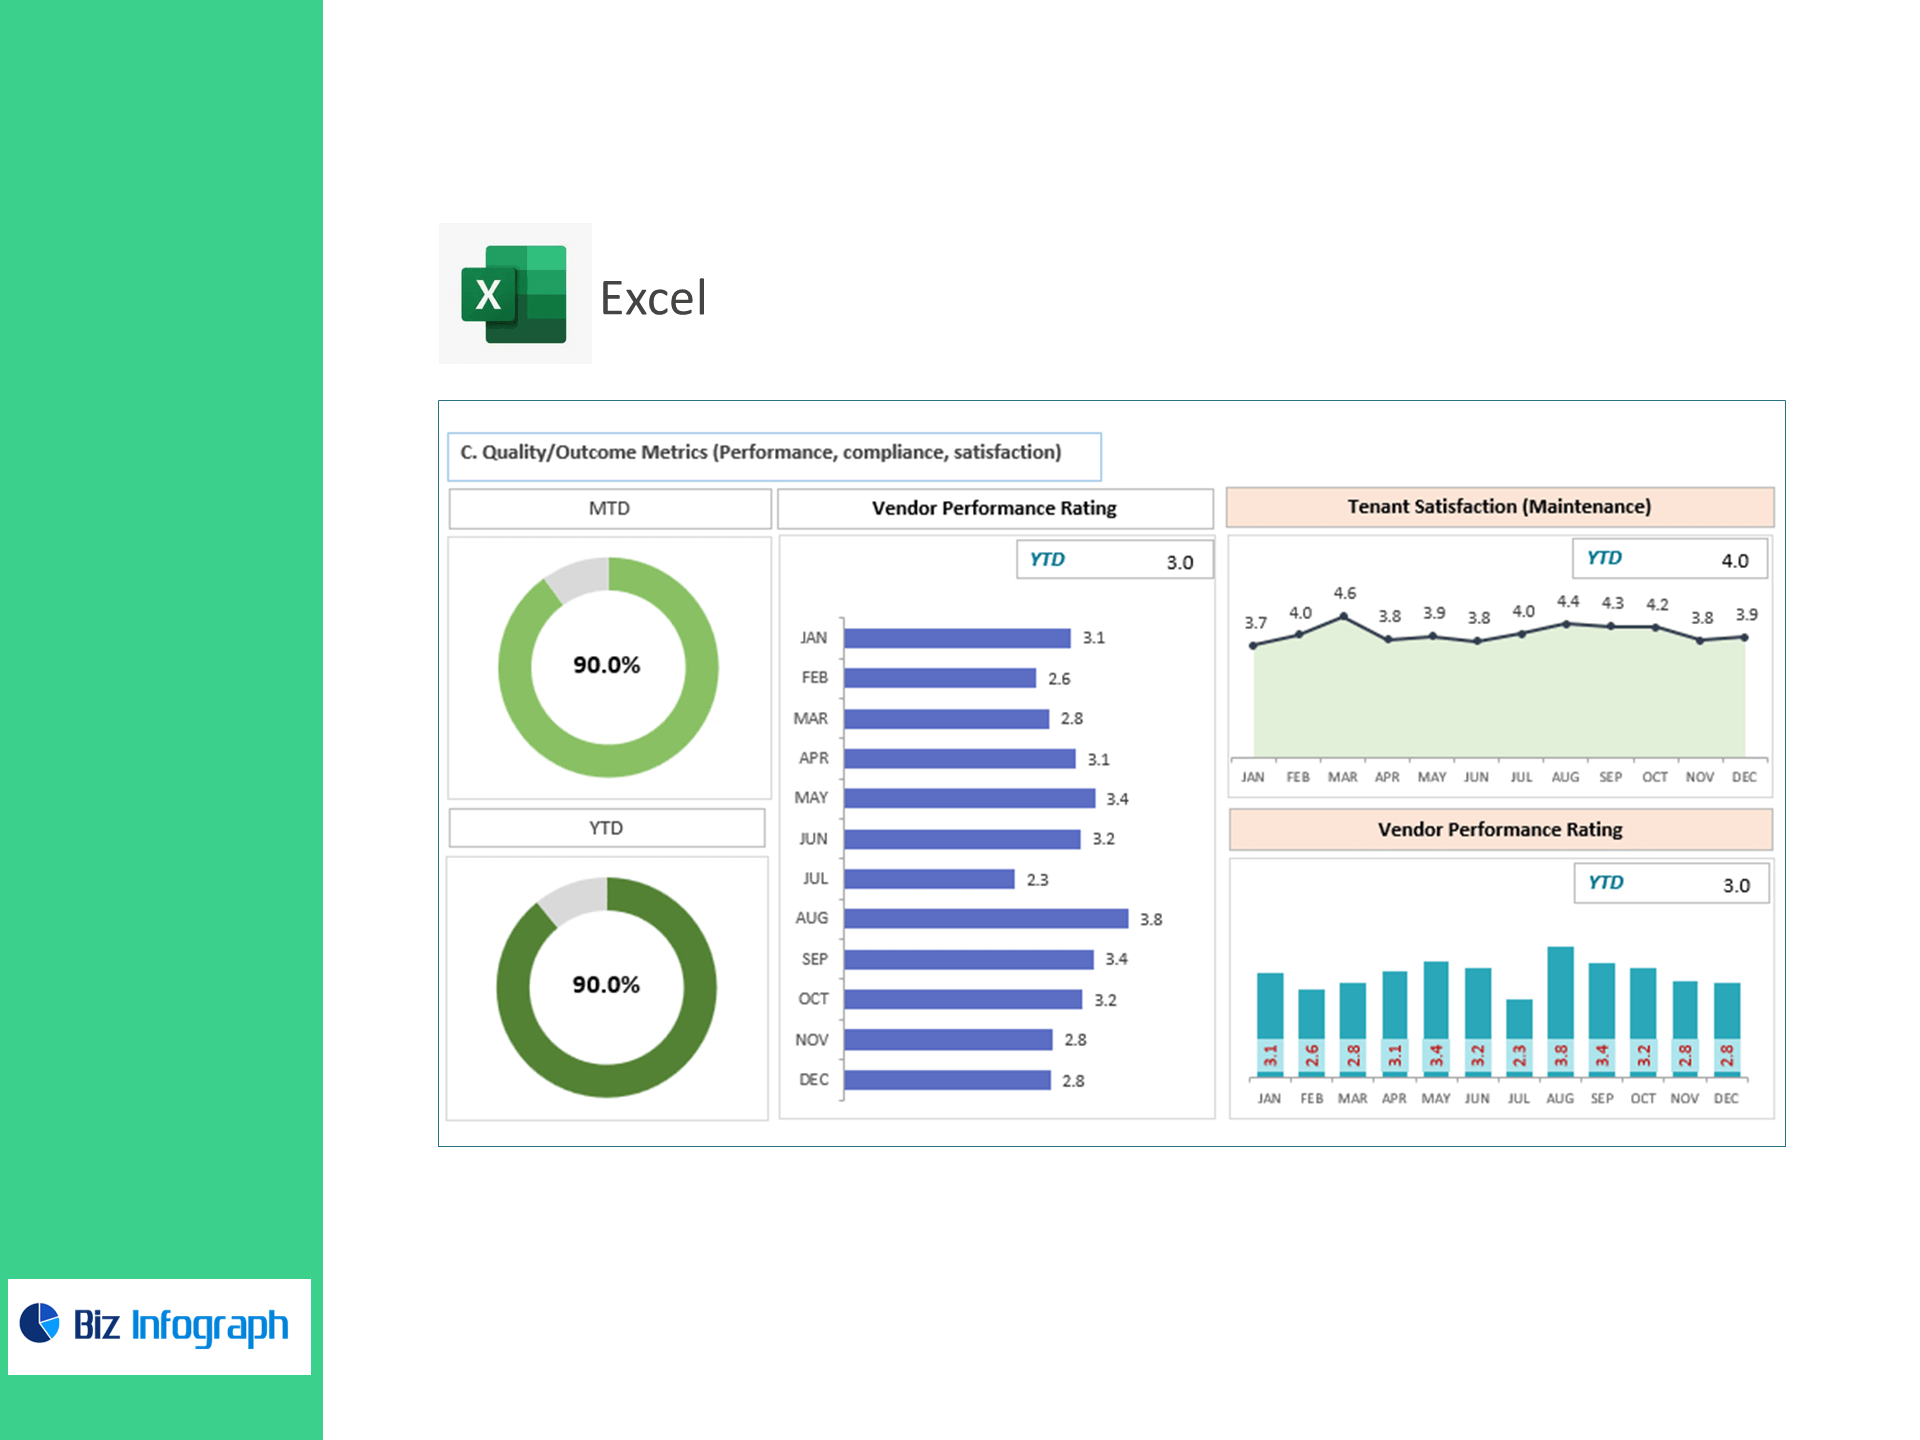
C) Quality / Outcome Metrics (performance, compliance, satisfaction)
-
SLA Compliance Rate (%) = (SLA-Compliant Resolutions ÷ Total Requests) × 100
-
Tenant Satisfaction (Maintenance) = Total Feedback Score ÷ No. of Feedbacks
-
Repeat Issue Rate (%) = (Repeat Work Orders ÷ Closed Work Orders) × 100
-
Vendor Performance Rating = Total Vendor Ratings ÷ No. of Jobs Rated
What’s inside
-
Executive Dashboard: Tiles for Open WOs, Response/Resolution Time, PM Completion, Cost/Unit, SLA %, Satisfaction, Repeat %, Vendor Rating—with variance to target.
-
Work Order Ops View: Trend by property, category, priority, and technician.
-
Preventive Maintenance Tracker: Schedule vs. completion and upcoming PMs.
-
Cost Control Panel: Spend by property/vendor and cost-per-unit drilldowns.
-
Vendor & SLA Scorecards: Compliance and quality by vendor/job type.
-
Targets & Assumptions: Enter KPI targets; automatic Above/Below Target status.
-
Clean Data Sheets: Import-ready tables for Work Orders, PM Schedule, Time/Hours, Costs, Vendors, and Feedback.
How it works
-
Paste your CSV/Excel exports into the provided tables.
-
Set reporting period and KPI targets.
-
Review visuals to prioritize emergencies, schedule PMs, and reduce repeat issues.
Benefits
-
Faster fixes: Lower response and resolution times with clear bottleneck alerts.
-
Less reactive work: Lift PM completion and reduce emergency tickets.
-
Happier tenants: Improve SLA compliance and satisfaction while tracking collections impact indirectly via reduced downtime.
-
Smarter spending: Monitor cost per unit and vendor quality to negotiate better rates.
For ready-to-use Dashboard Templates: