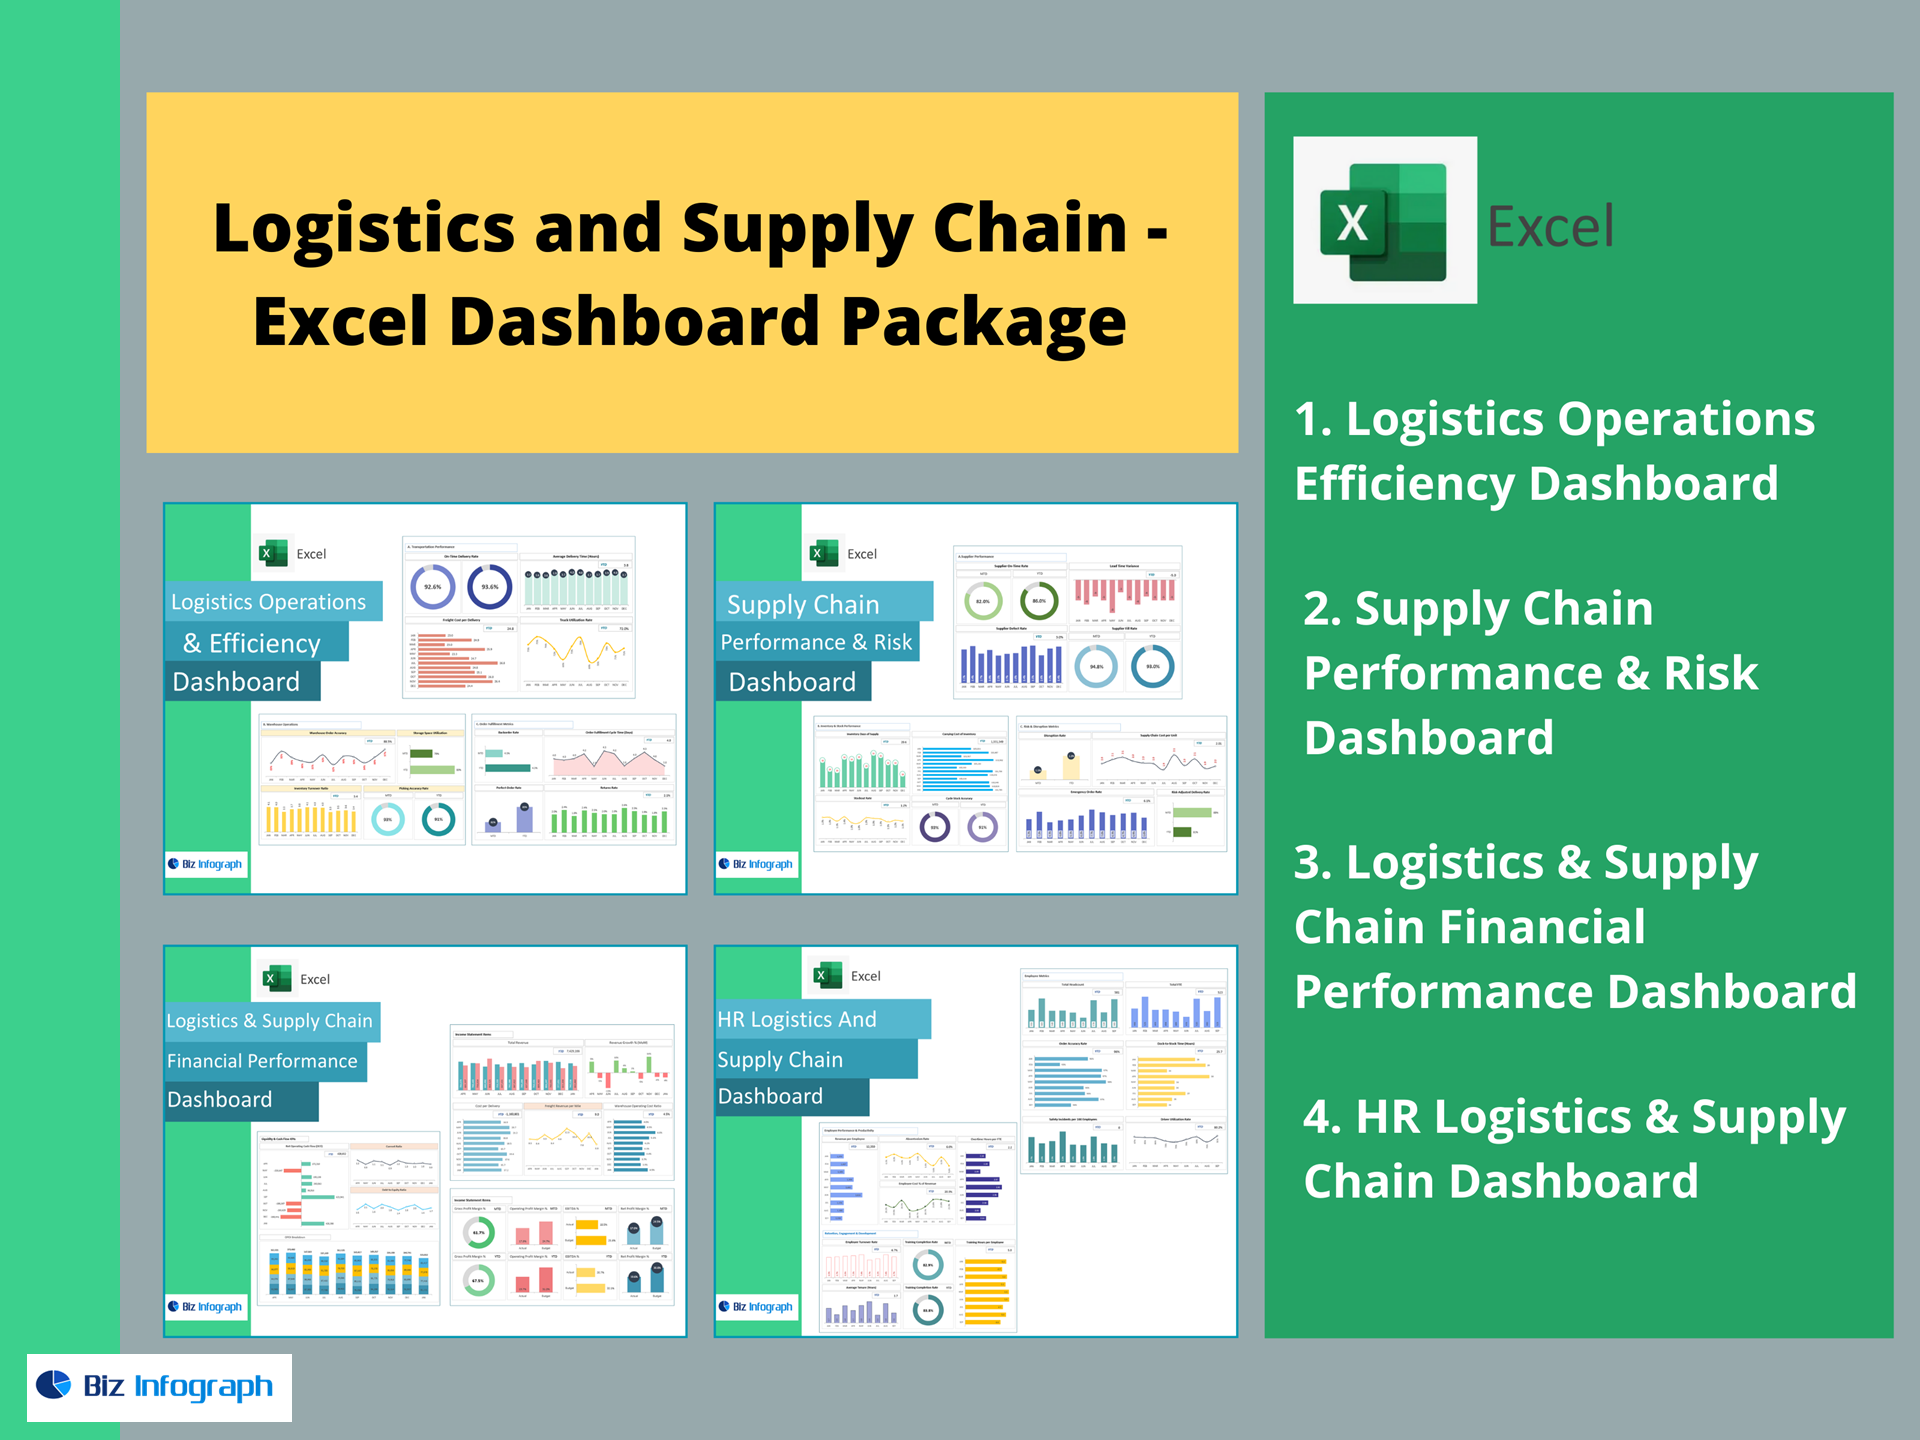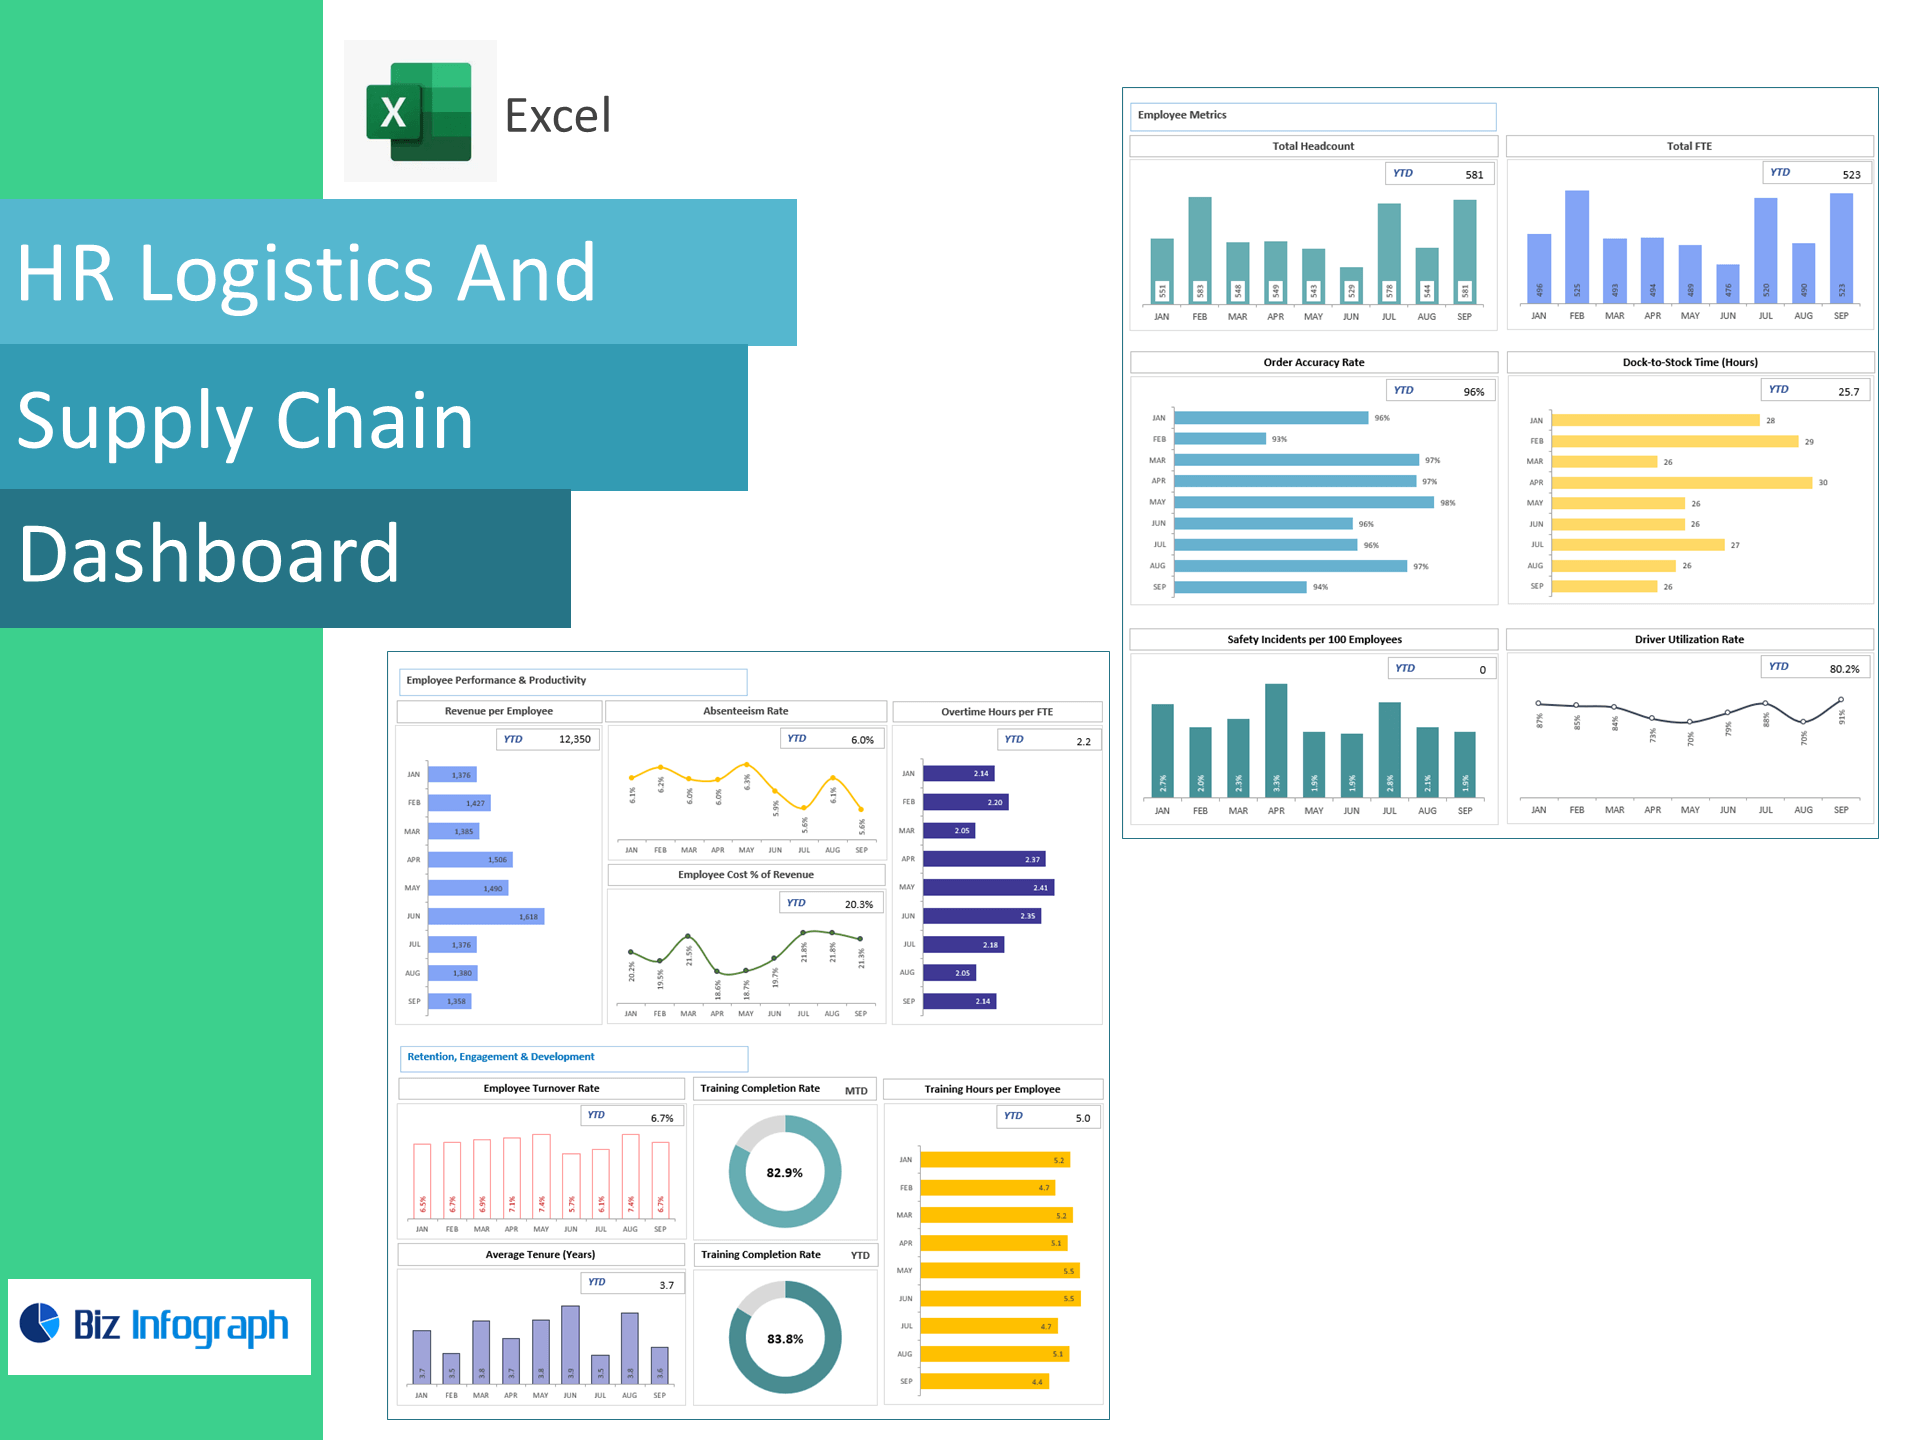
HR Logistics & Supply Chain — Excel Template
Run a safer, leaner, more productive supply-chain workforce—right in Excel. Purpose-built for warehouse, transportation, and 3PL teams, this template turns HR, timekeeping, and ops data into a live dashboard tracking FTEs, order accuracy, dock-to-stock time, safety incidents, driver utilization, revenue per employee, absenteeism, overtime per FTE, employee cost % of revenue, turnover, tenure, and training KPIs.
Why operations teams choose this template
-
Workforce + Ops in one view: See how staffing levels affect order accuracy and dock-to-stock.
-
Control labor costs: Monitor overtime/FTE and employee cost % of revenue with instant variance flags.
-
Protect safety & service: Track incidents per 100 employees and driver utilization alongside productivity.
-
Excel-native: Paste data and go—no add-ins or BI setup required.
KPIs included (ready-made formulas)
Headcount & Capacity
-
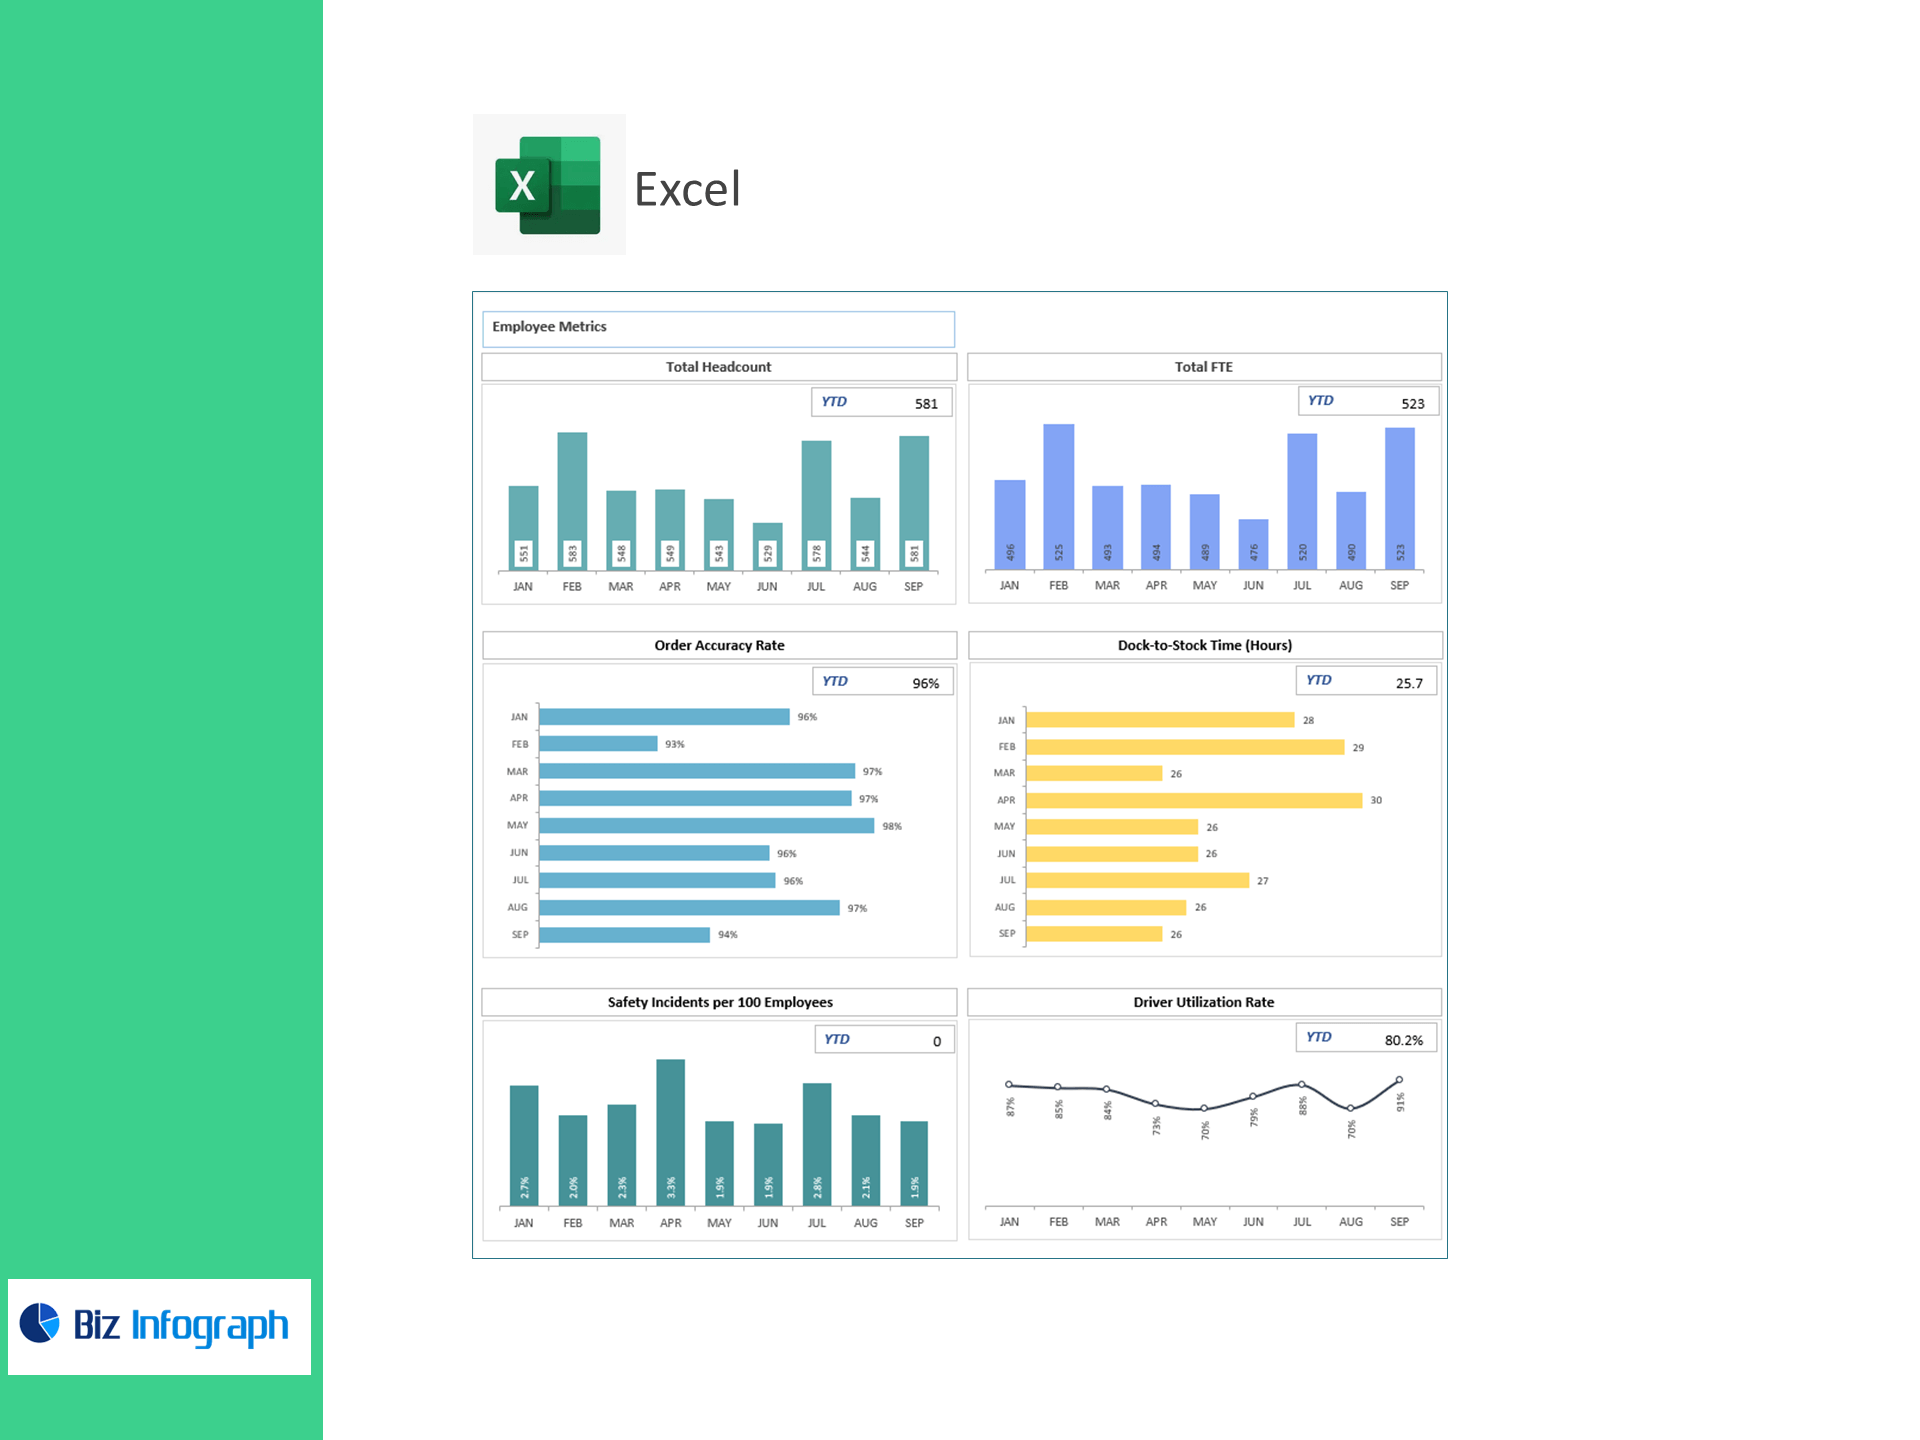
Total Headcount, Total FTE
Operations & Safety
-
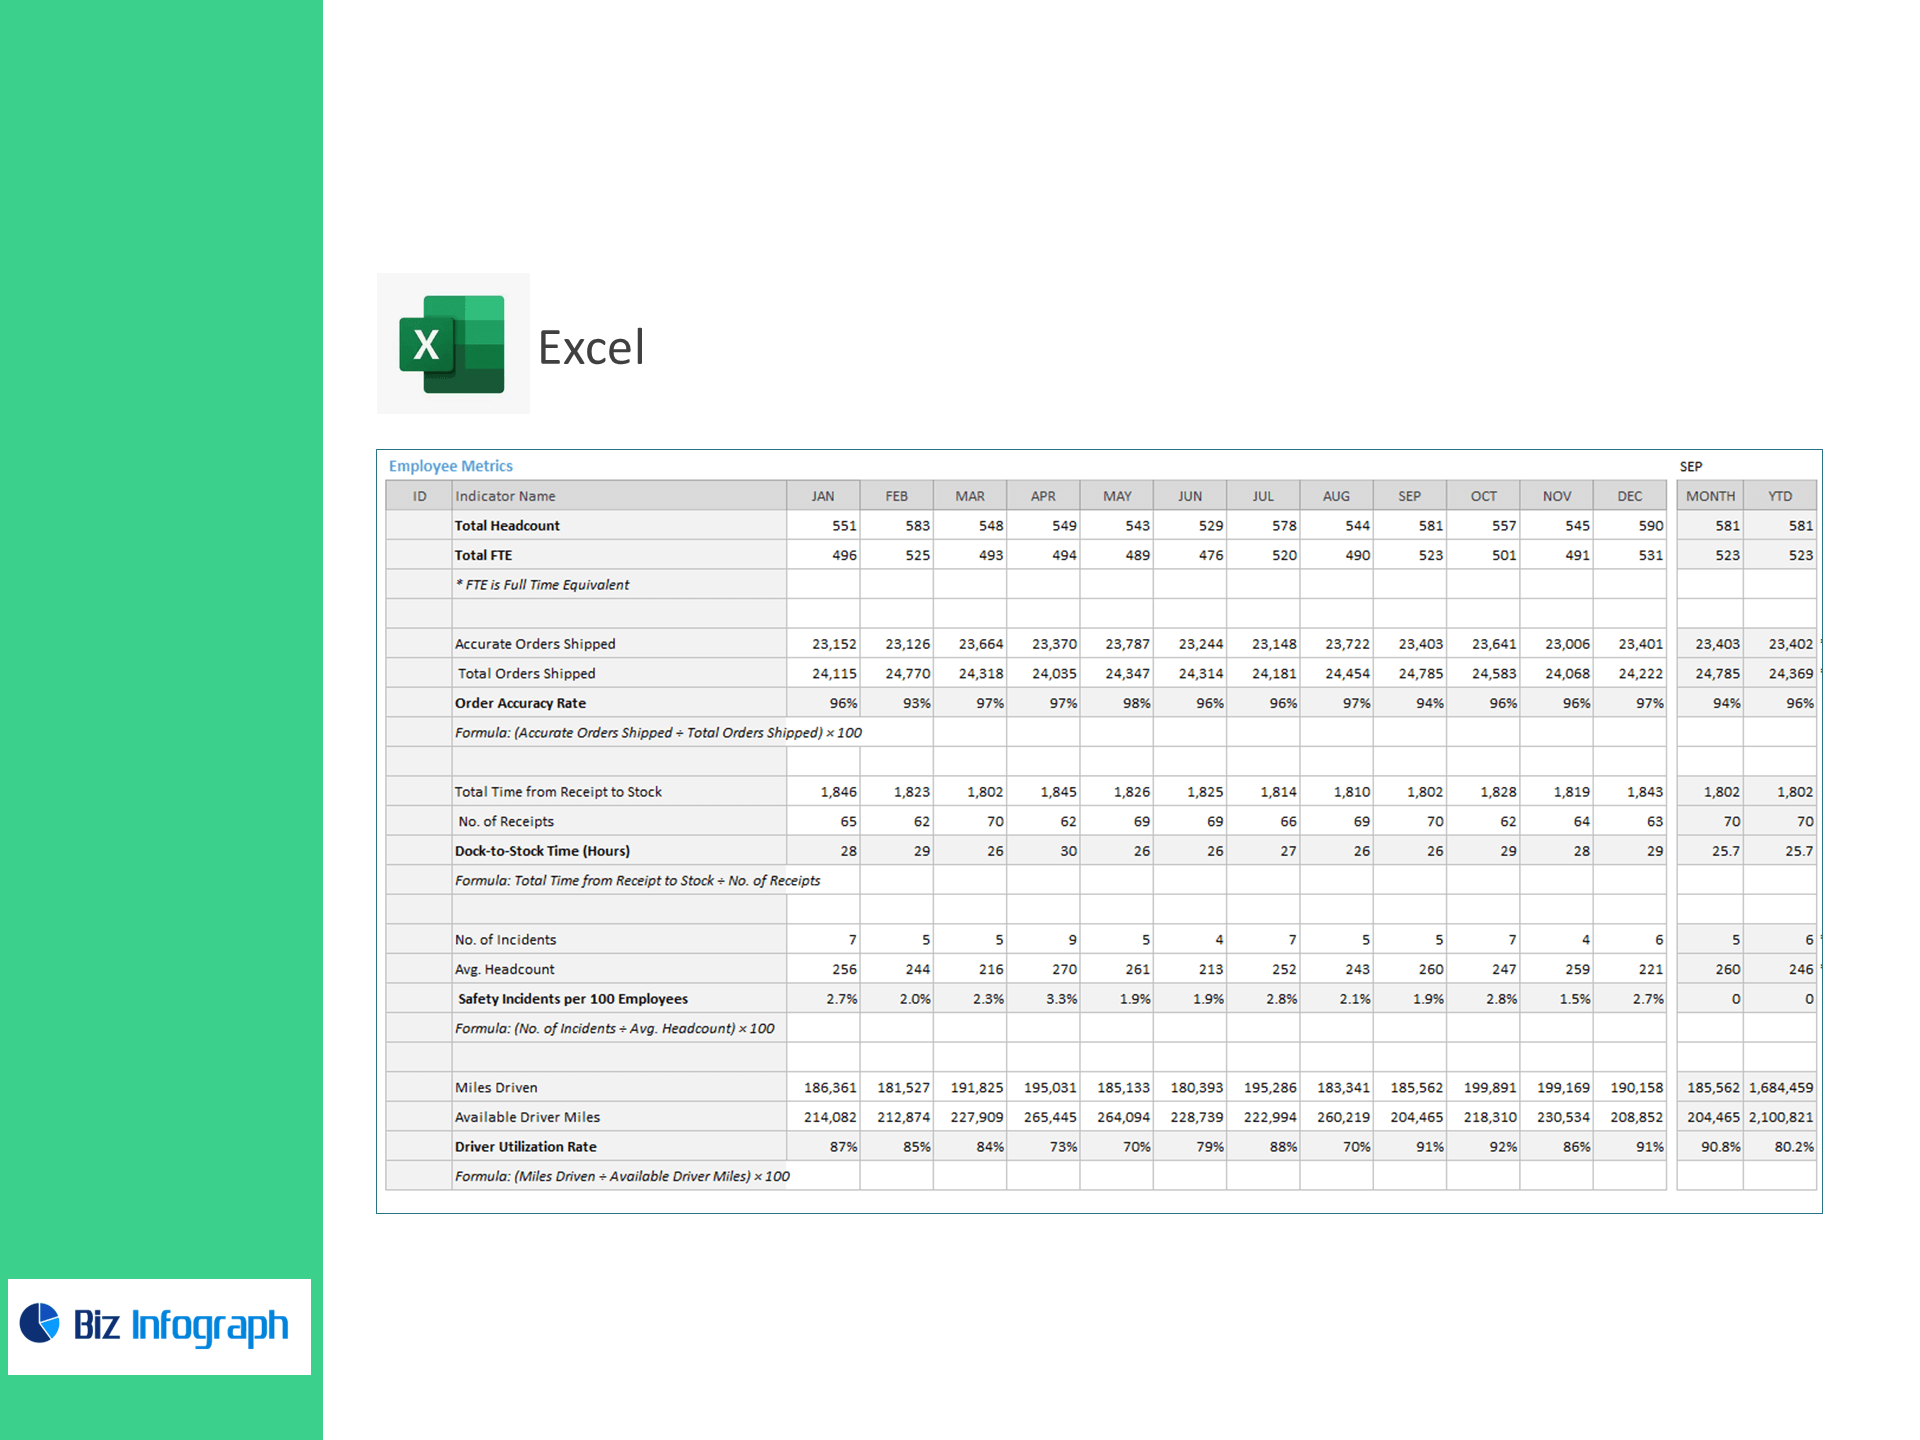
Order Accuracy Rate (%) = (Accurate Orders ÷ Total Orders) × 100
-
Dock-to-Stock Time (hrs) = Total Time from Receipt to Stock ÷ No. of Receipts
-
Safety Incidents per 100 Employees = (Incidents ÷ Avg. Headcount) × 100
-
Driver Utilization Rate (%) = (Miles Driven ÷ Available Driver Miles) × 100
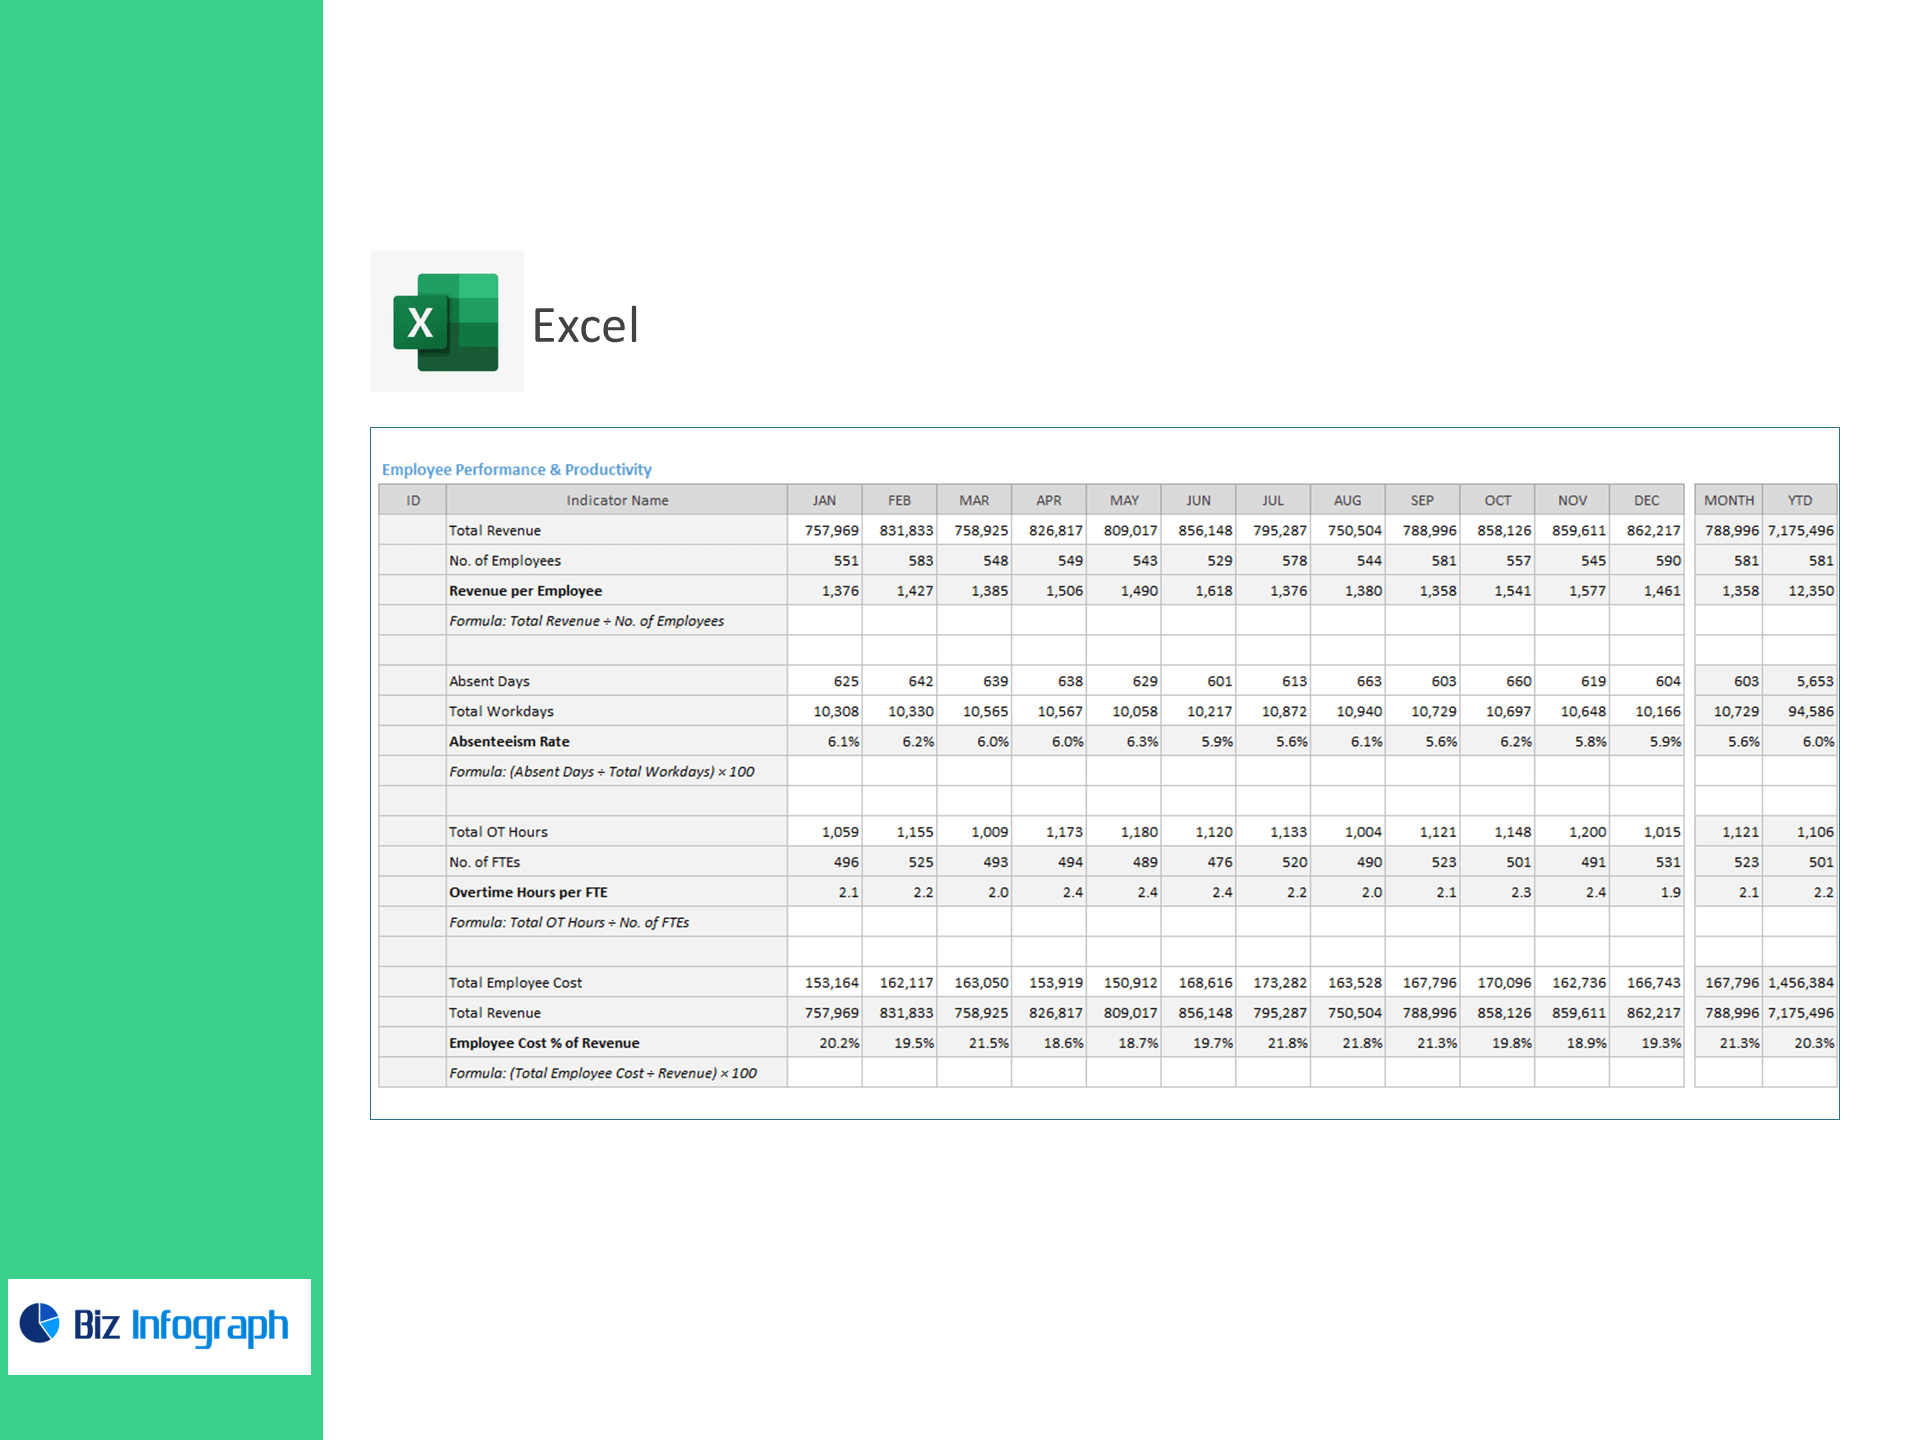
Productivity & Cost
-
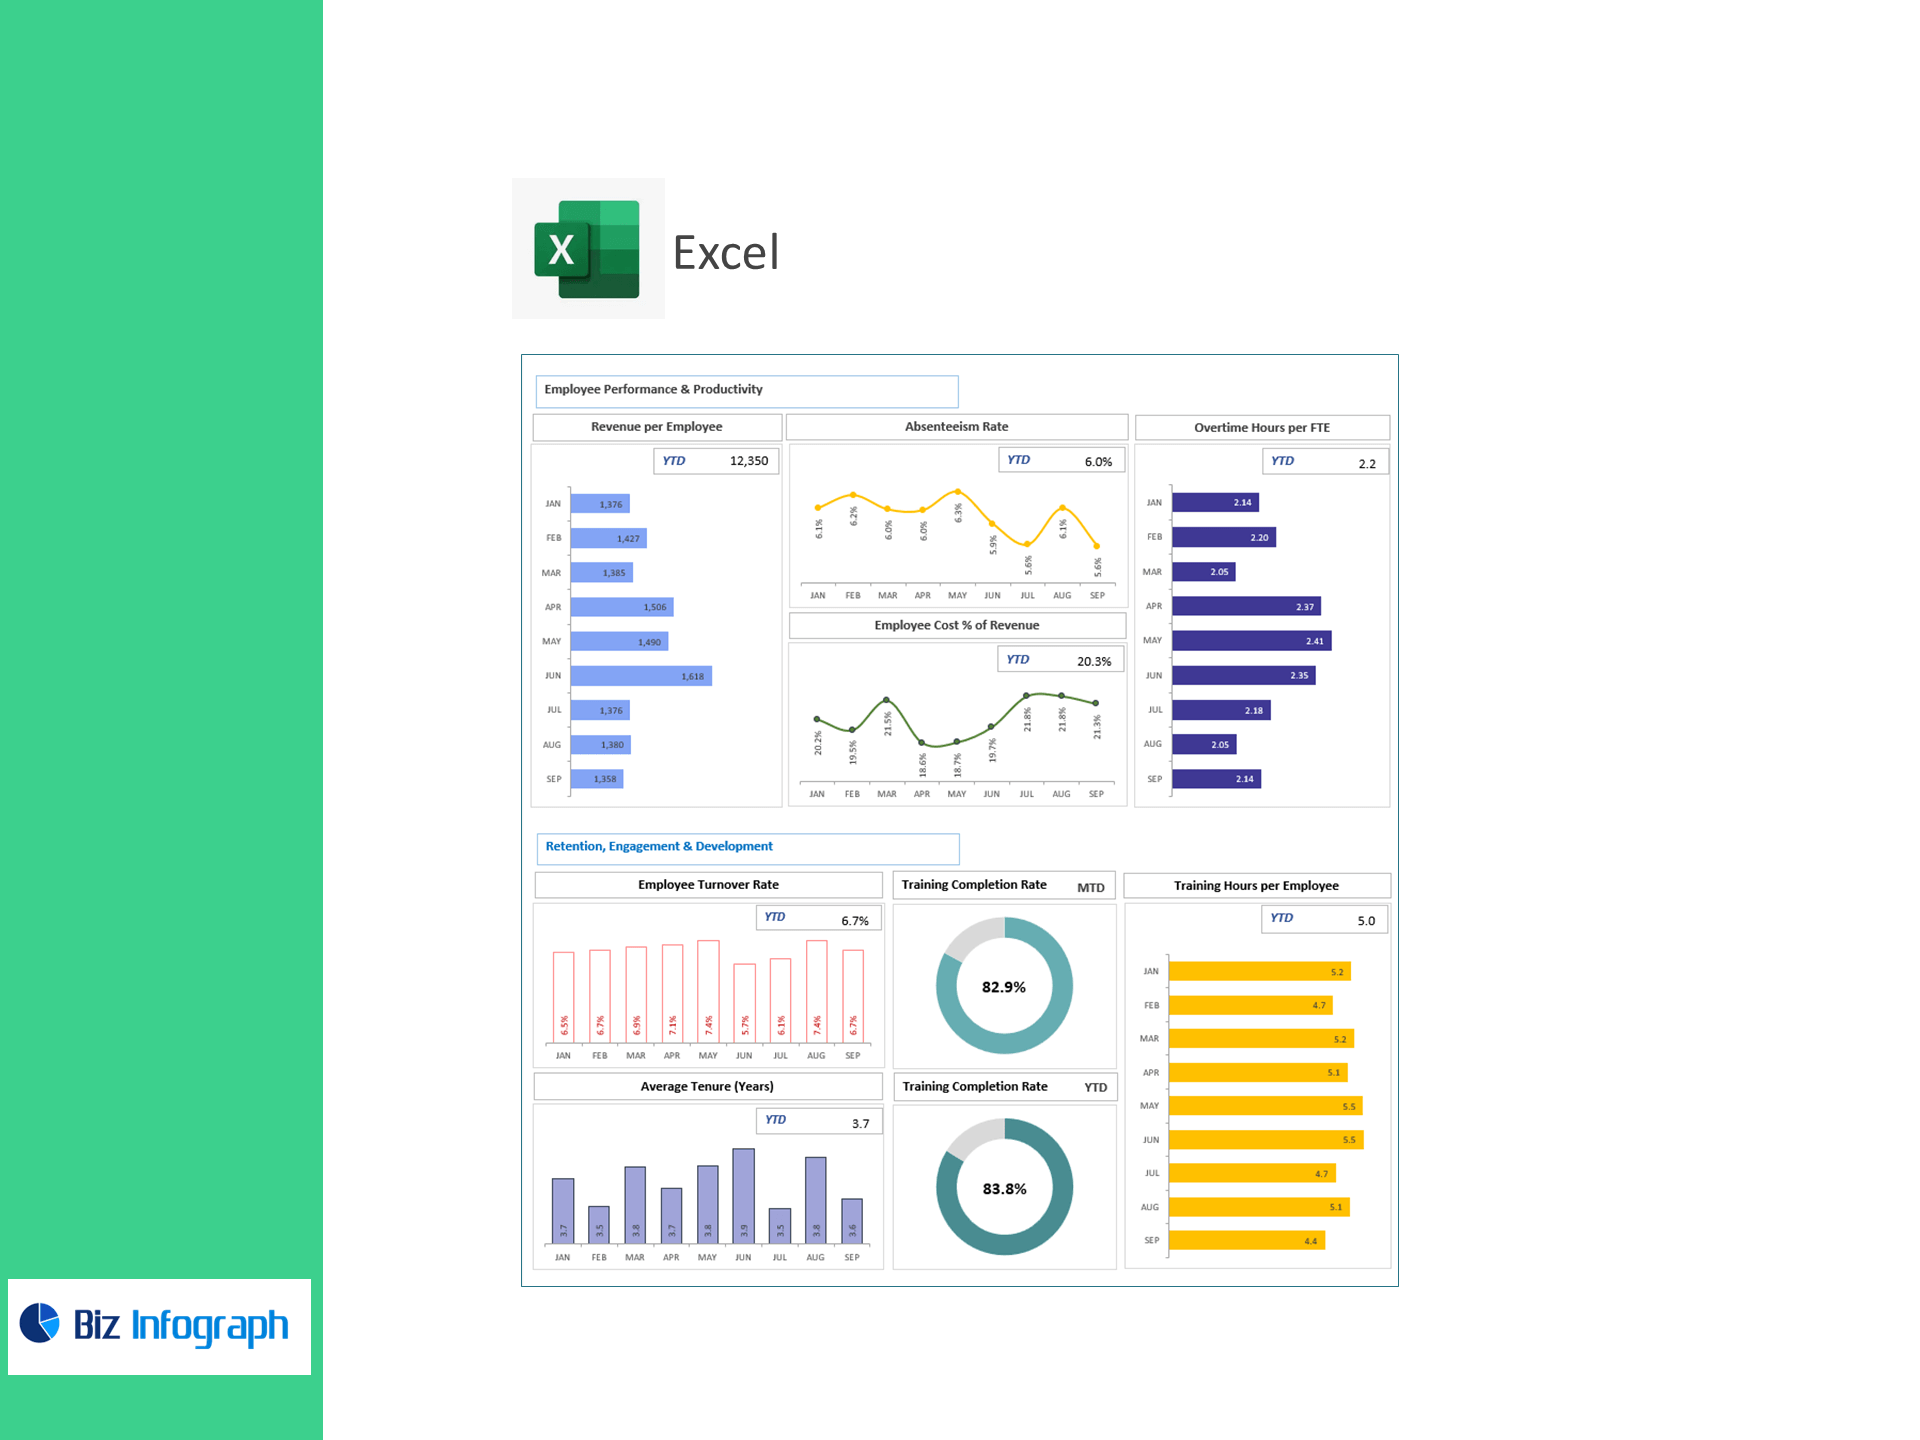
Revenue per Employee = Revenue ÷ Employees
-
Absenteeism Rate (%) = (Absent Days ÷ Workdays) × 100
-
Overtime Hours per FTE = Total OT Hours ÷ FTEs
-
Employee Cost % of Revenue = (Total Employee Cost ÷ Revenue) × 100
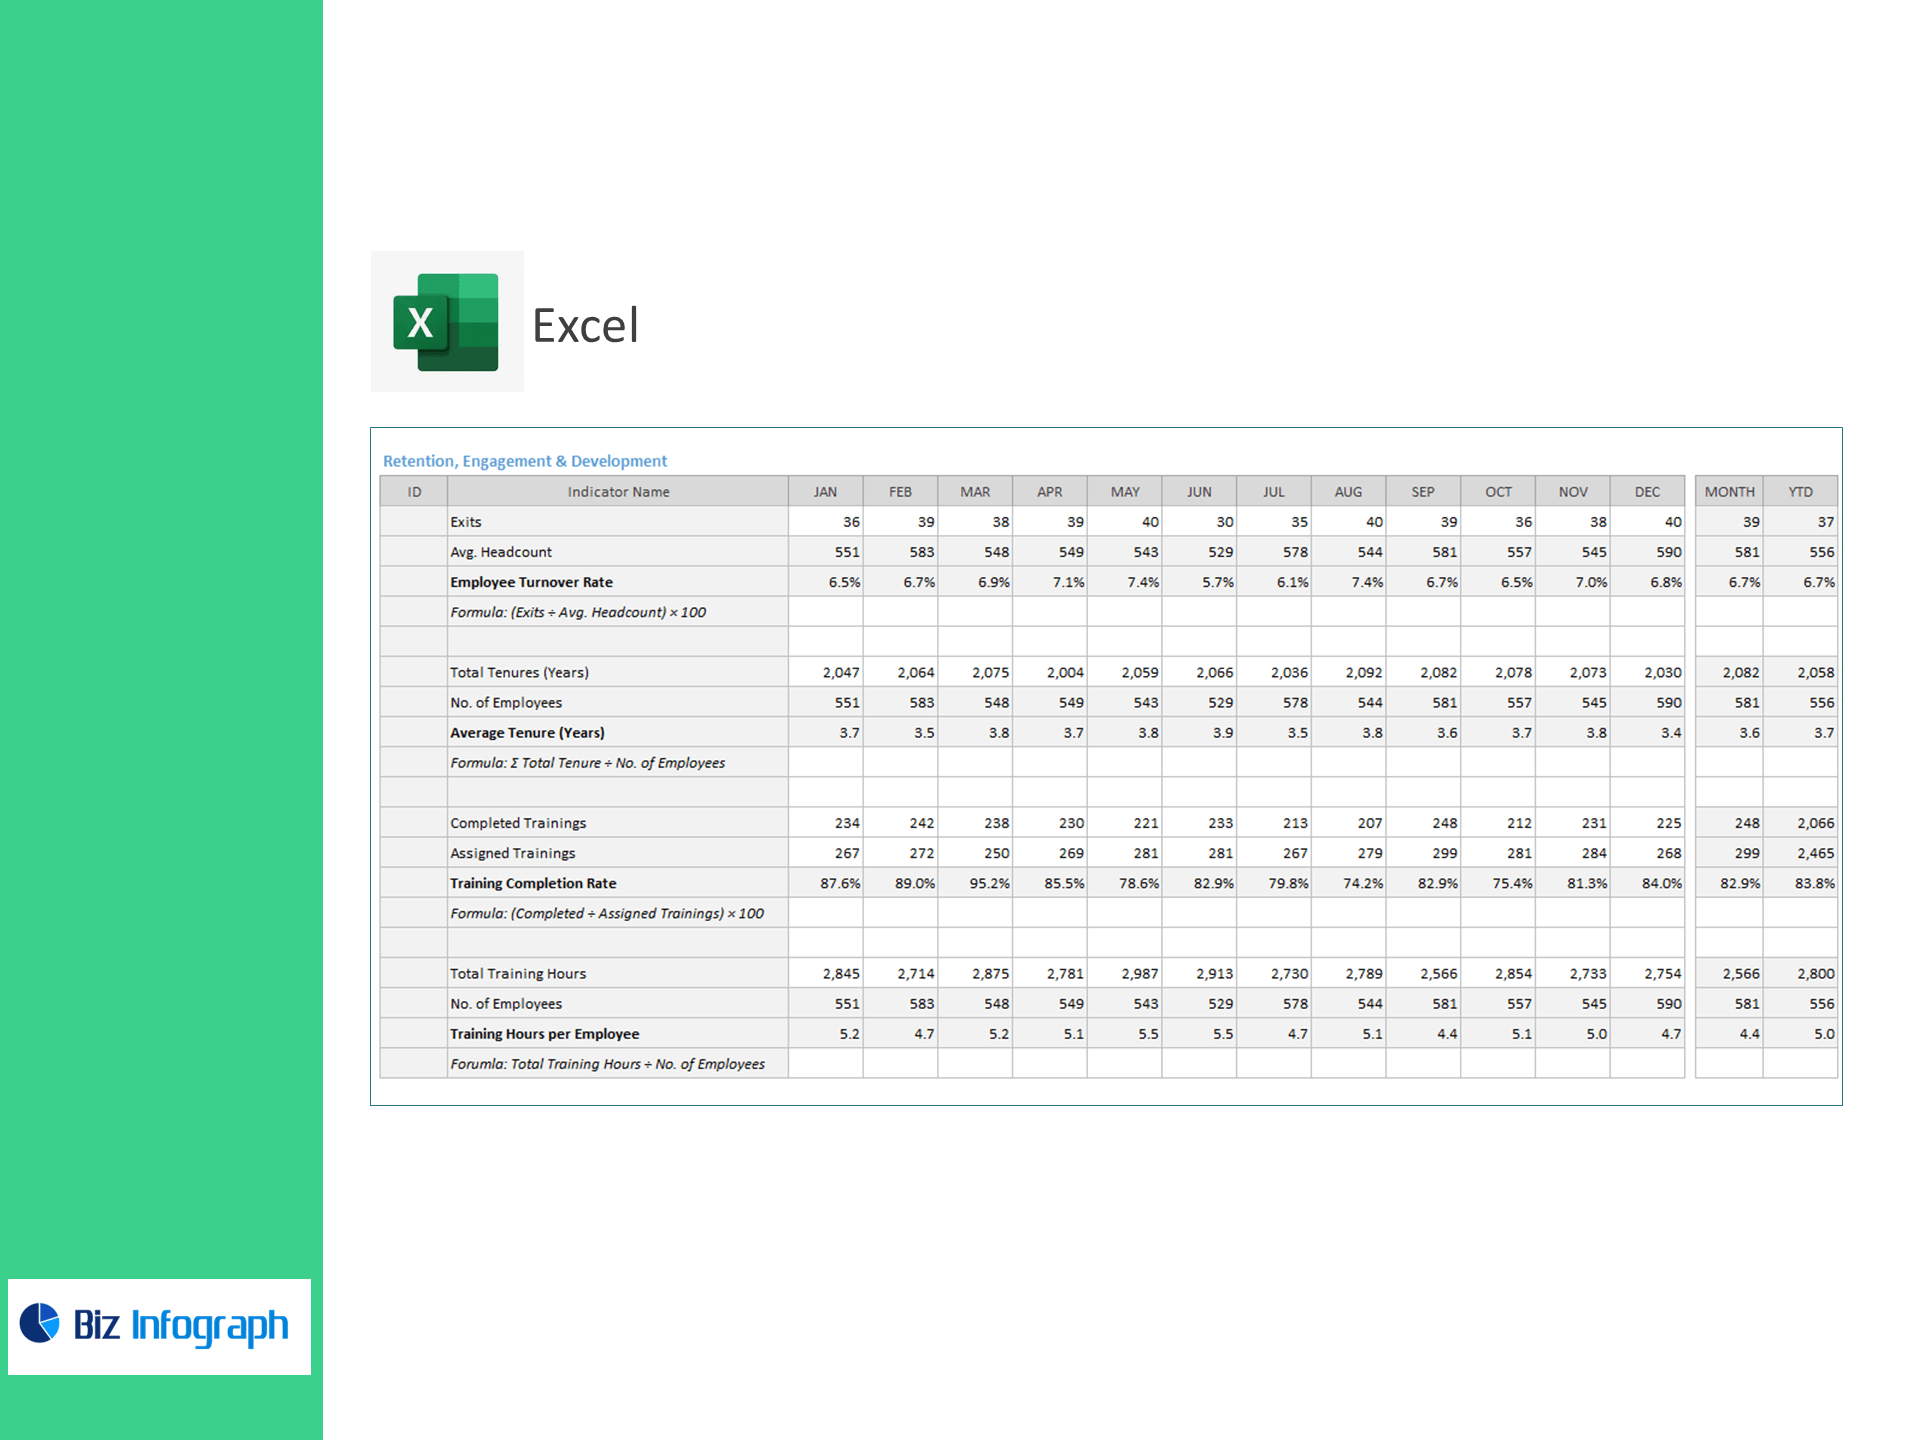
Retention, Engagement & Development
-
Employee Turnover Rate (%) = (Exits ÷ Avg. Headcount) × 100
-
Average Tenure (Years) = Σ Tenure ÷ Employees
-
Training Completion Rate (%) = (Completed ÷ Assigned Trainings) × 100
-
Training Hours per Employee = Total Training Hours ÷ Employees
What’s inside
-
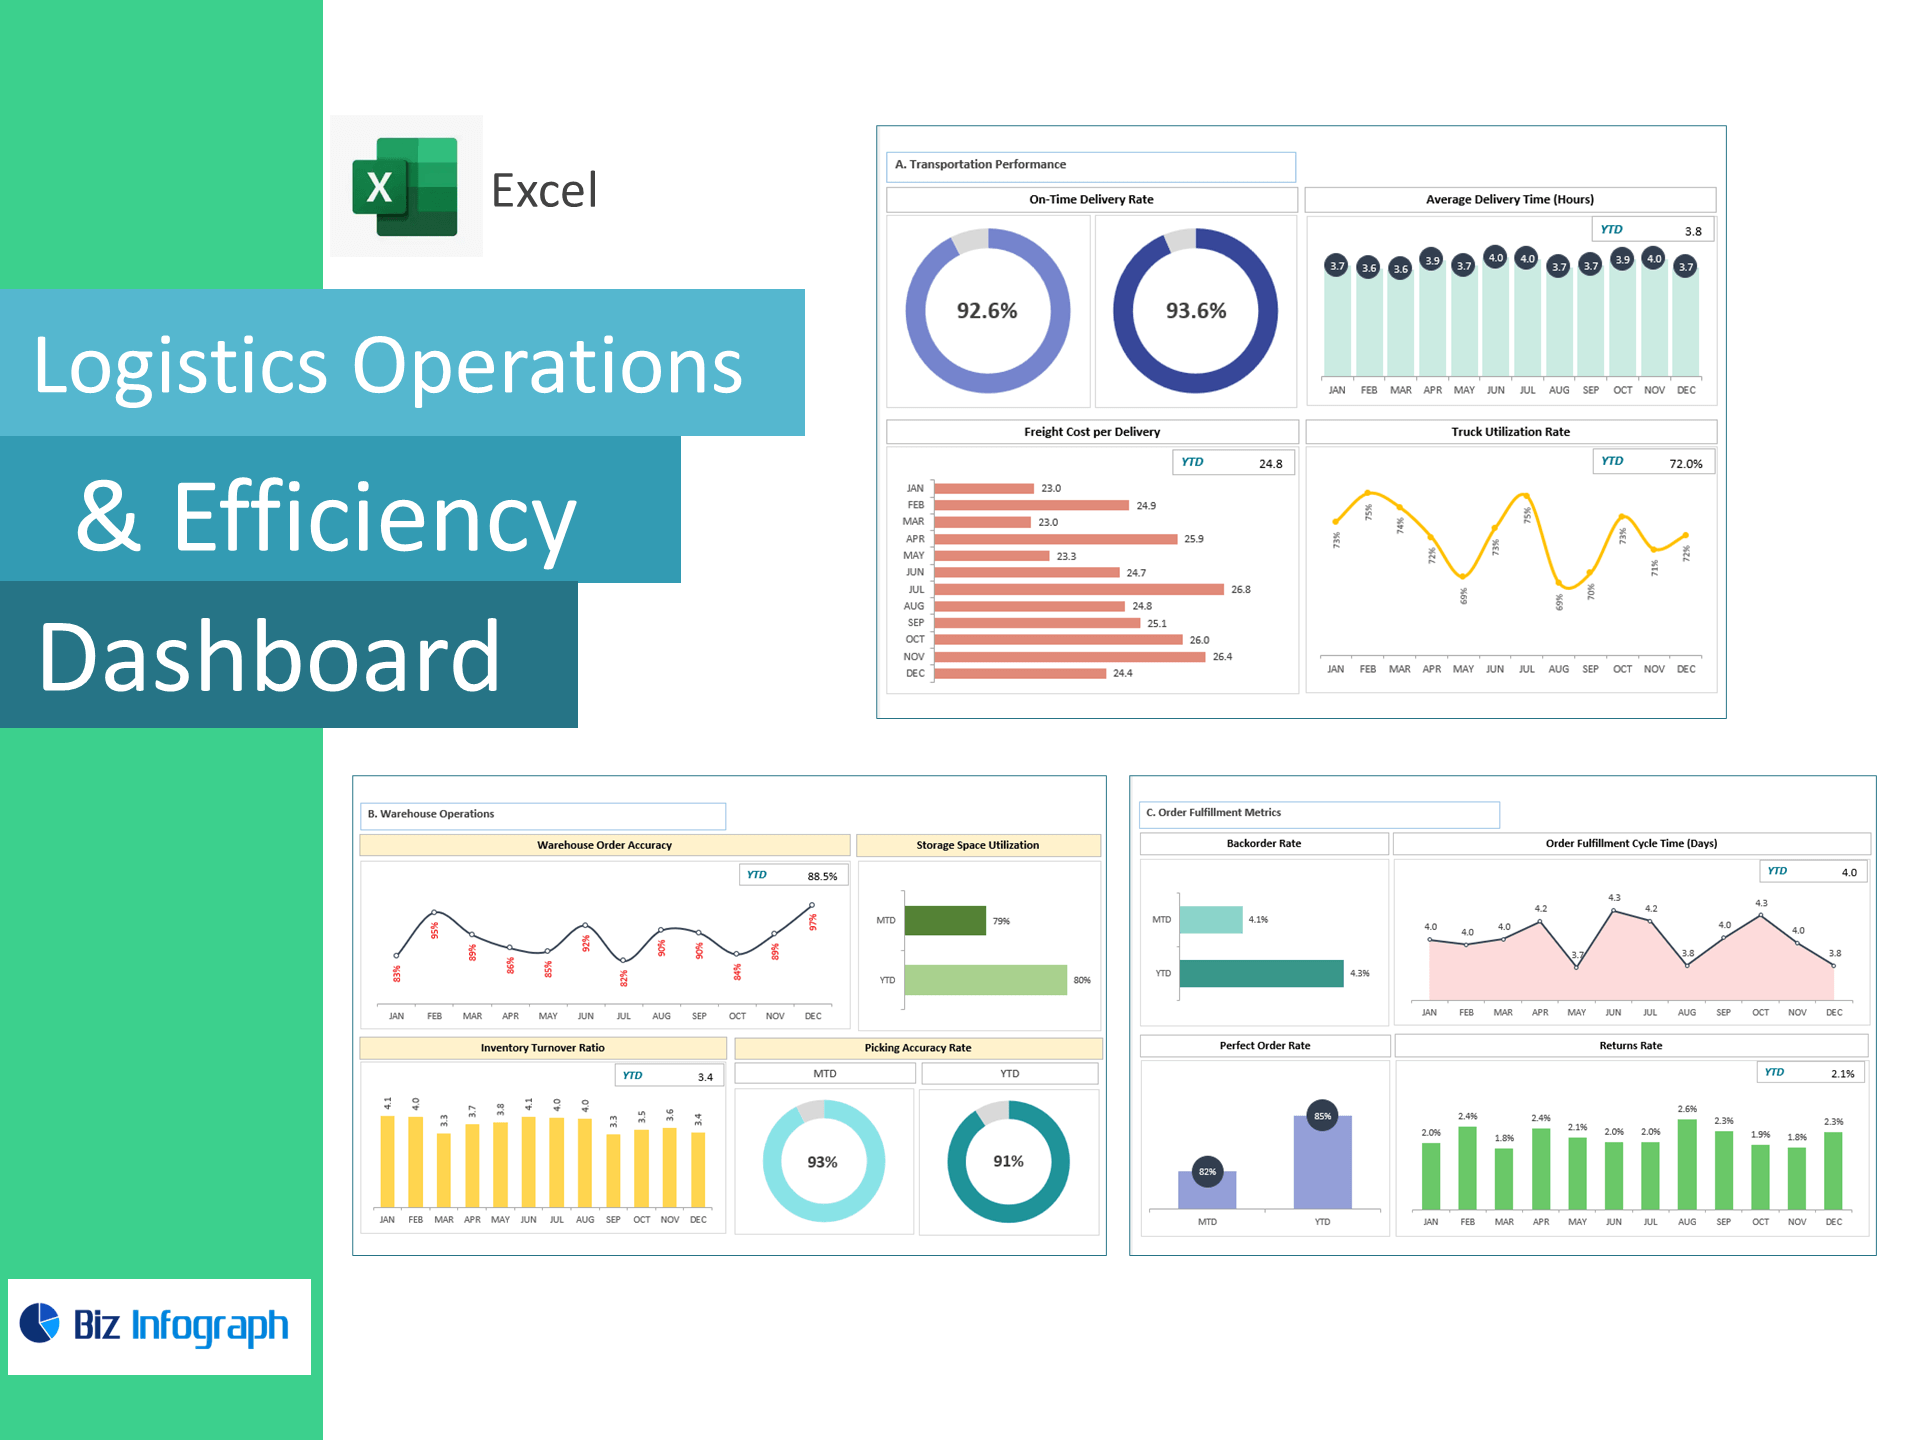
Executive Dashboard: At-a-glance tiles for Order Accuracy, Dock-to-Stock, Incidents, Driver Utilization, Revenue/Employee, OT/FTE, Employee Cost %, Turnover, Tenure, and Training— with trend and variance to target.
-
Warehouse & Transport Views: Filter by site, shift, fleet, or lane to pinpoint bottlenecks.
-
Labor & Scheduling Monitor: Hours, overtime hotspots, and absenteeism trends.
-
Safety & Training Hub: Incidents, completion rates, and training hours by role/team.
How it works
-
Paste your CSV/Excel data into specific Enter Data tab.
-
Review visuals to optimize staffing, reduce OT, and improve service levels.
Benefits
-
Raise service quality: Improve order accuracy and shorten dock-to-stock.
-
Lower labor spend: Cut overtime and employee cost % of revenue without sacrificing throughput.
-
Safer operations: Track incidents and training to reduce risk.
-
Retain talent: Watch turnover, tenure, and absenteeism to act early.
For ready-to-use Dashboard Templates: