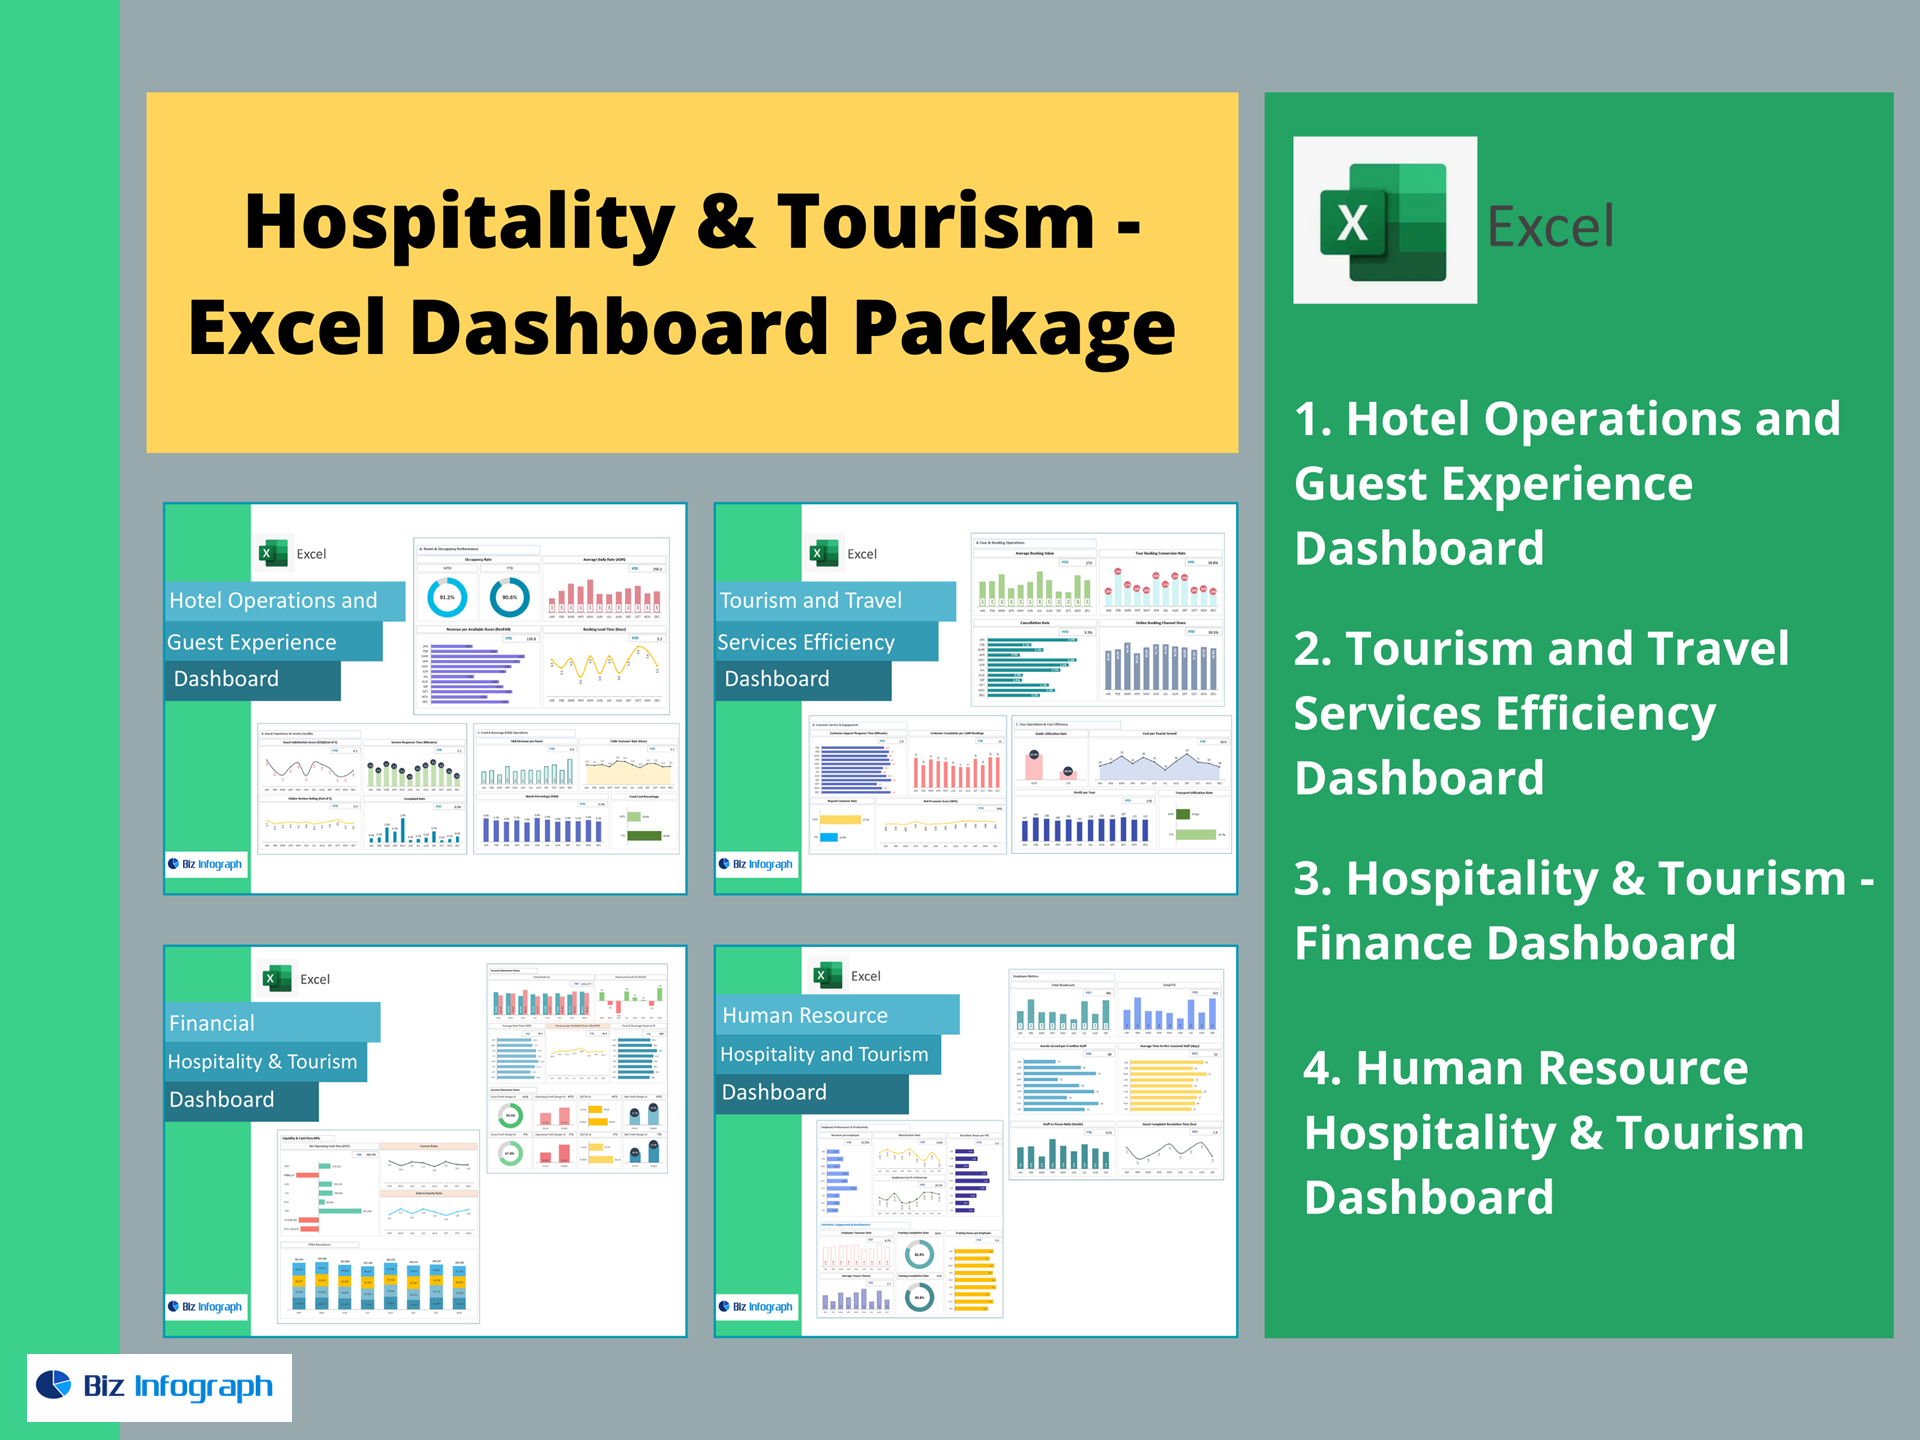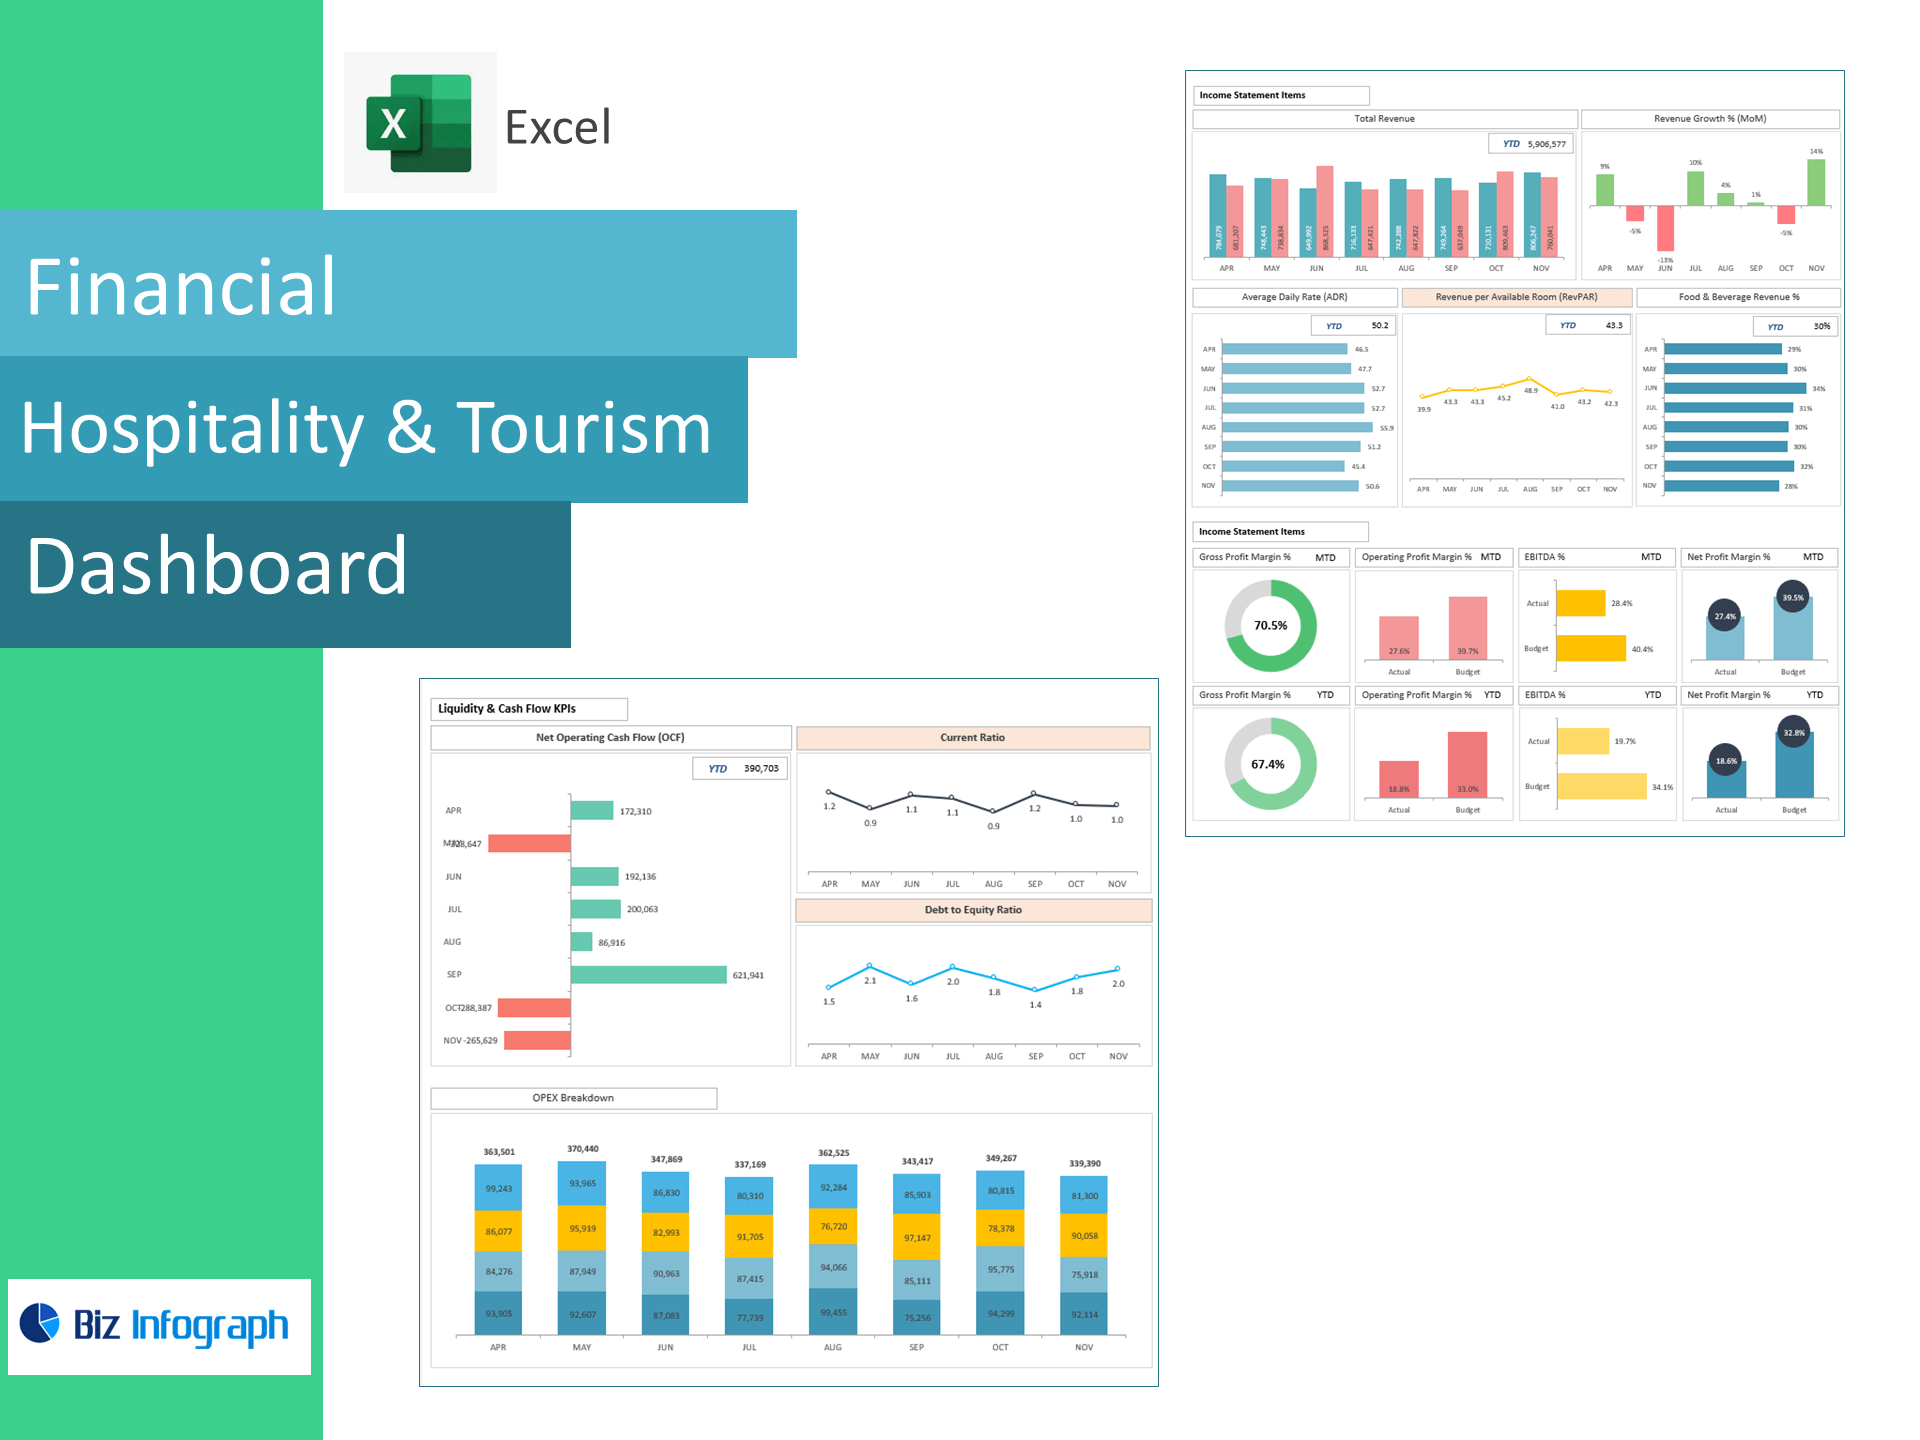
Hospitality & Tourism Financial Dashboard — Excel Template
Track margins, cash flow, and operating discipline for hotels, resorts, and travel businesses—right in Excel. This template converts PMS/accounting exports into a board-ready dashboard showing Revenue Growth, GP/EBIT/EBITDA/Net Profit, Net Operating Cash Flow (OCF), Current Ratio, and Debt-to-Equity—so you can balance occupancy-driven growth with liquidity and leverage.
Why operators choose this template
-
Finance in one view: Income statement, profitability, and cash/liquidity KPIs side-by-side.
-
Actionable controls: See how OPEX (labor, admin, selling, marketing) impacts EBITDA %.
-
Cash clarity: Monitor OCF and working-capital pressure across seasonality.
-
Excel-native: Paste your data and go—no add-ins or BI setup required.
KPIs included (ready-made formulas)
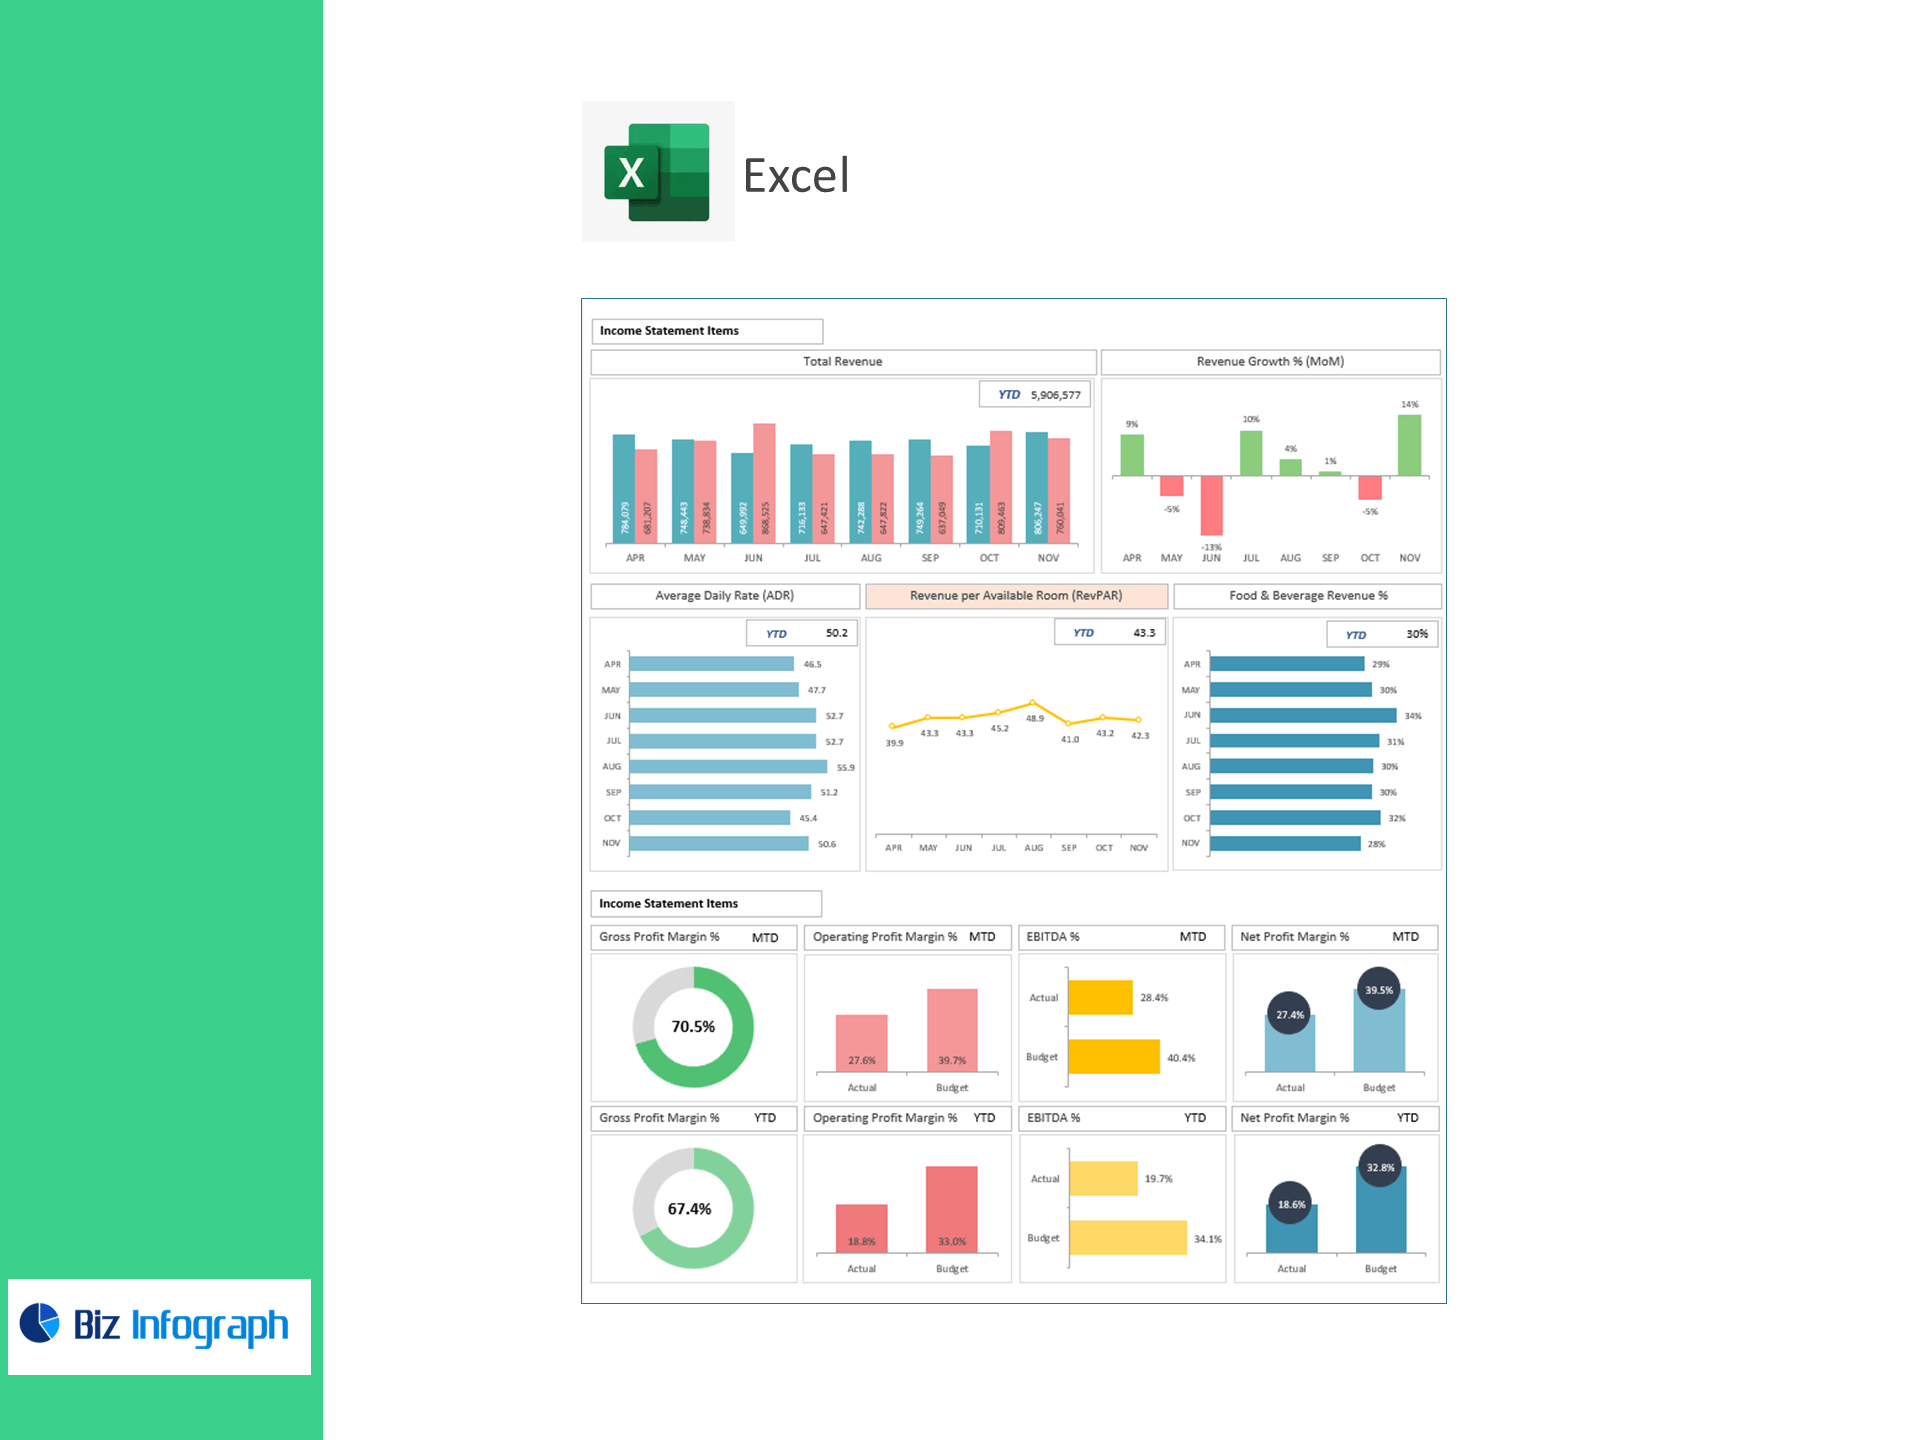
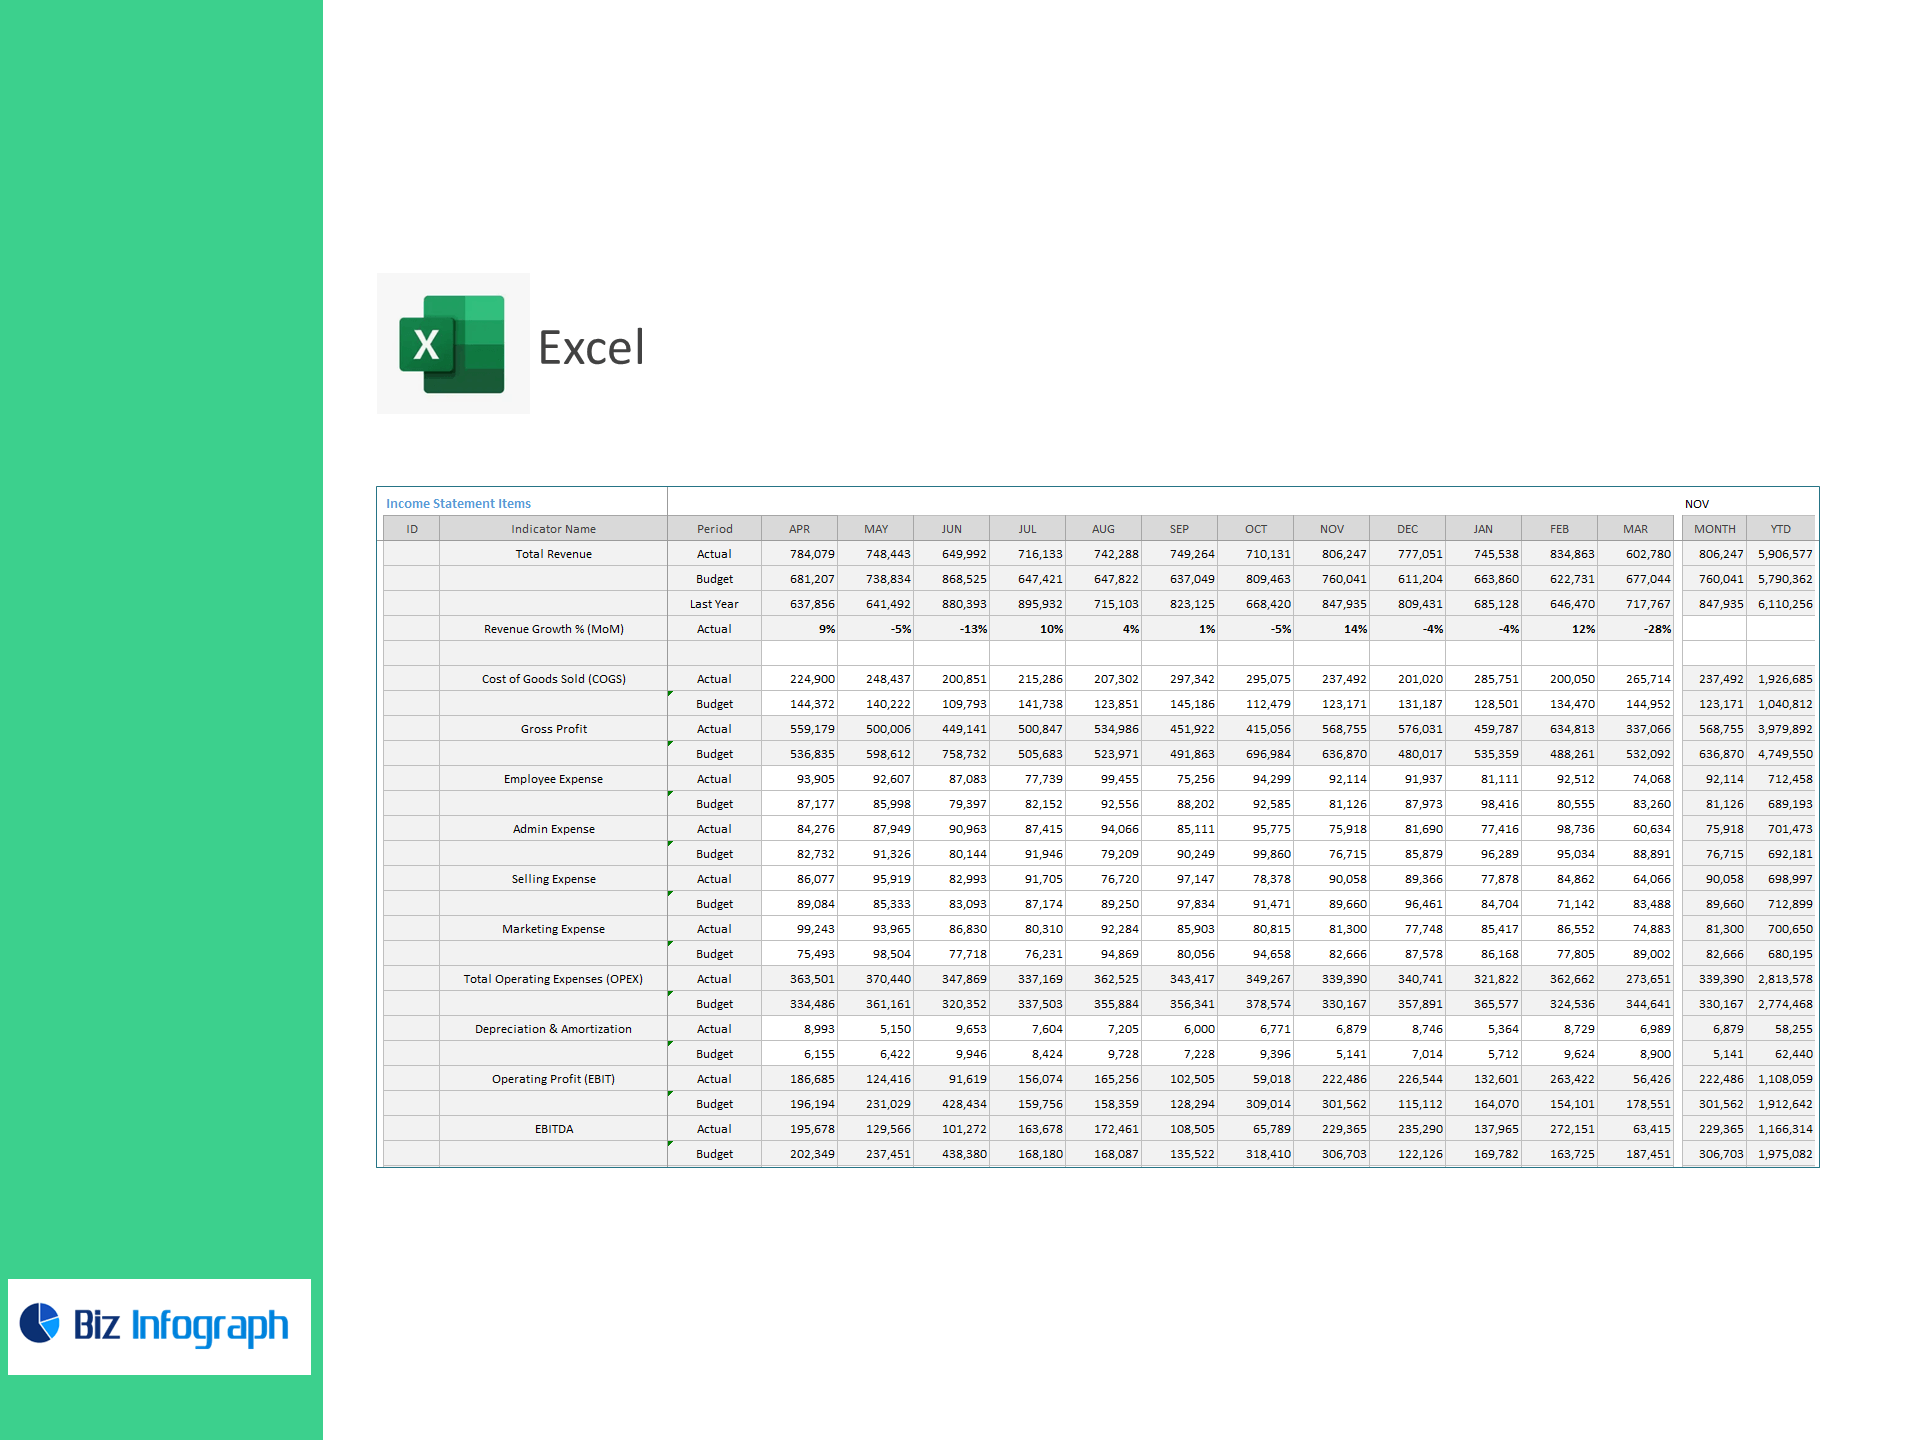
Income Statement & Profitability
-
Total Revenue; Revenue Growth % (MoM)
-
COGS, Gross Profit, Employee/Admin/Selling/Marketing → Total OPEX (+ OPEX breakdown)
-
Depreciation & Amortization, Operating Profit (EBIT), EBITDA, Interest Expense, Other Inc/(Exp), Taxes, Net Profit
-
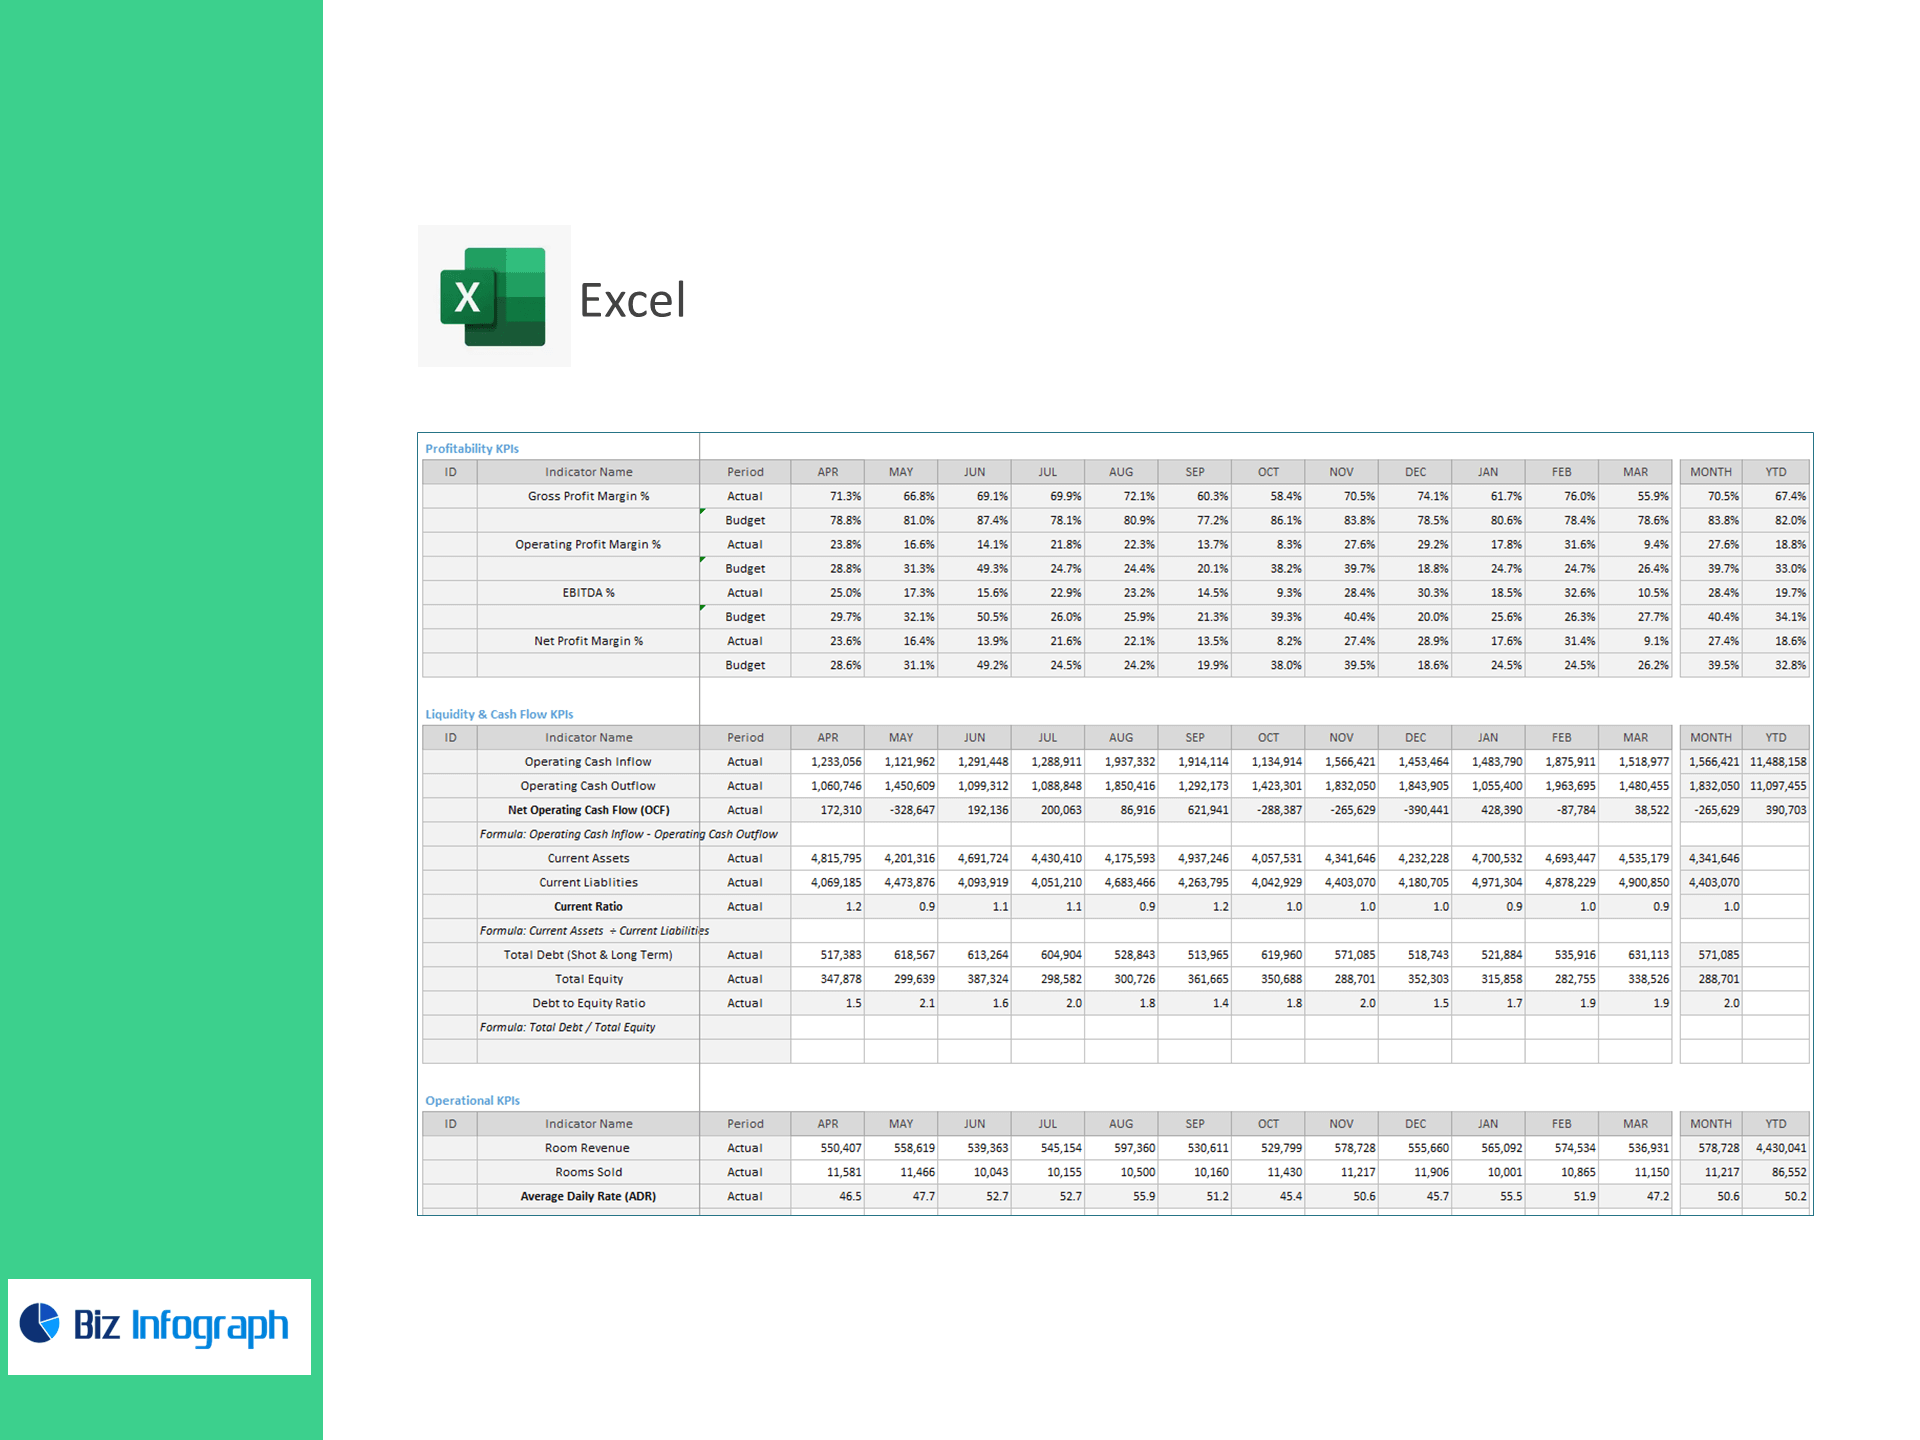
Gross Profit Margin %, Operating Profit Margin %, EBITDA %, Net Profit Margin %
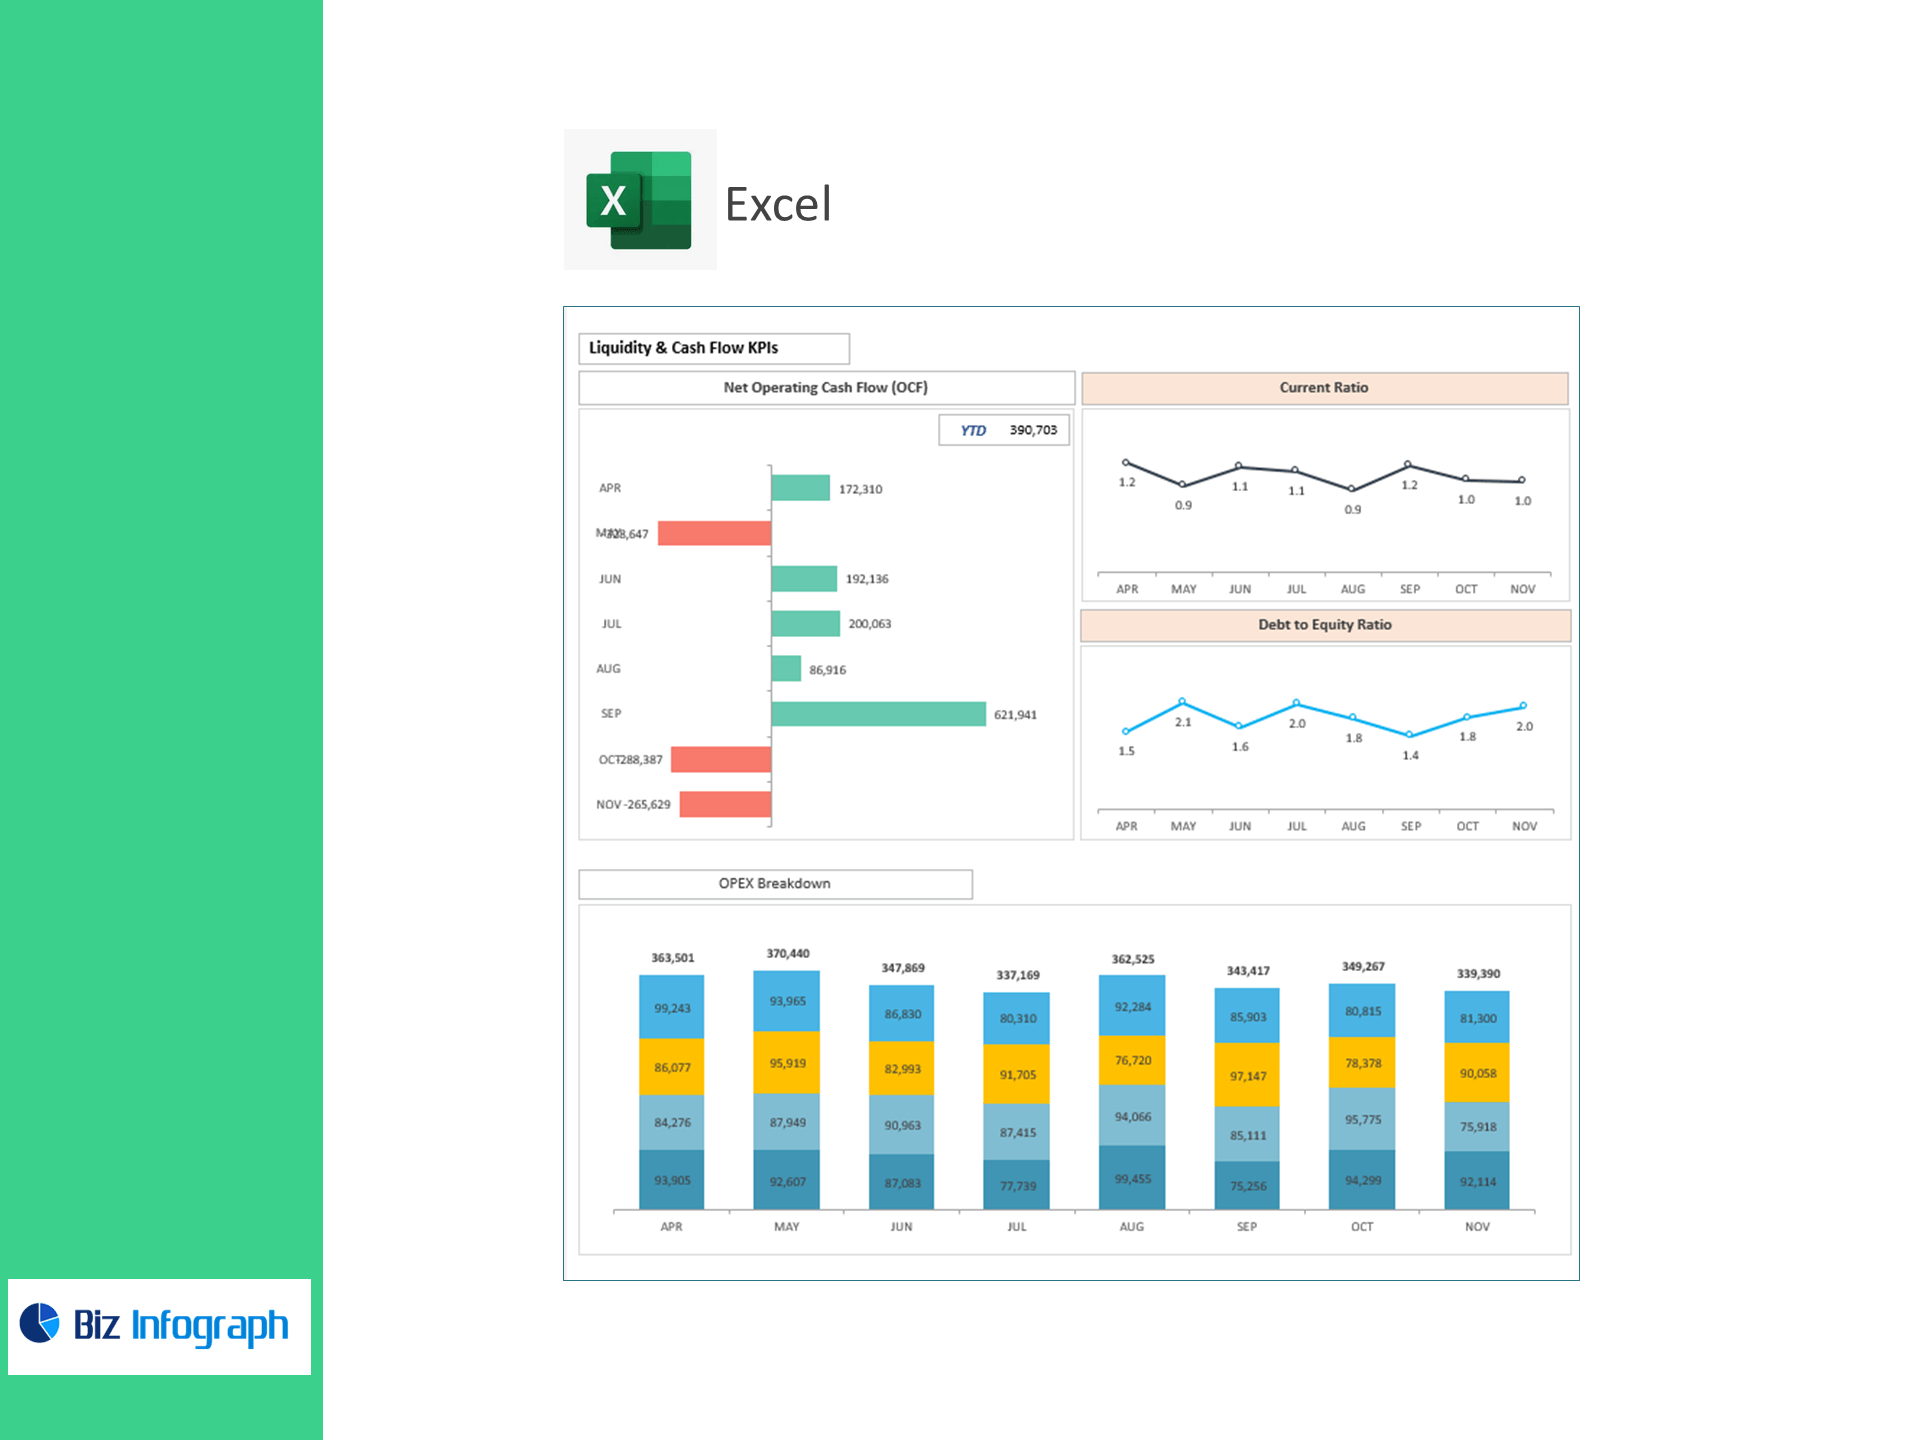
Liquidity & Cash Flow
-
Operating Cash Inflow, Operating Cash Outflow → Net Operating Cash Flow (OCF) = Inflow − Outflow
-
Current Ratio = Current Assets ÷ Current Liabilities
-
Debt-to-Equity = Total Debt ÷ Total Equity
What’s inside
-
Executive Dashboard: Tiles and trends for Revenue Growth, GP/EBIT/EBITDA/Net Profit, OCF, Current Ratio, and D/E with variance to target.
-
OPEX Analyzer: Drill into labor, selling & marketing, and overhead drivers.
-
Cash & Leverage Panel: Liquidity runway and leverage health across months.
-
Targets & Assumptions: Enter KPI targets; automatic Above/Below Target highlighting.
-
Clean Data Sheets: Import-ready tables for P&L, Cash Flow, and Balance Sheet.
Benefits
-
Improve margins: Spot OPEX creep and optimize spend during peak/off-peak periods.
-
Protect cash: Track OCF and Current Ratio to manage seasonality and bookings.
-
Manage leverage: Keep Debt-to-Equity within banking covenants.
-
Decide faster: Investor-ready visuals with transparent formulas.
For ready-to-use Dashboard Templates: