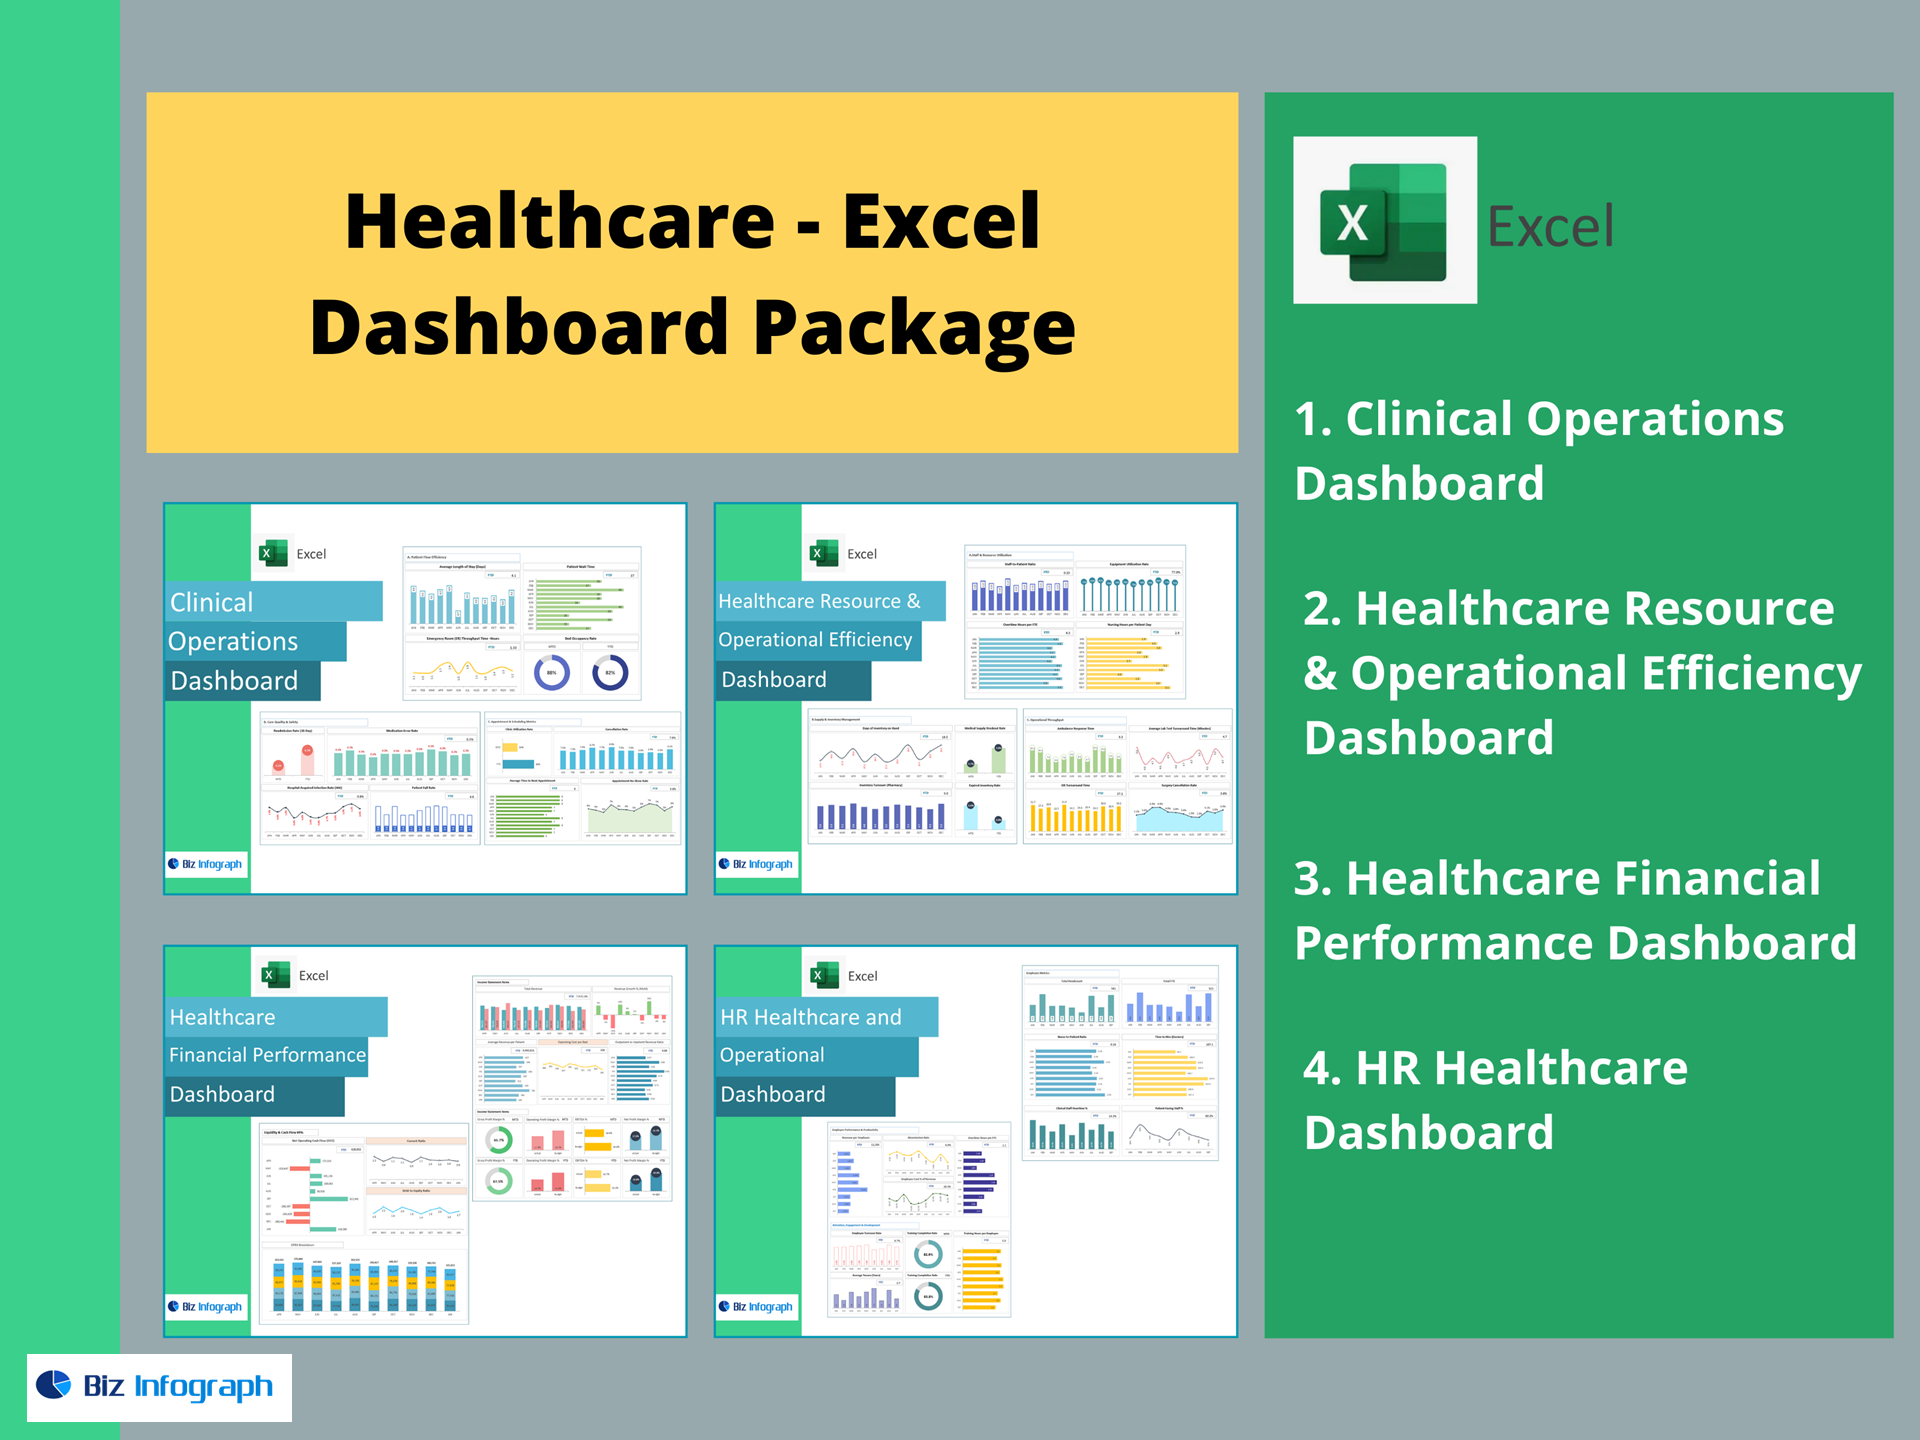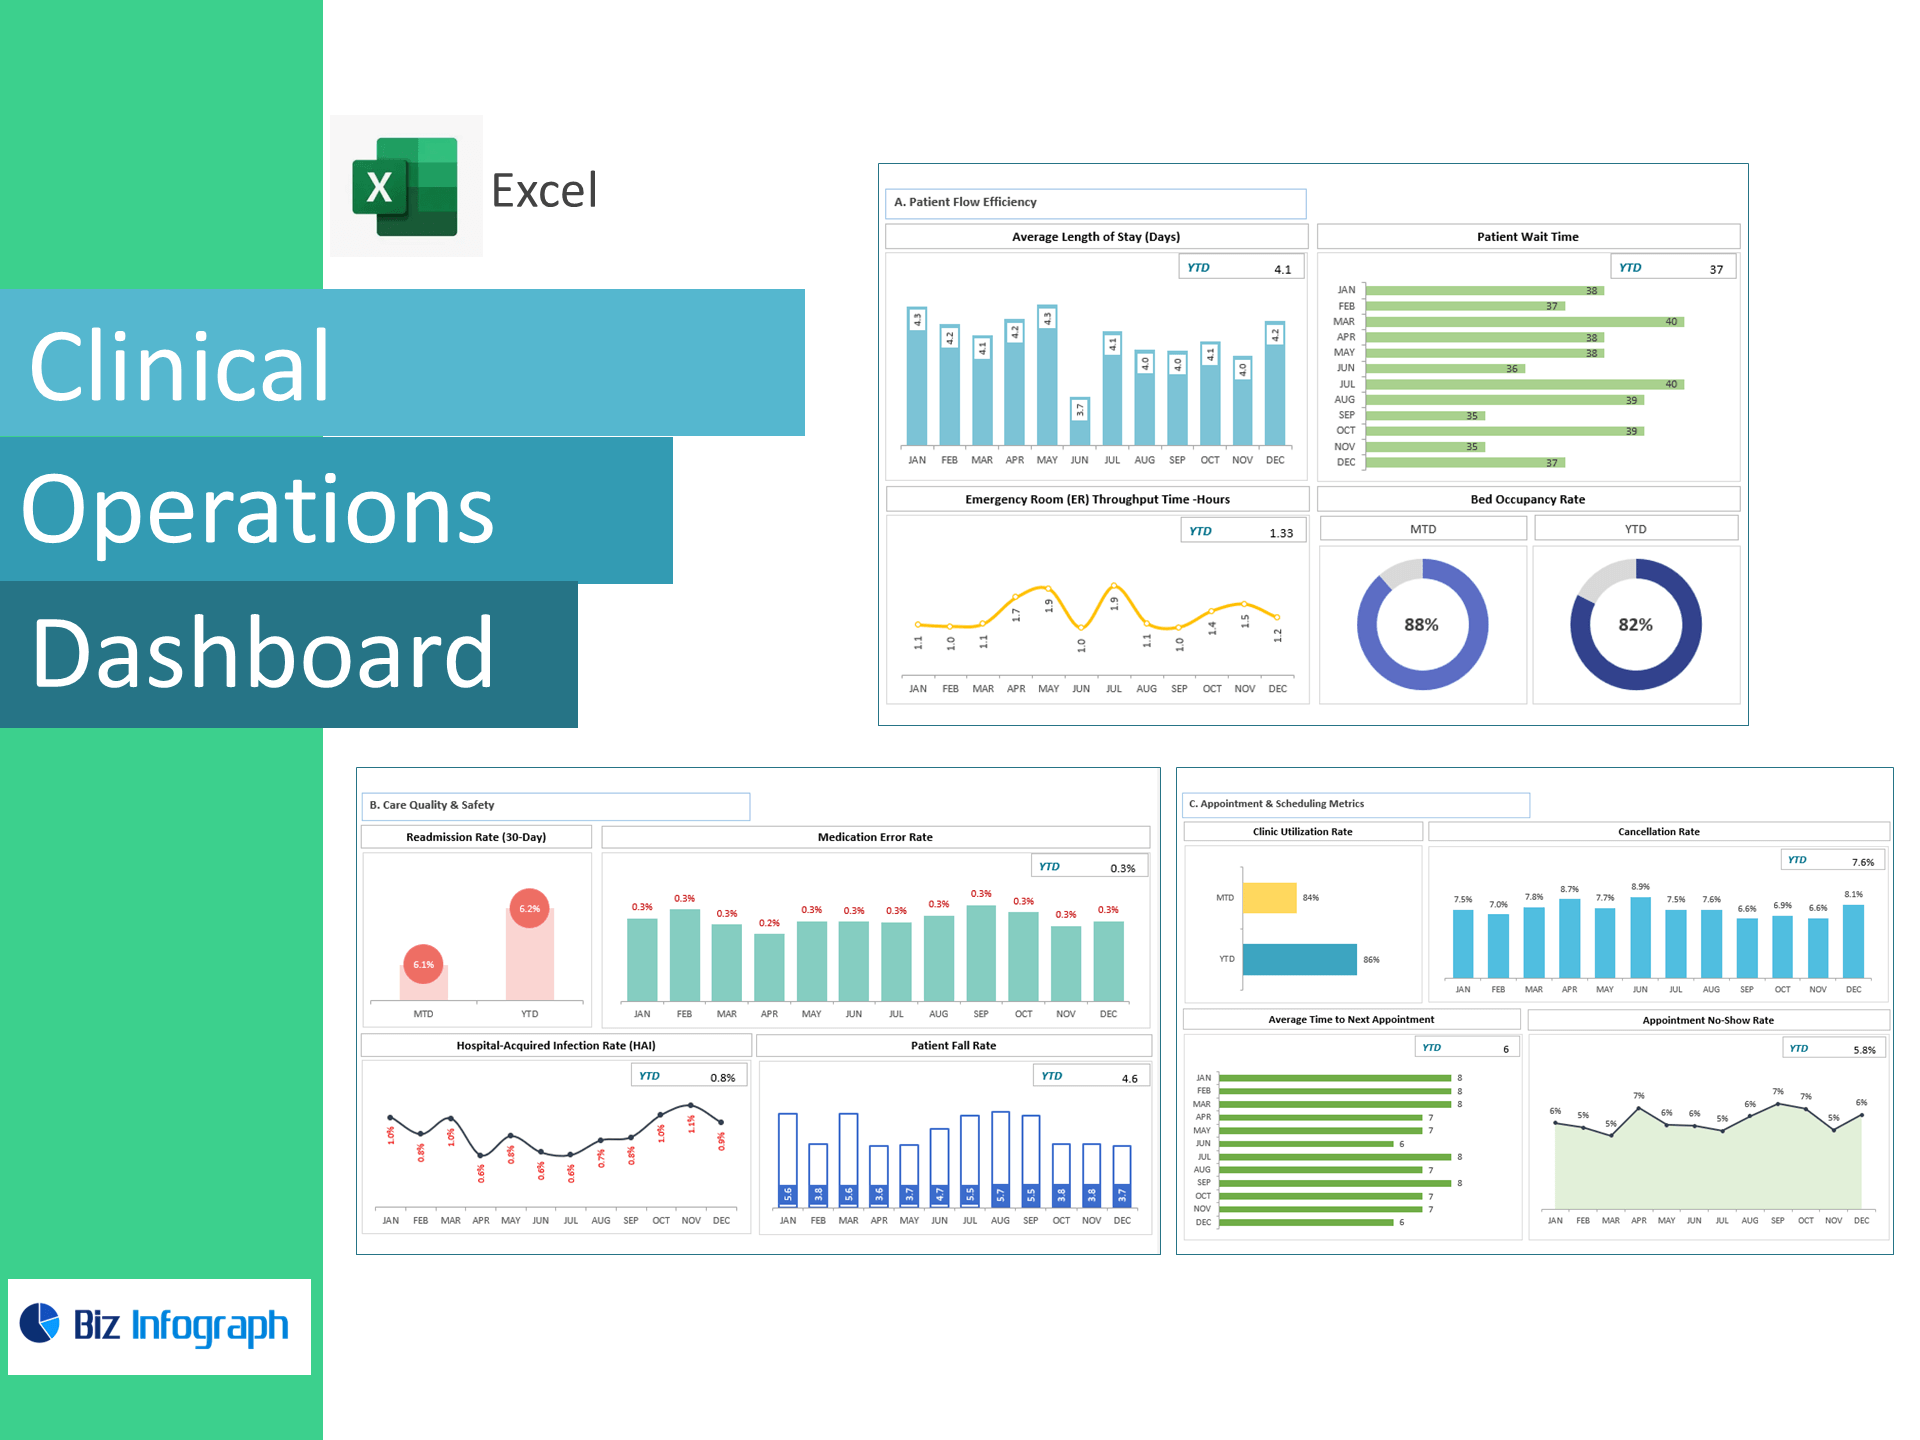
Clinical Operations Dashboard — Excel Template
Improve patient flow, reduce wait times, and elevate care quality—right in Excel. This template converts EMR/clinic data into a live dashboard tracking Average Length of Stay (ALOS), Bed Occupancy, ER Throughput, Readmission Rate, HAI Rate, Medication Error Rate, Patient Fall Rate, No-Show Rate, Clinic Utilization, Cancellations, and Time to Next Appointment—so clinical and admin leaders can act fast and improve outcomes.
Why providers choose this template
-
Patient flow at a glance: Monitor ALOS, bed occupancy, ER throughput, and wait times by unit/clinic.
-
Quality & safety control: Track 30-day readmissions, HAI, med errors, and falls with trend and variance to target.
-
Scheduling efficiency: Reduce no-shows, raise clinic utilization, and shorten time to next appointment.
-
Excel-native: Paste data and go—no add-ins or BI setup required.
KPIs included (ready-made formulas)
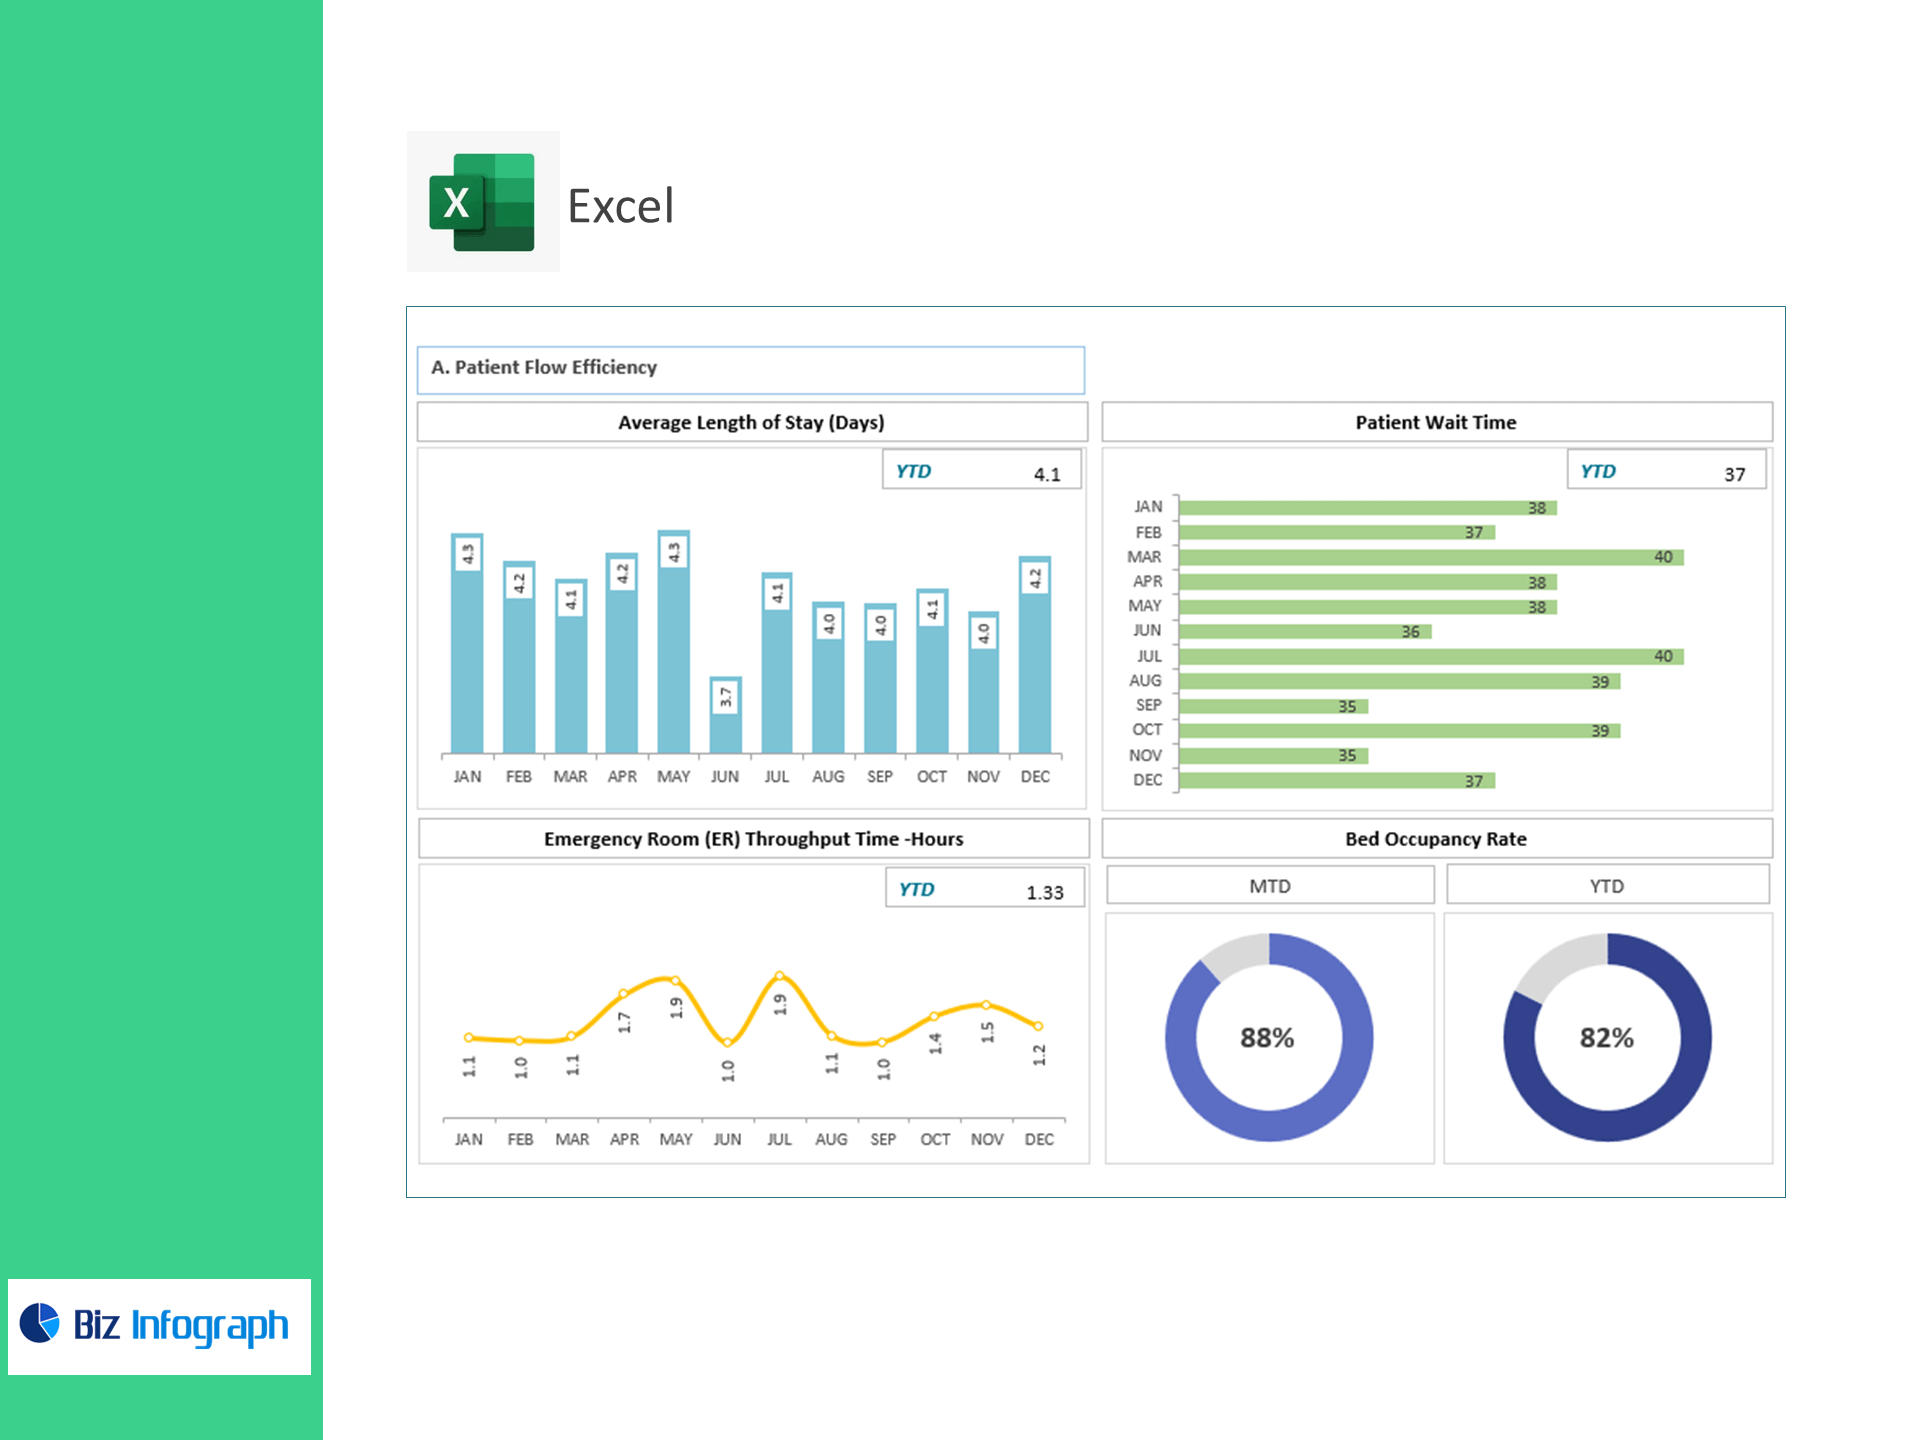
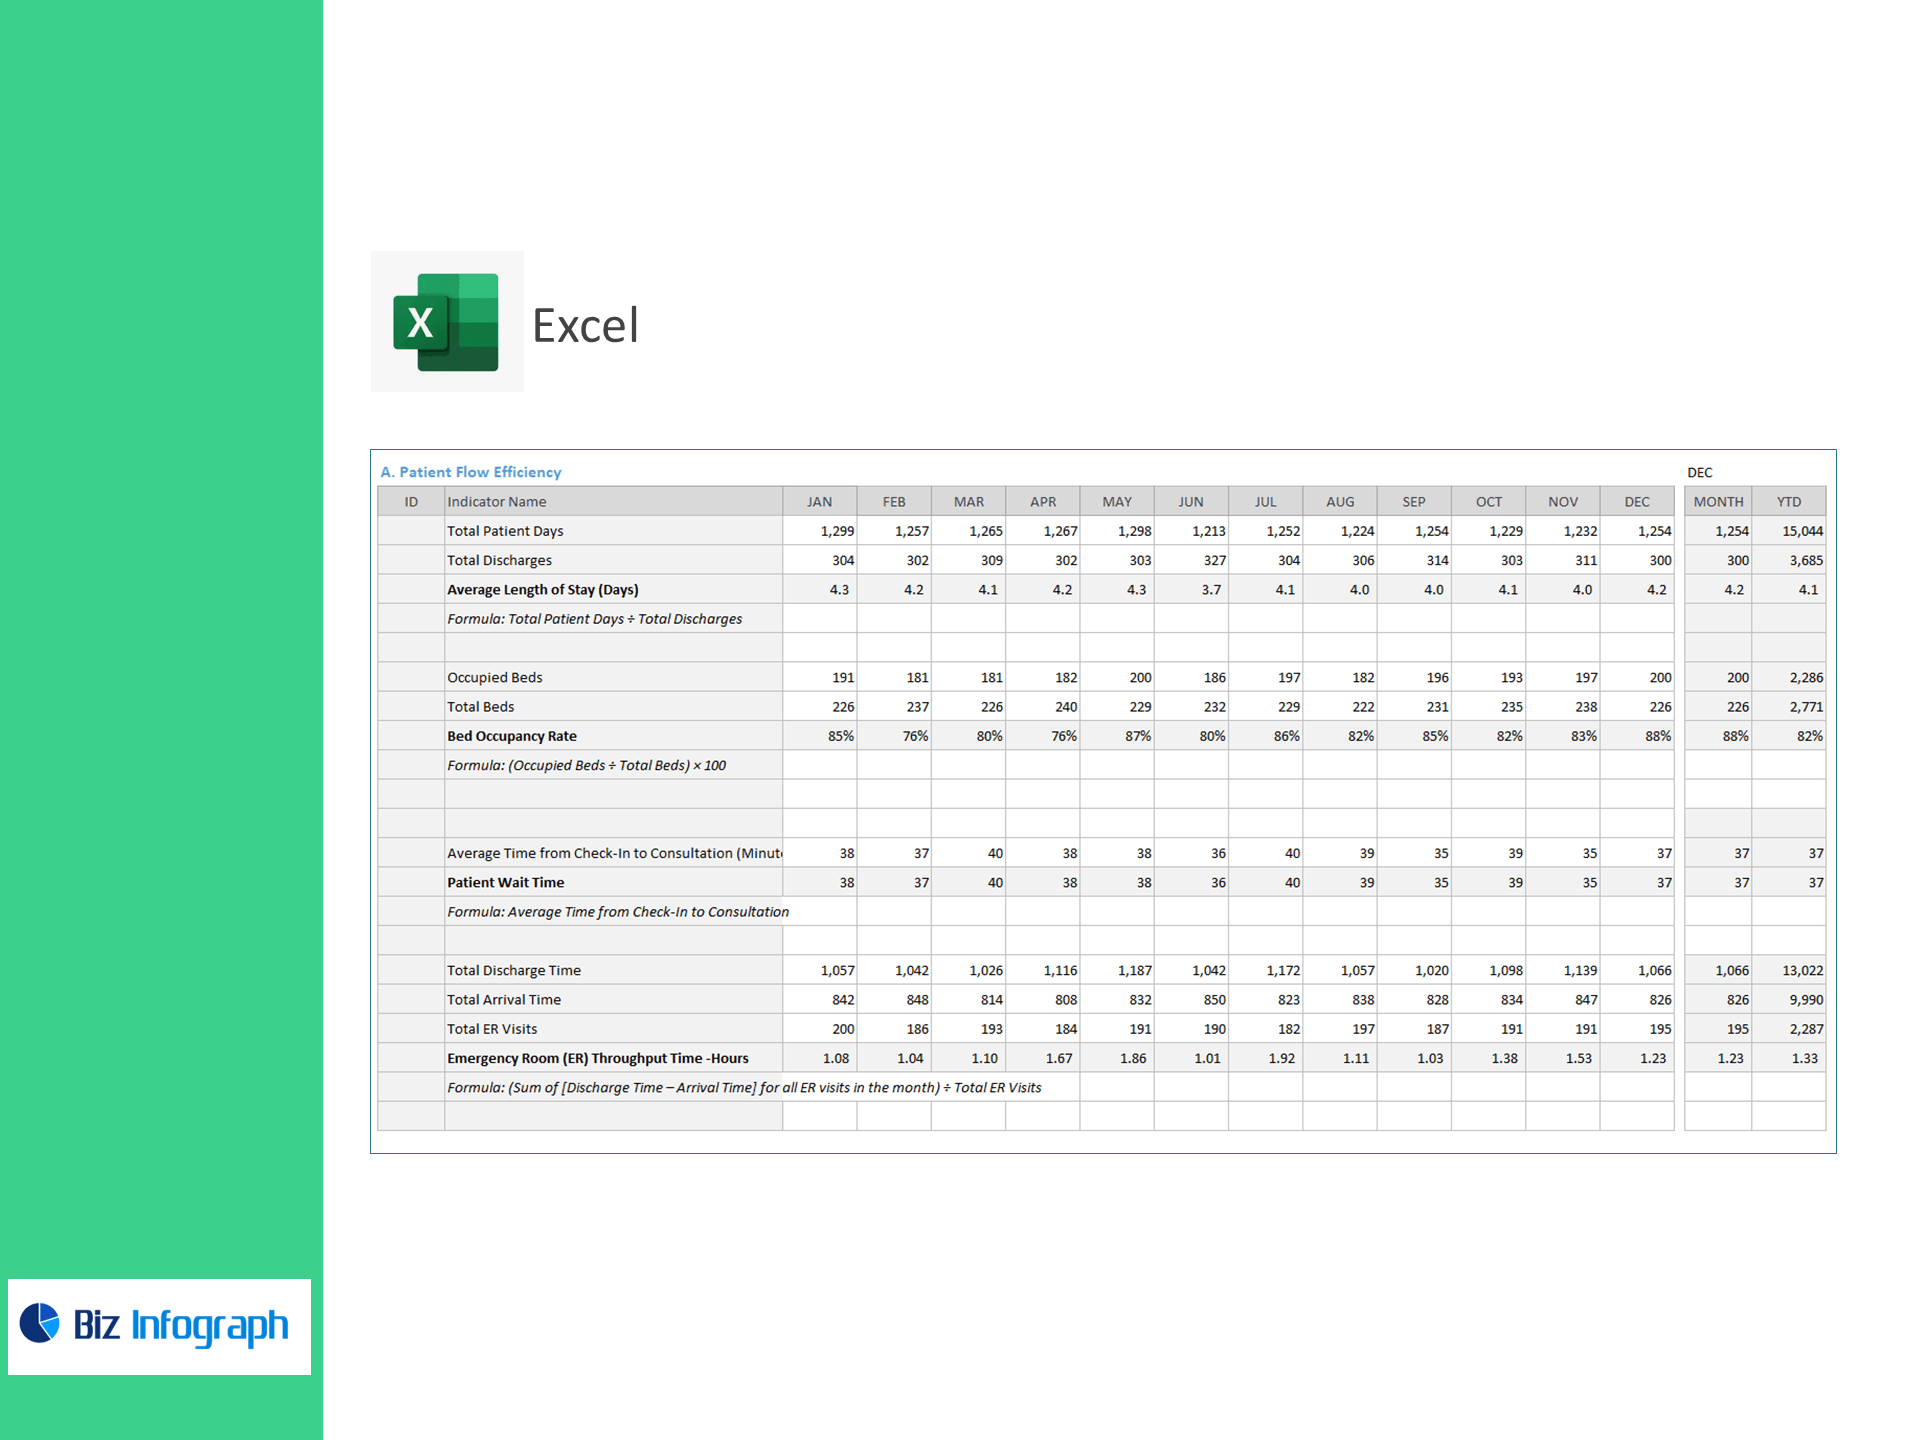
A) Patient Flow Efficiency
-
Average Length of Stay (Days) = Total Patient Days ÷ Total Discharges
-
Bed Occupancy Rate (%) = (Occupied Beds ÷ Total Beds) × 100
-
Patient Wait Time (minutes) = Avg. time from check-in to consultation
-
ER Throughput Time (hours) = (Σ[Discharge Time − Arrival Time] ÷ Total ER Visits)
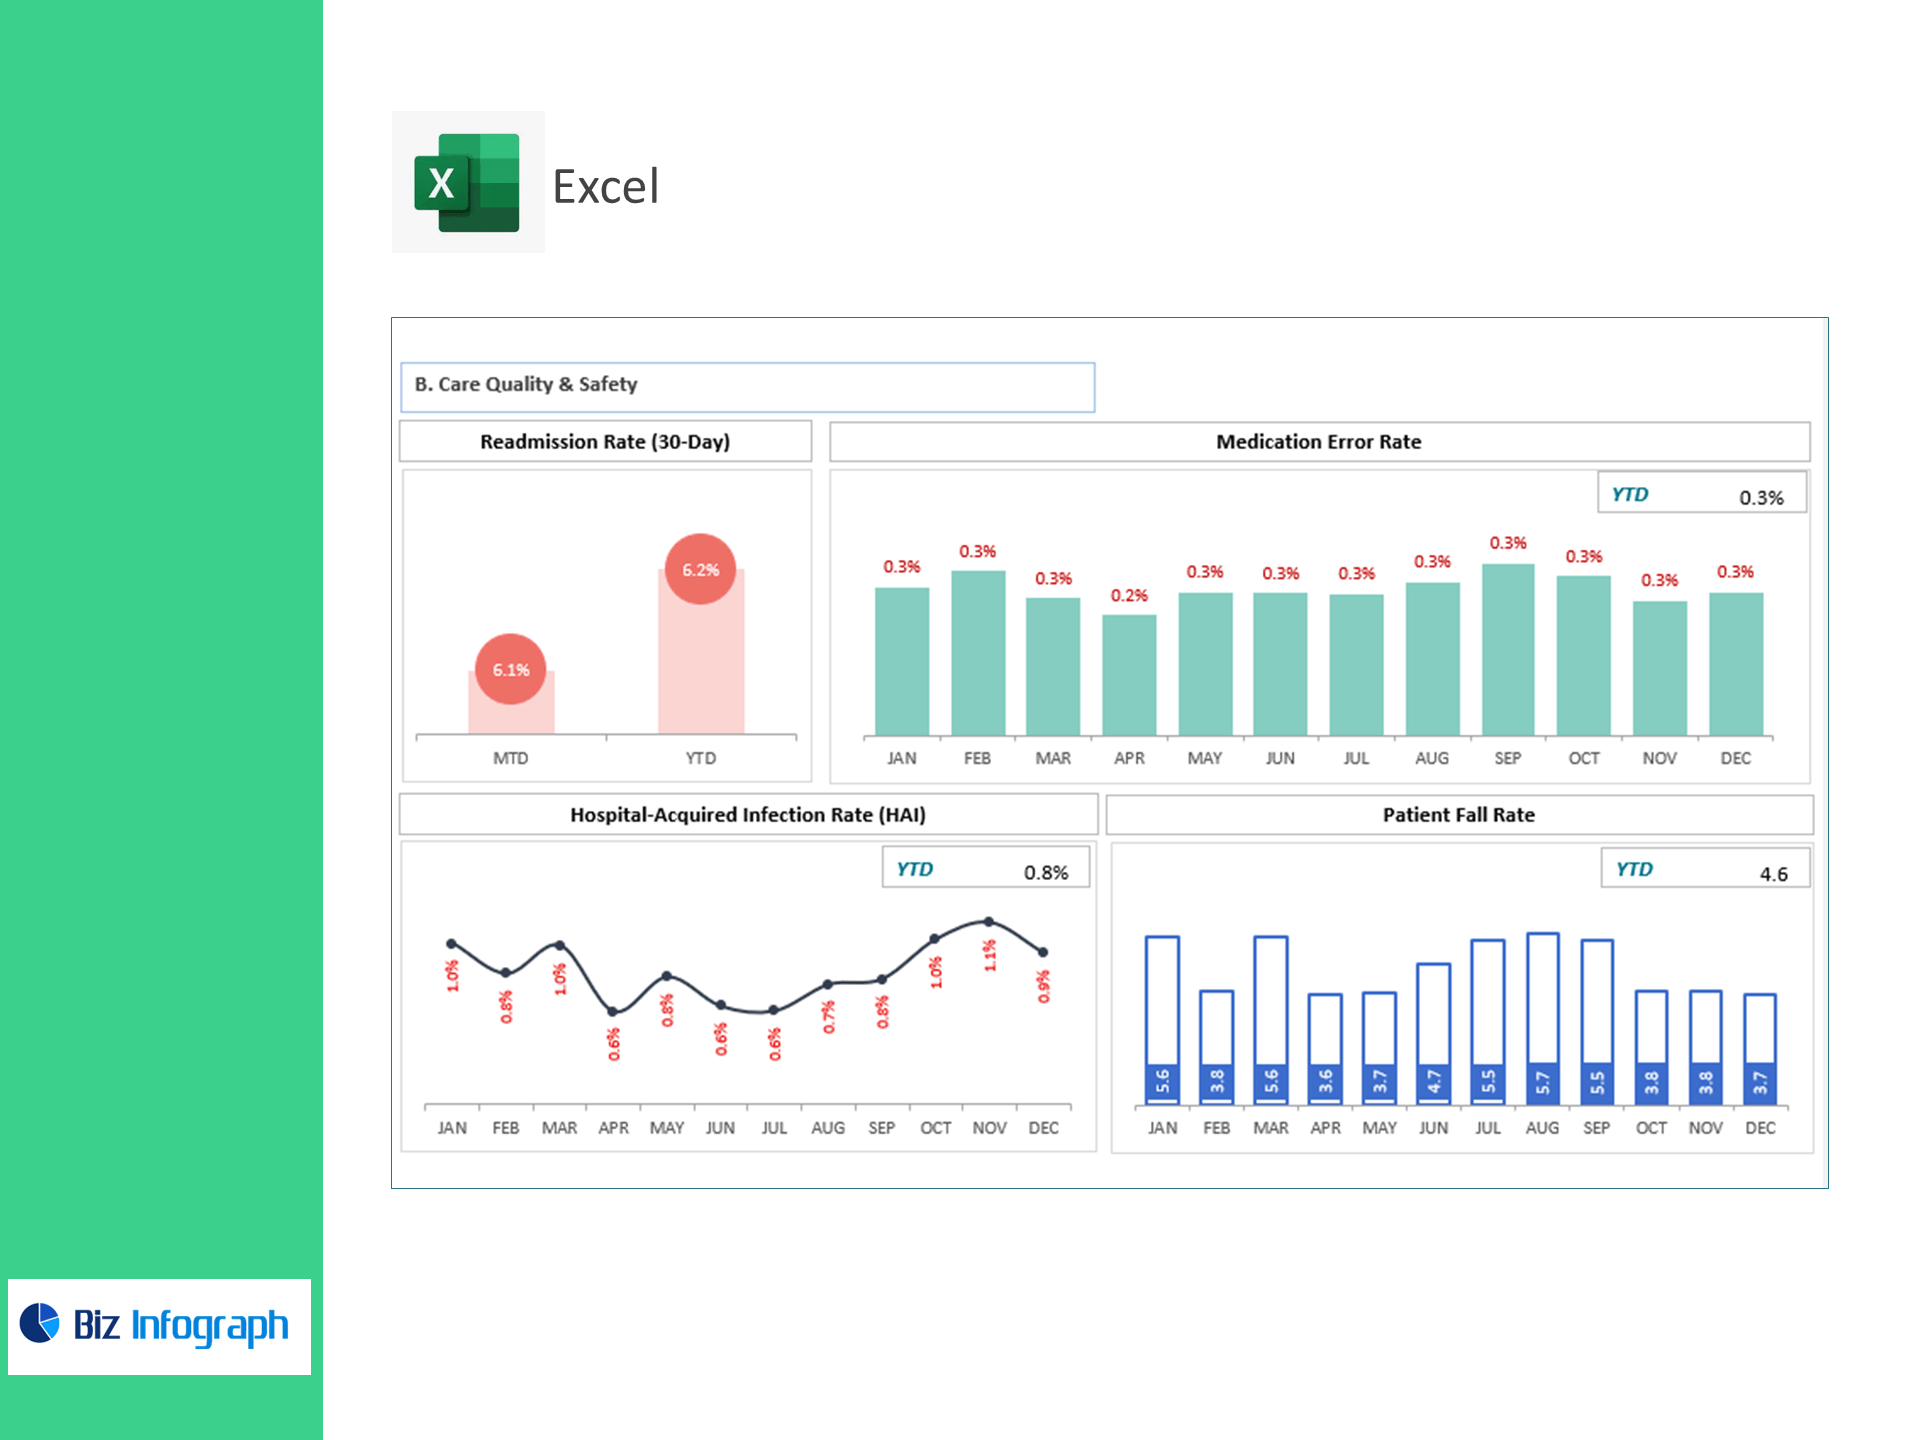
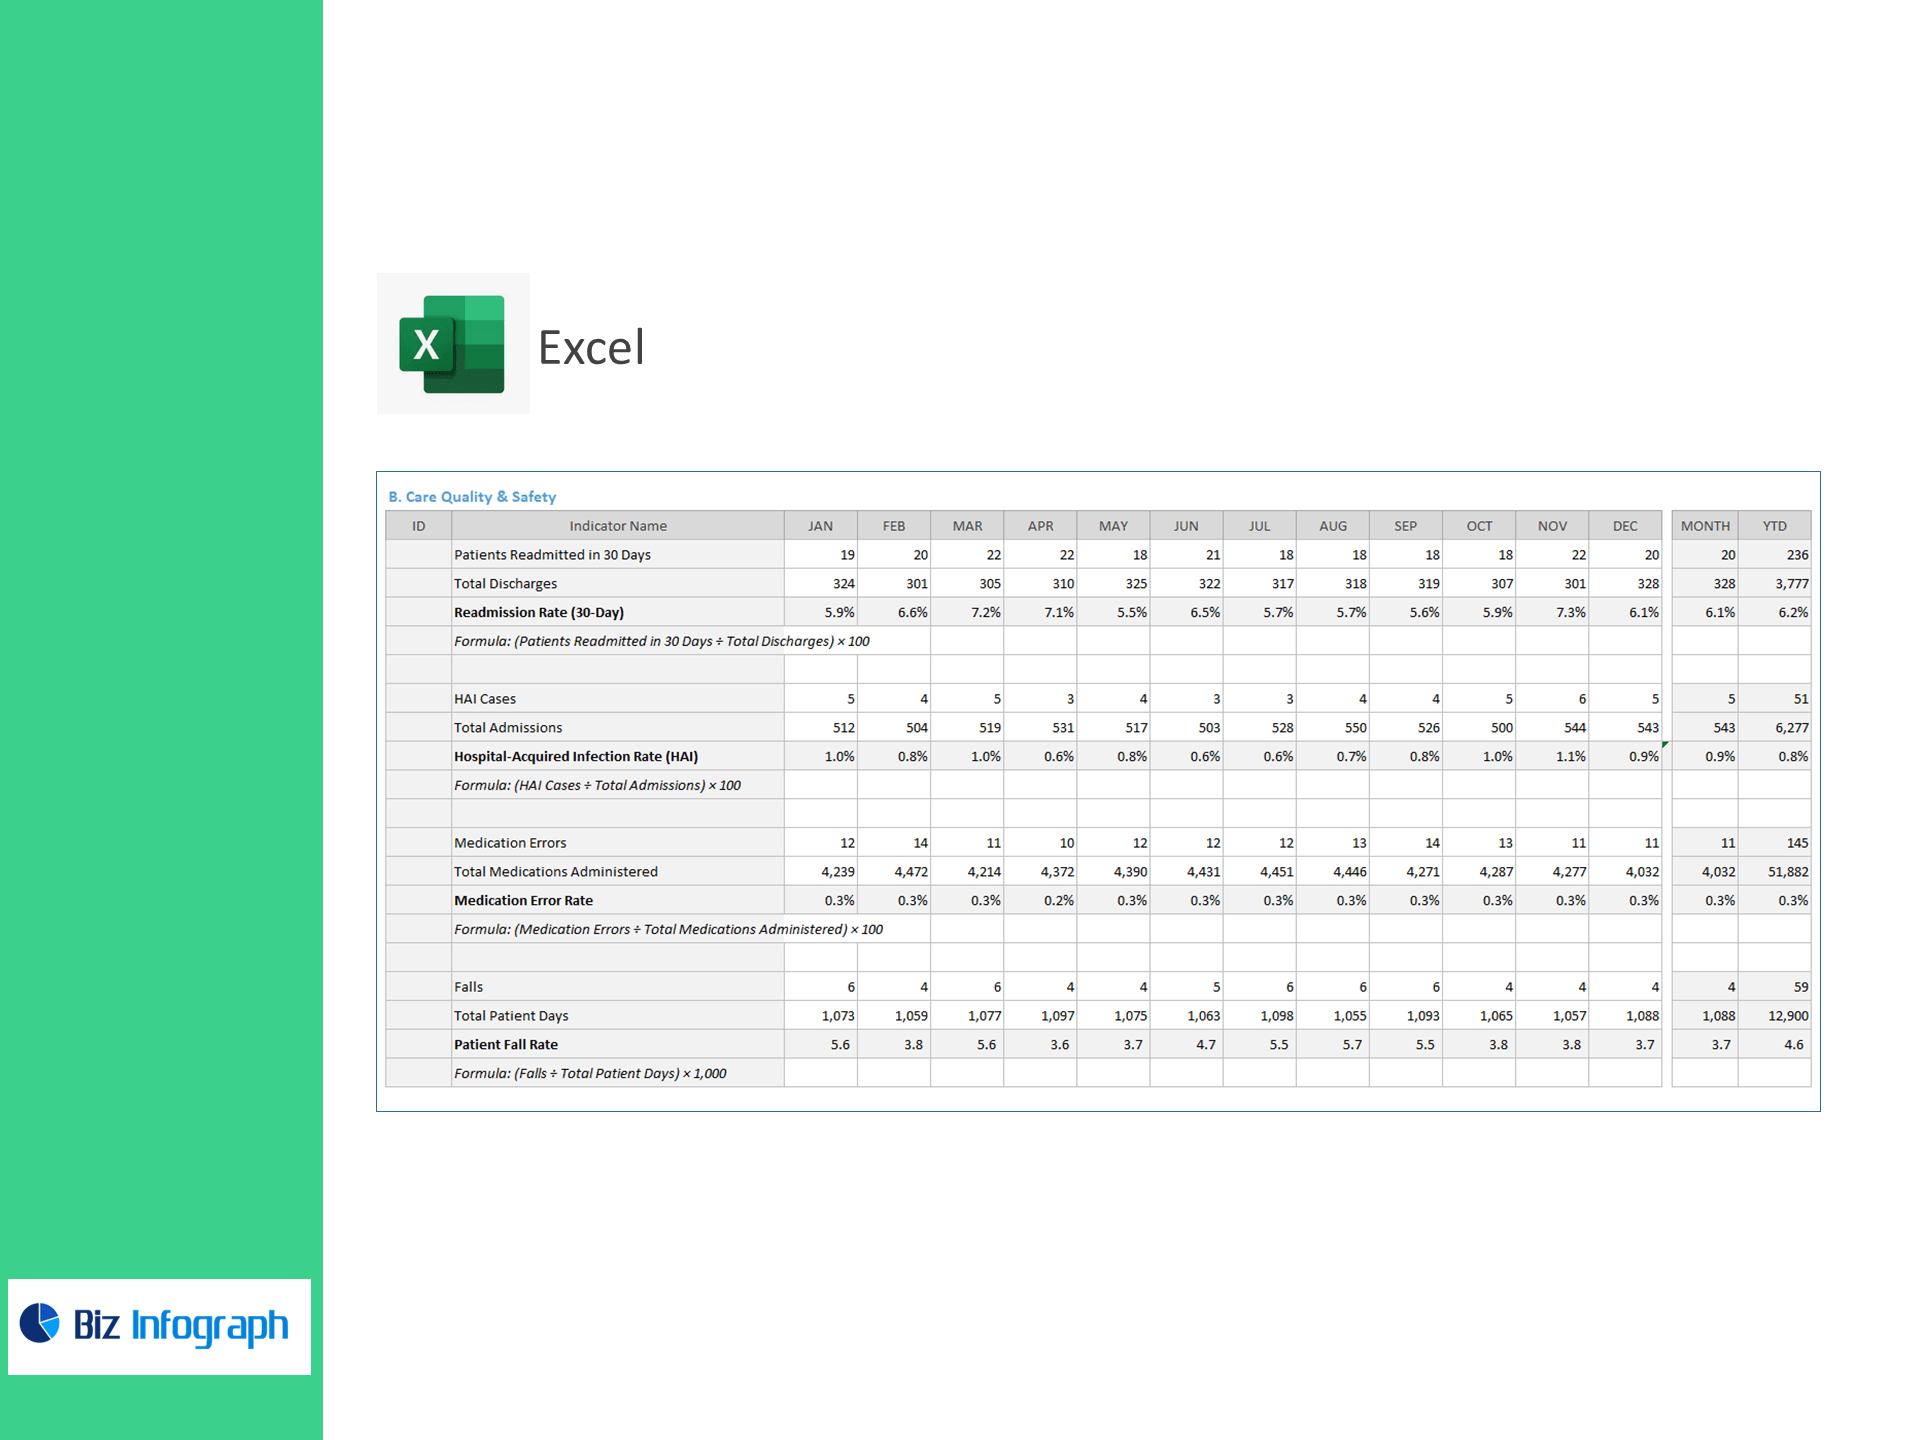
B) Care Quality & Safety
-
Readmission Rate (30-Day) (%) = (Patients Readmitted in 30 Days ÷ Total Discharges) × 100
-
Hospital-Acquired Infection Rate (%) = (HAI Cases ÷ Total Admissions) × 100
-
Medication Error Rate (%) = (Medication Errors ÷ Total Medications Administered) × 100
-
Patient Fall Rate (per 1,000 pt-days) = (Falls ÷ Total Patient Days) × 1,000
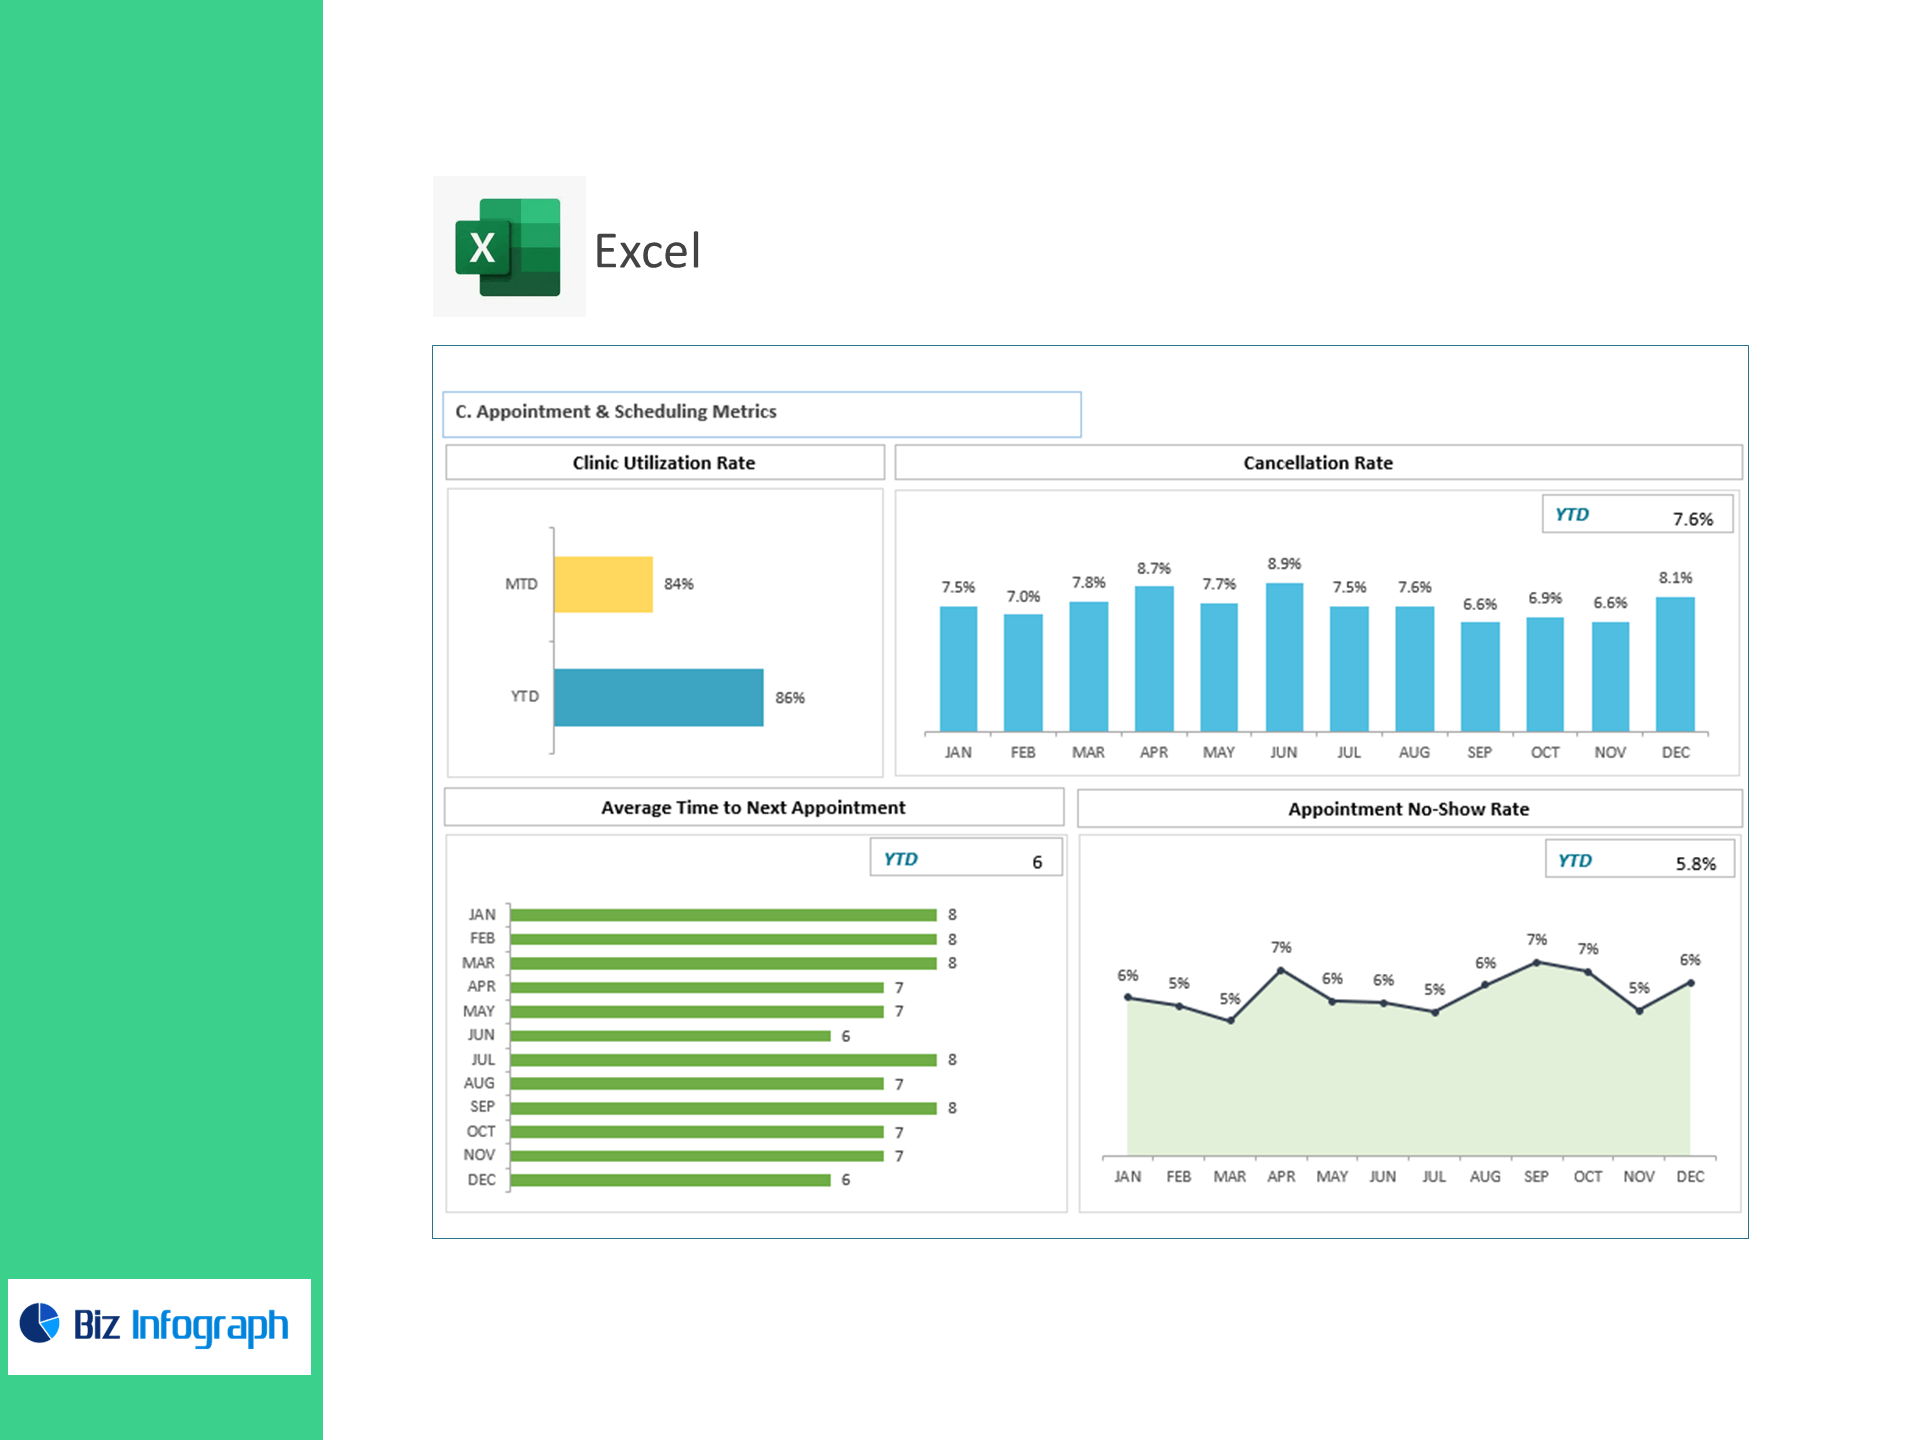
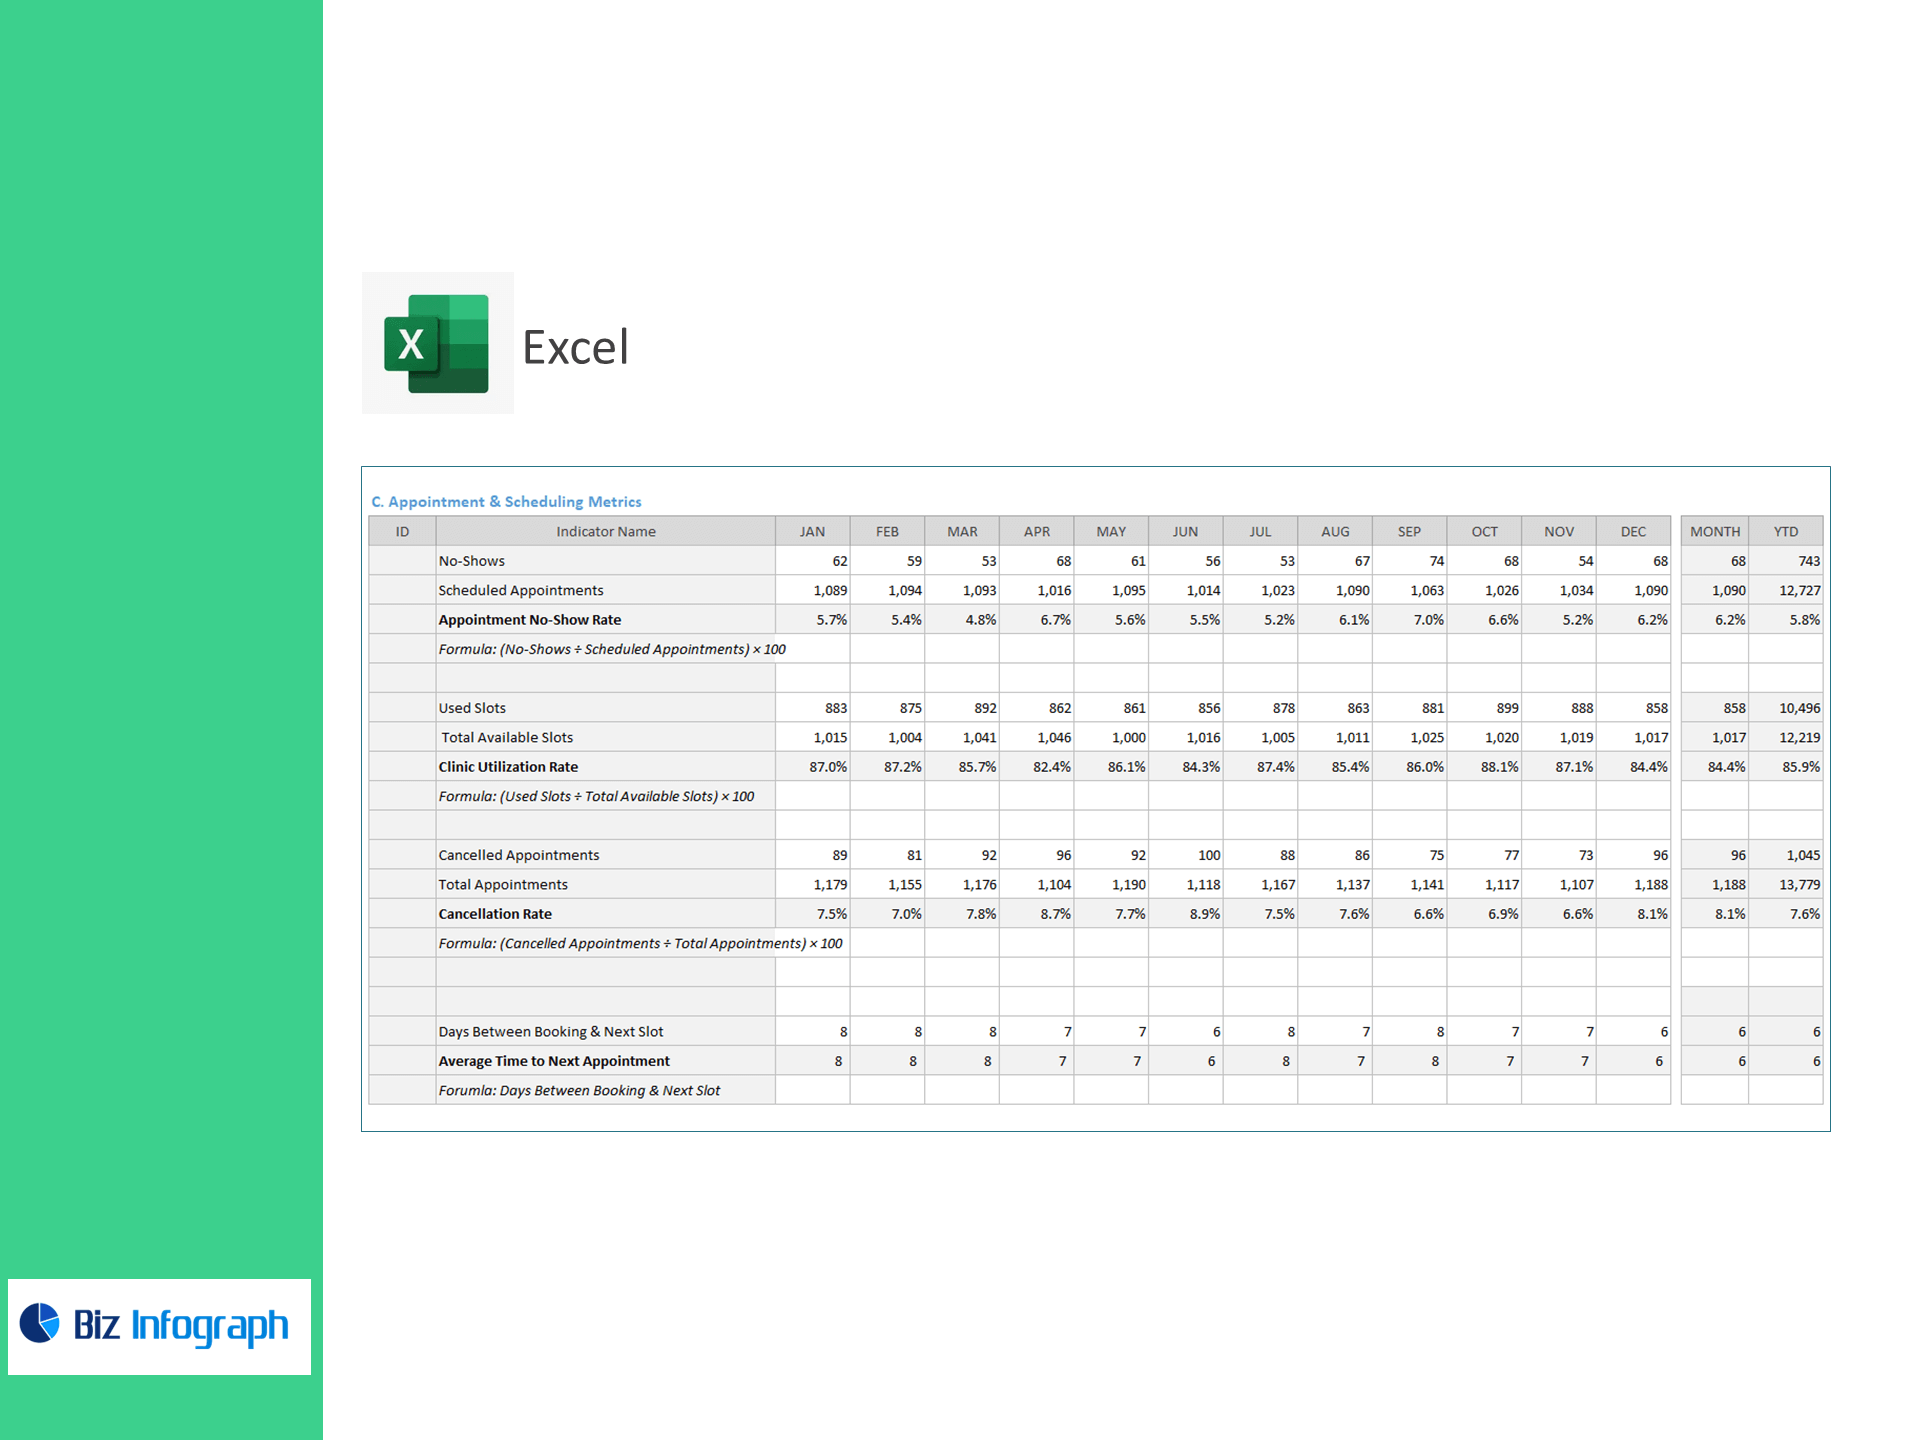
C) Appointment & Scheduling
-
Appointment No-Show Rate (%) = (No-Shows ÷ Scheduled Appointments) × 100
-
Clinic Utilization Rate (%) = (Used Slots ÷ Total Available Slots) × 100
-
Cancellation Rate (%) = (Cancelled Appointments ÷ Total Appointments) × 100
-
Average Time to Next Appointment (days) = Days Between Booking & Next Slot
What’s inside
-
Executive Dashboard: Tiles for ALOS, Occupancy, ER Throughput, Readmissions, HAI, Med Errors, Falls, No-Shows, Utilization, Cancellations, and Time-to-Next—plus trend & target variance.
-
Patient Flow View: Unit/clinic breakdowns of wait times and throughput bottlenecks.
-
Quality & Safety Hub: Control charts for readmissions, HAI, medication errors, and falls.
-
Scheduling Optimizer: No-show heatmaps, slot utilization, and rebooking impact.
-
Targets & Assumptions: Set KPI targets; automatic Above/Below Target highlighting.
-
Clean Data Sheets: Import-ready tables for Admissions/Discharges, Beds, ER Visits, Med Admin, Safety Events, Appointments, and Slots.
How it works
-
Paste CSV/Excel exports from your EMR/scheduling system into the provided tables.
-
Set reporting periods and KPI targets.
-
Review visuals to relieve bottlenecks, tighten safety controls, and optimize access.
Benefits
-
Shorter waits & faster throughput: Improve patient experience and capacity.
-
Safer care: Track and reduce readmissions, HAI, and medication errors.
-
Better access: Lift utilization, cut no-shows, and reduce time to next.
-
Actionable & credible: Clear definitions and formulas for audit-ready reporting.
For ready-to-use Dashboard Templates: