Agriculture & Food Processing Financial Dashboard – Excel Template
All-in-one KPI dashboard for farms, agribusiness, and food processors. Track profitability, liquidity, cash flow, and production efficiency in one clean Excel workbook—no add-ins, no code.
Why this template
-
Built for agriculture & food processing: Aligns with the metrics you actually manage—from field yields to post-harvest losses and unit economics.
-
Finance + Ops in one view: Blend income statement KPIs with real-time operational performance to spot issues early and act faster.
-
Ready on day one: Plug in your data and get automated charts, trends, and variance insights (month-over-month and YTD).
KPIs covered (out of the box)
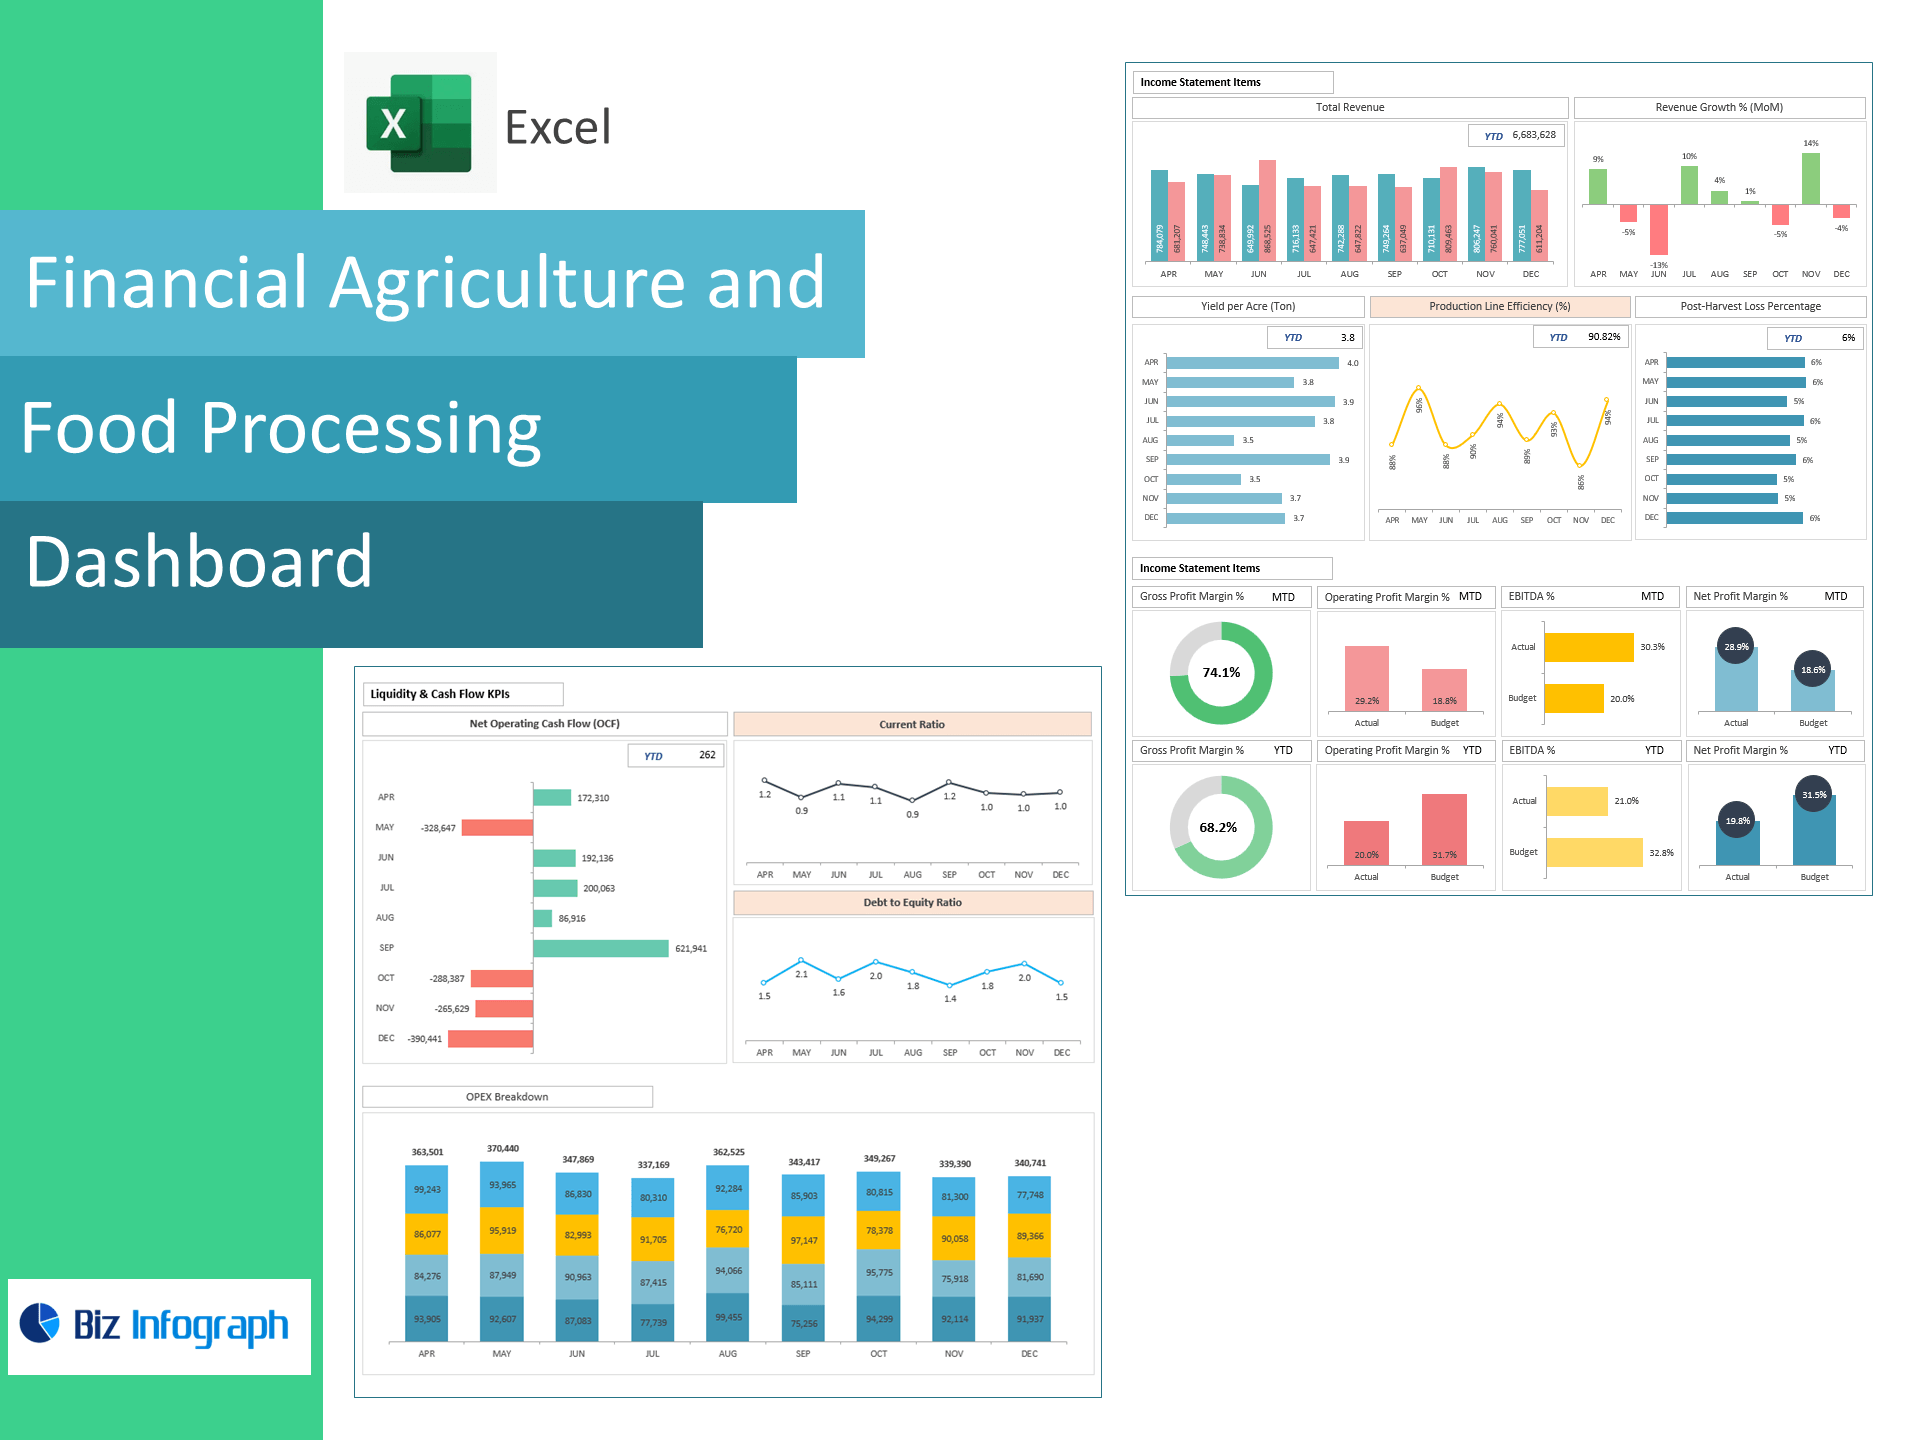
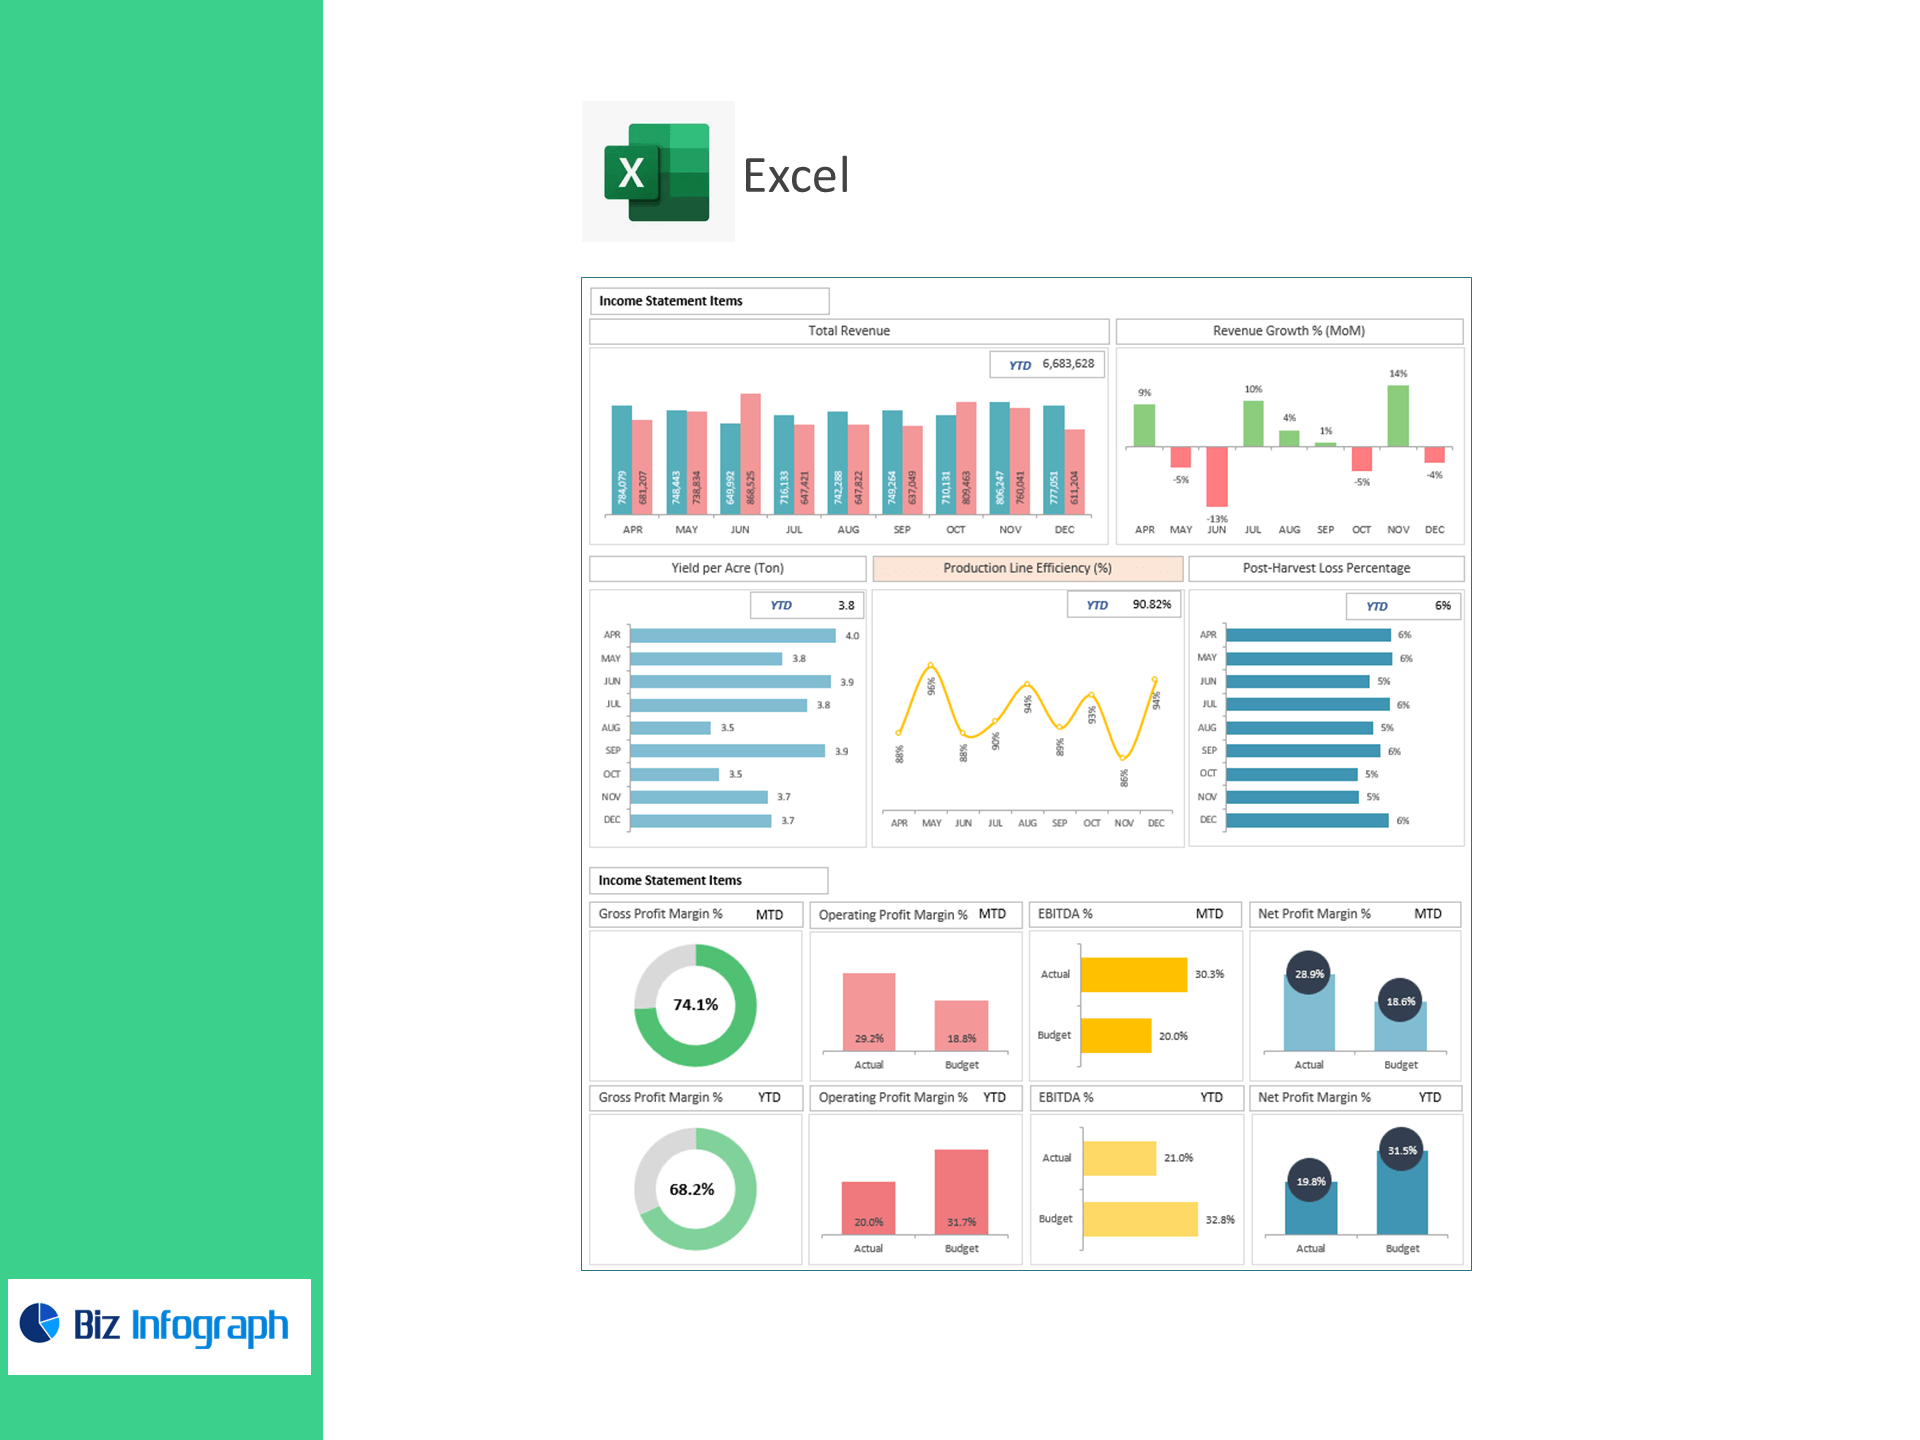
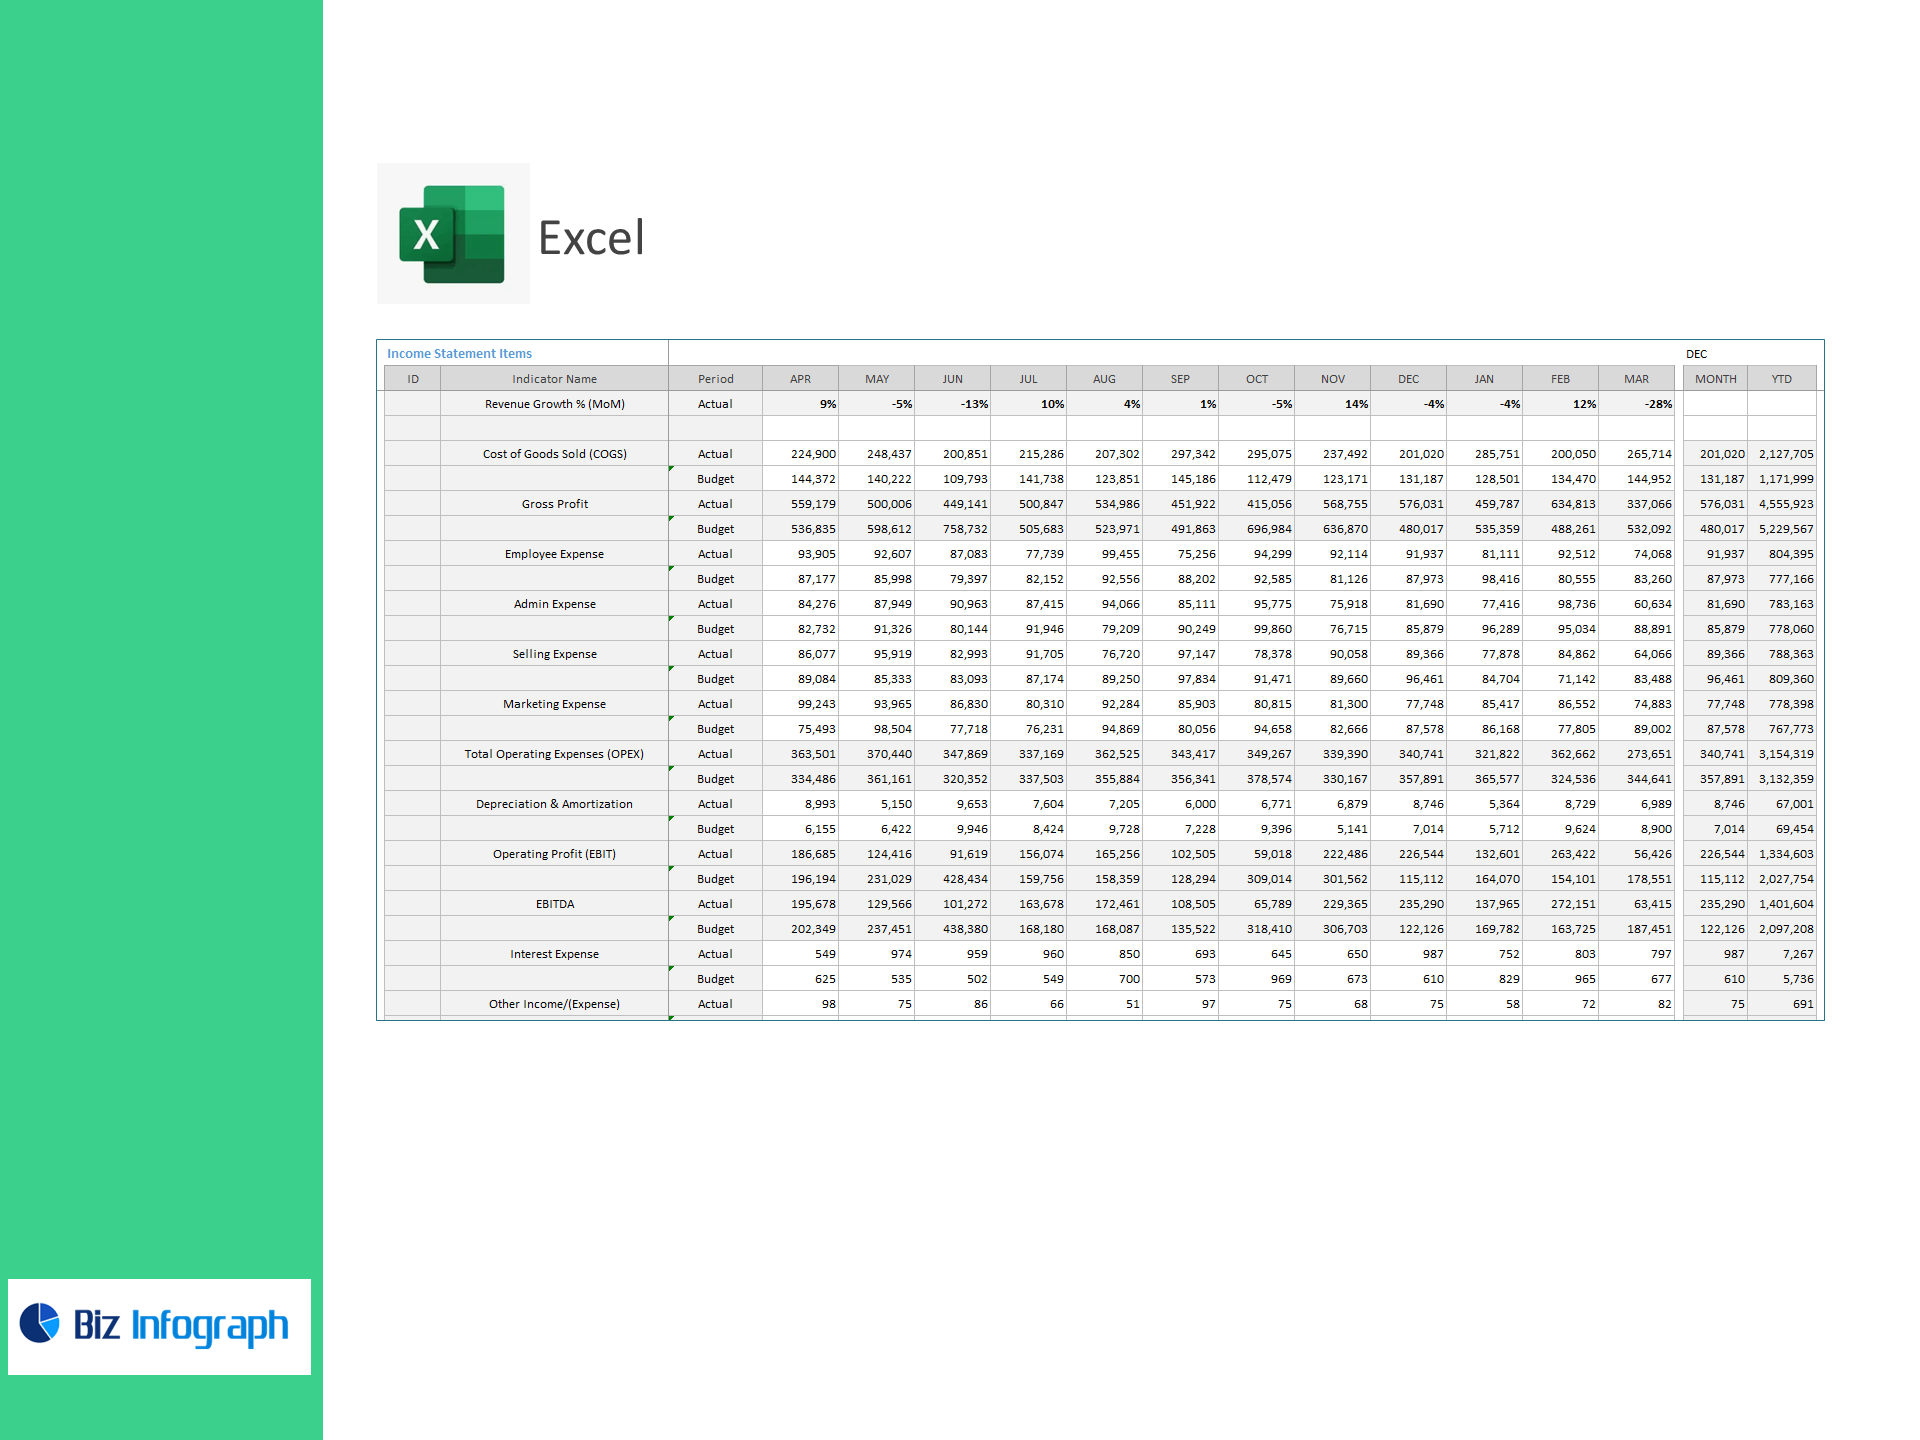
Income Statement
-
Total Revenue, Revenue Growth % (MoM)
-
Cost of Goods Sold (COGS), Gross Profit
-
Employee, Admin, Selling, Marketing Expense
-
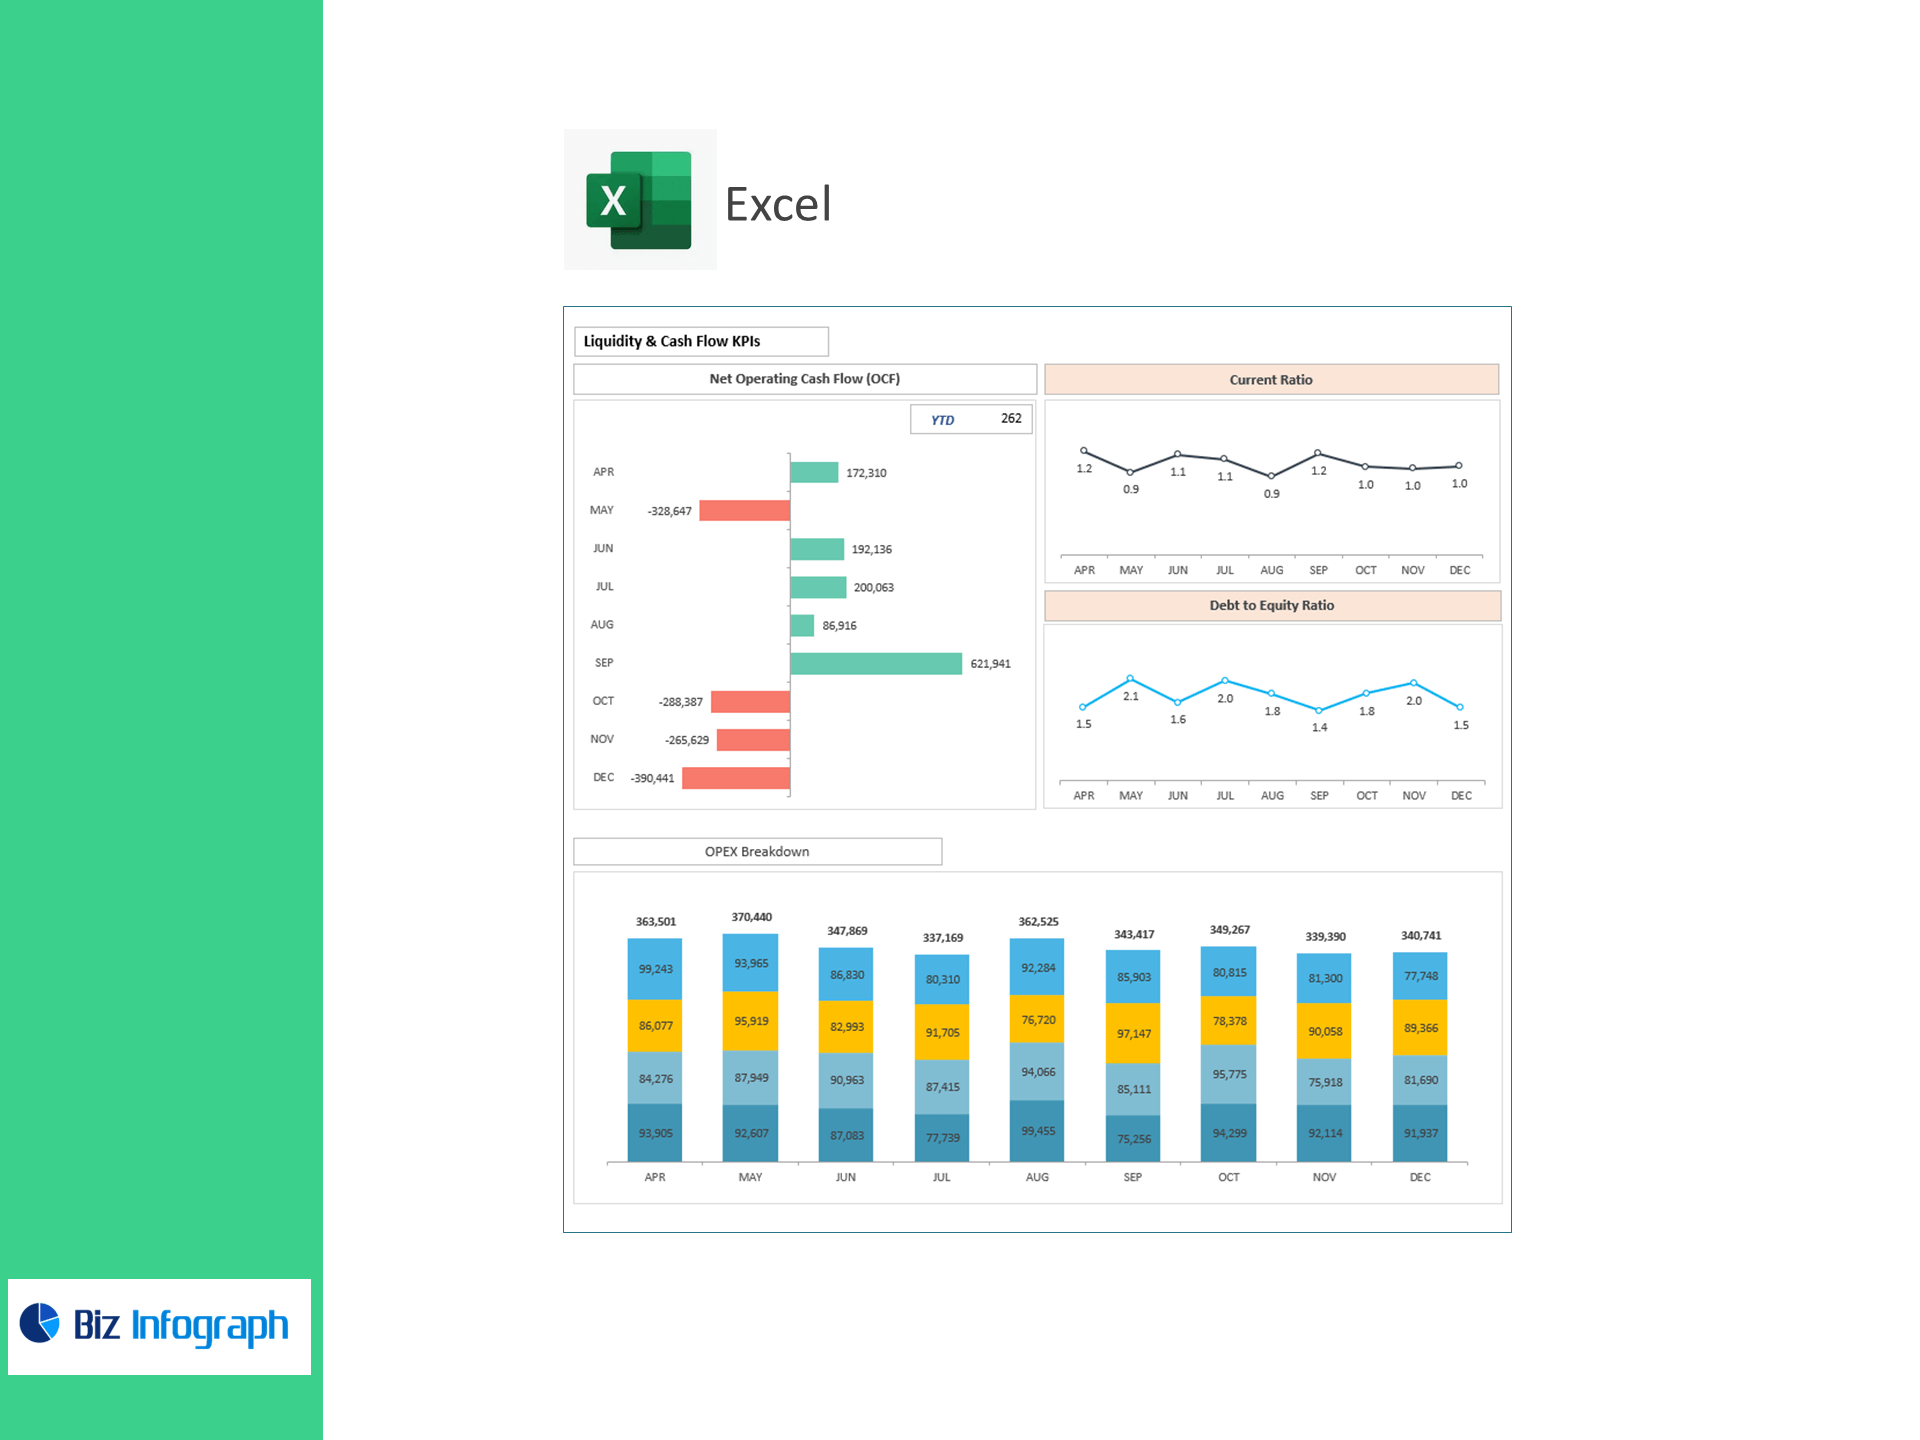
Total Operating Expenses (OPEX) + OPEX Breakdown
-
Depreciation & Amortization, Operating Profit (EBIT)
-
EBITDA, Interest, Other Income/(Expense), Taxes, Net Profit
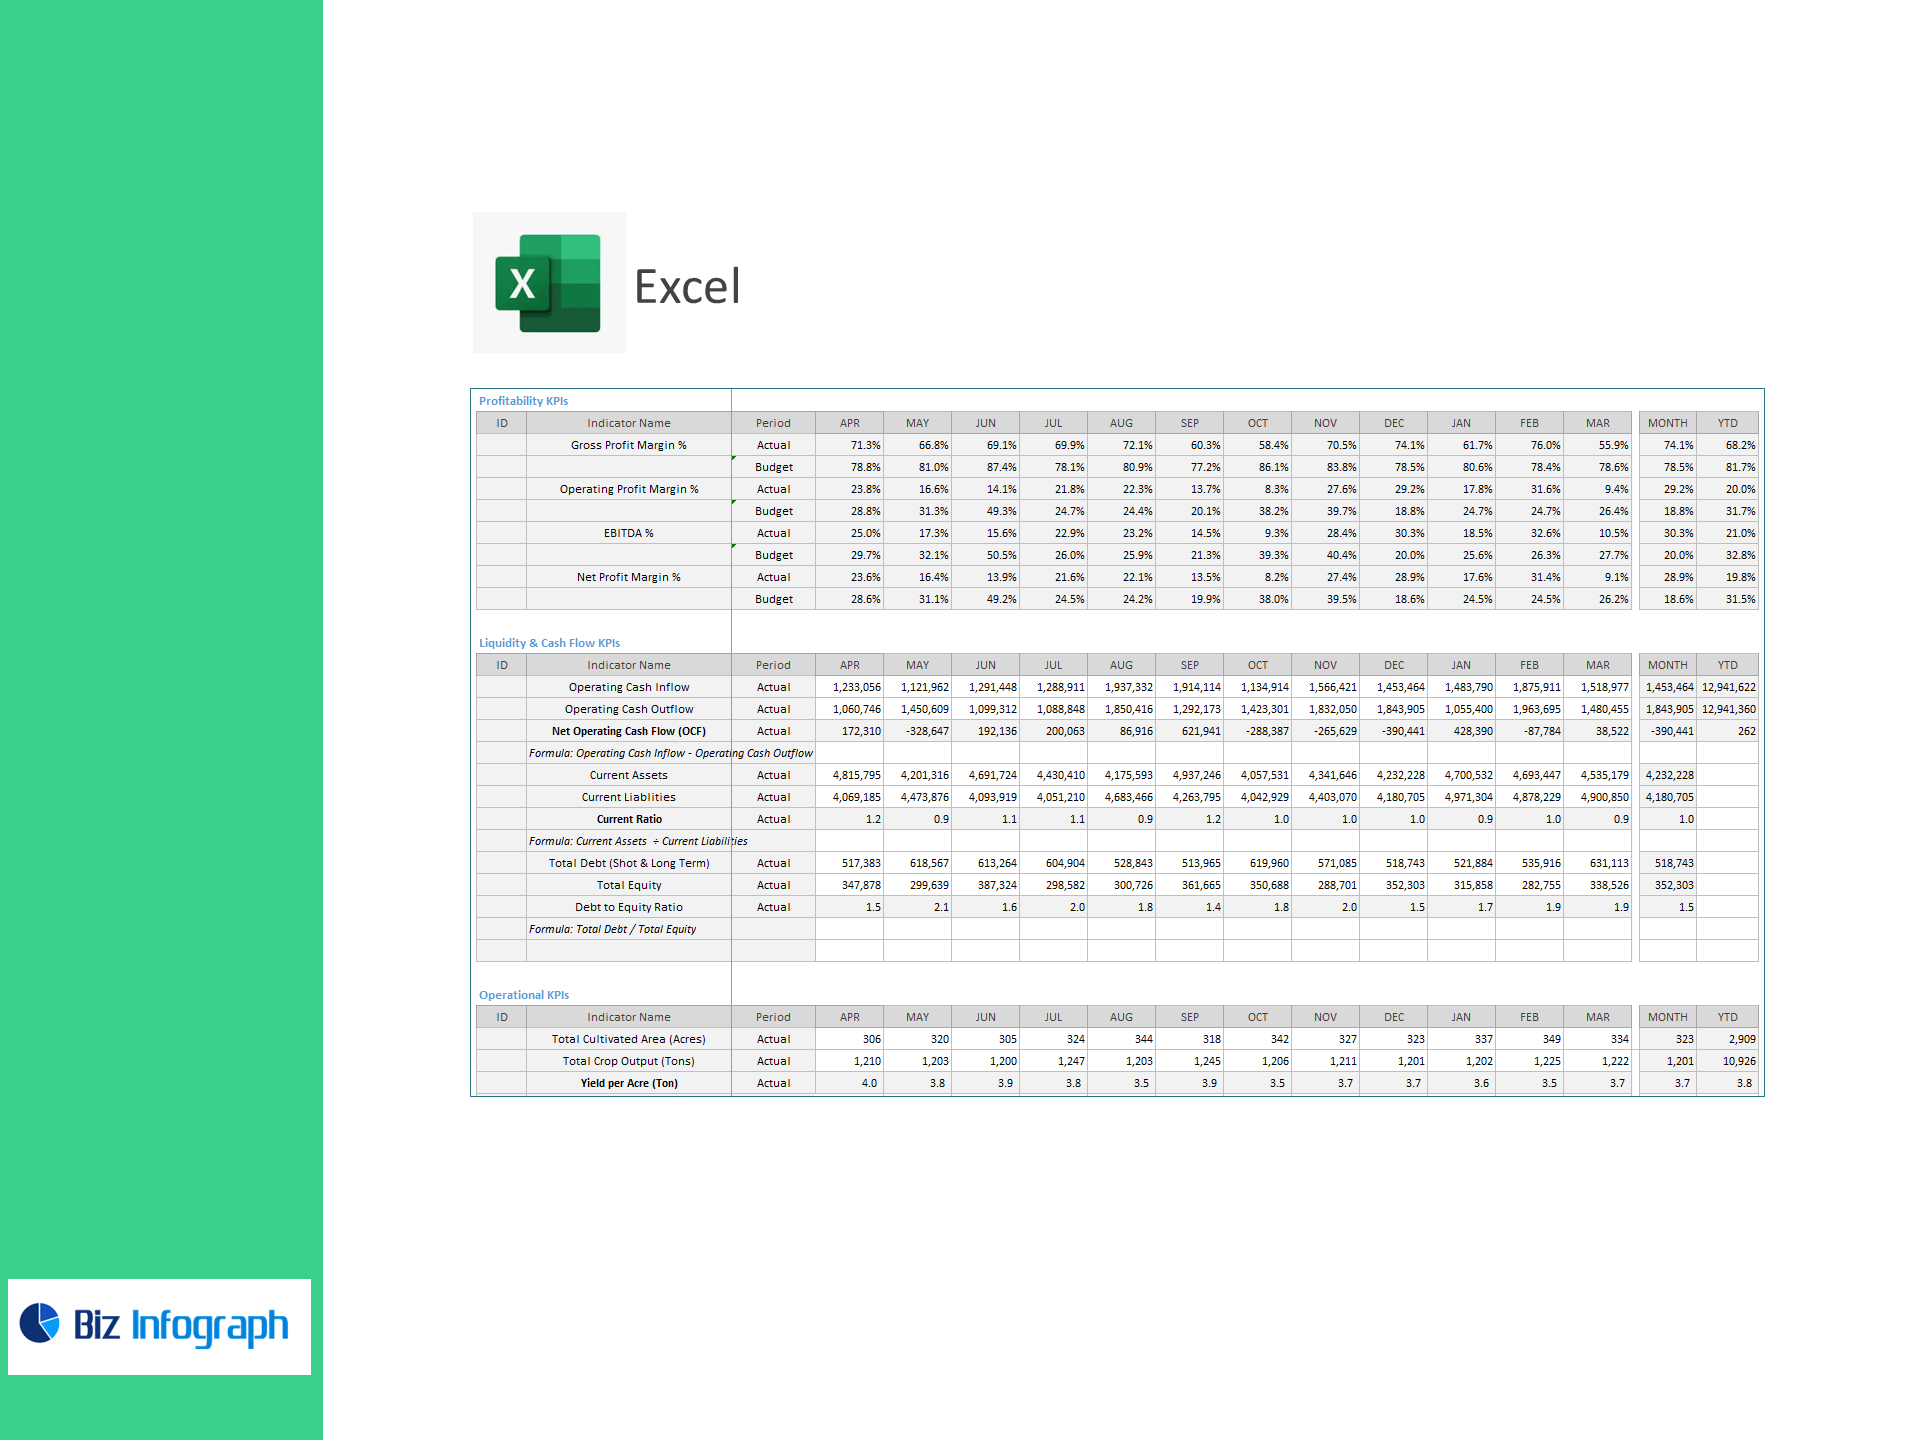
Profitability
-
Gross Profit Margin %, Operating Profit Margin %, EBITDA %, Net Profit Margin %
Liquidity & Cash Flow
-
Operating Cash Inflow, Operating Cash Outflow, Net Operating Cash Flow (OCF)
-
Current Assets, Current Liabilities, Current Ratio
-
Total Debt (Short & Long Term), Total Equity, Debt-to-Equity Ratio
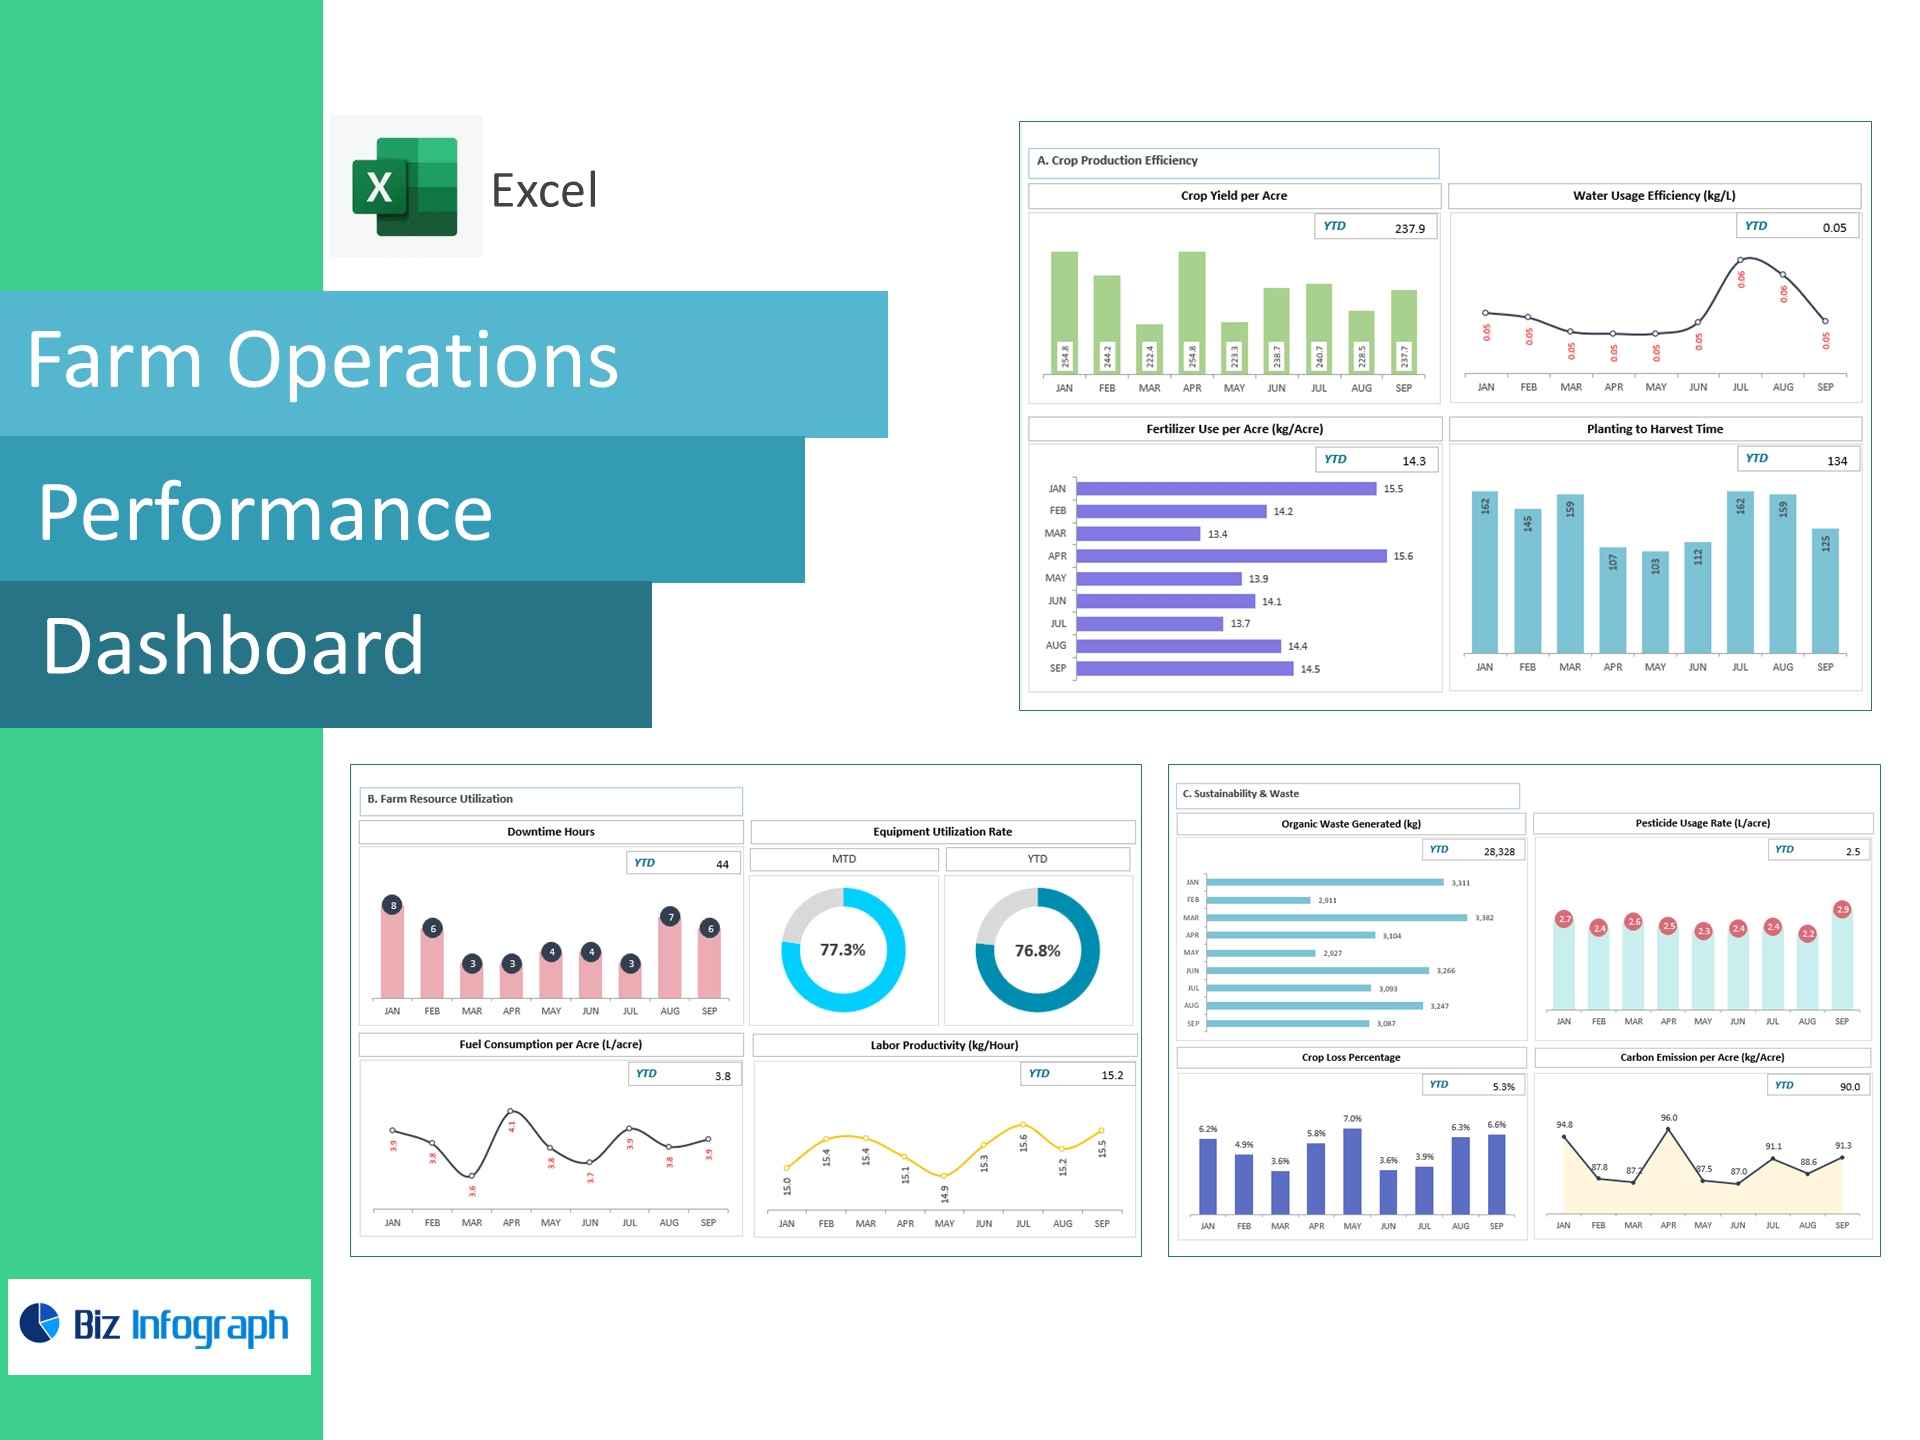
Operational (Field & Processing)
-
Total Cultivated Area (Acres), Total Crop Output (Tons), Yield per Acre (Ton)
-
Planned Output (Ton) vs Actual Output (Ton)
-
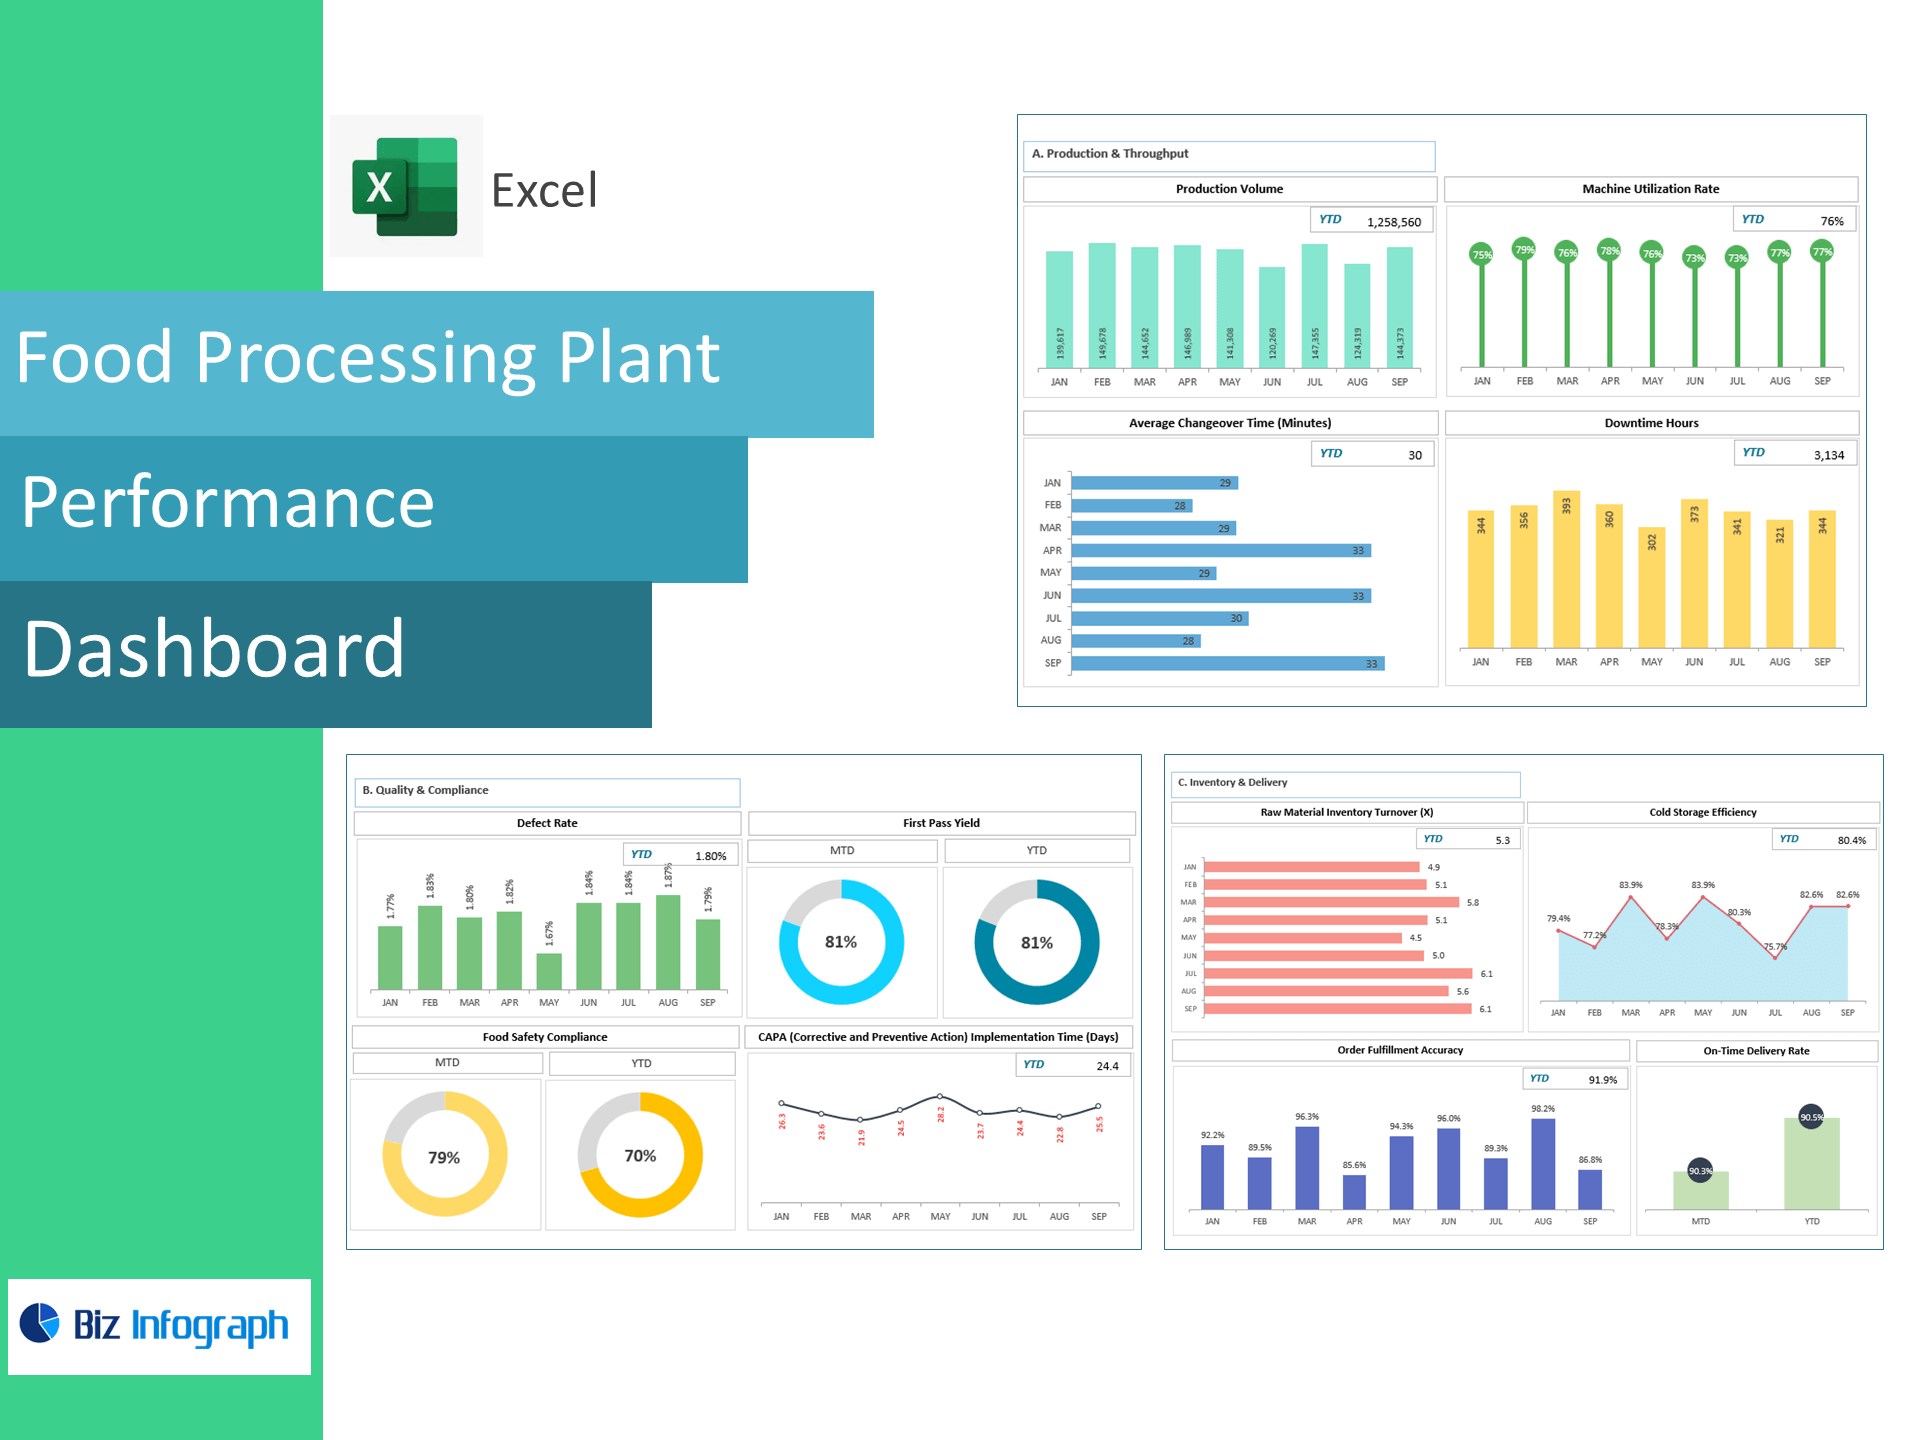
Production Line Efficiency (%)
-
Total Harvested Quantity (Ton), Quantity Lost (Ton), Post-Harvest Loss %
What you get
-
Executive Dashboard: At-a-glance scorecards, MoM trend lines, traffic-light indicators, and variance highlights.
-
Finance Sheets: Automated P&L, OPEX breakdown, profitability ratios.
-
Cash & Liquidity: OCF summary, current ratio, and leverage snapshot.
-
Operations Console: Yield per acre tracking, plan vs actual output, line efficiency, and post-harvest loss analysis.
-
Data Input Sheets: Clean, validated entry tables and sample data to get you started.
-
Print-ready Reports: One-click PDFs for management and lender updates.
Who it’s for
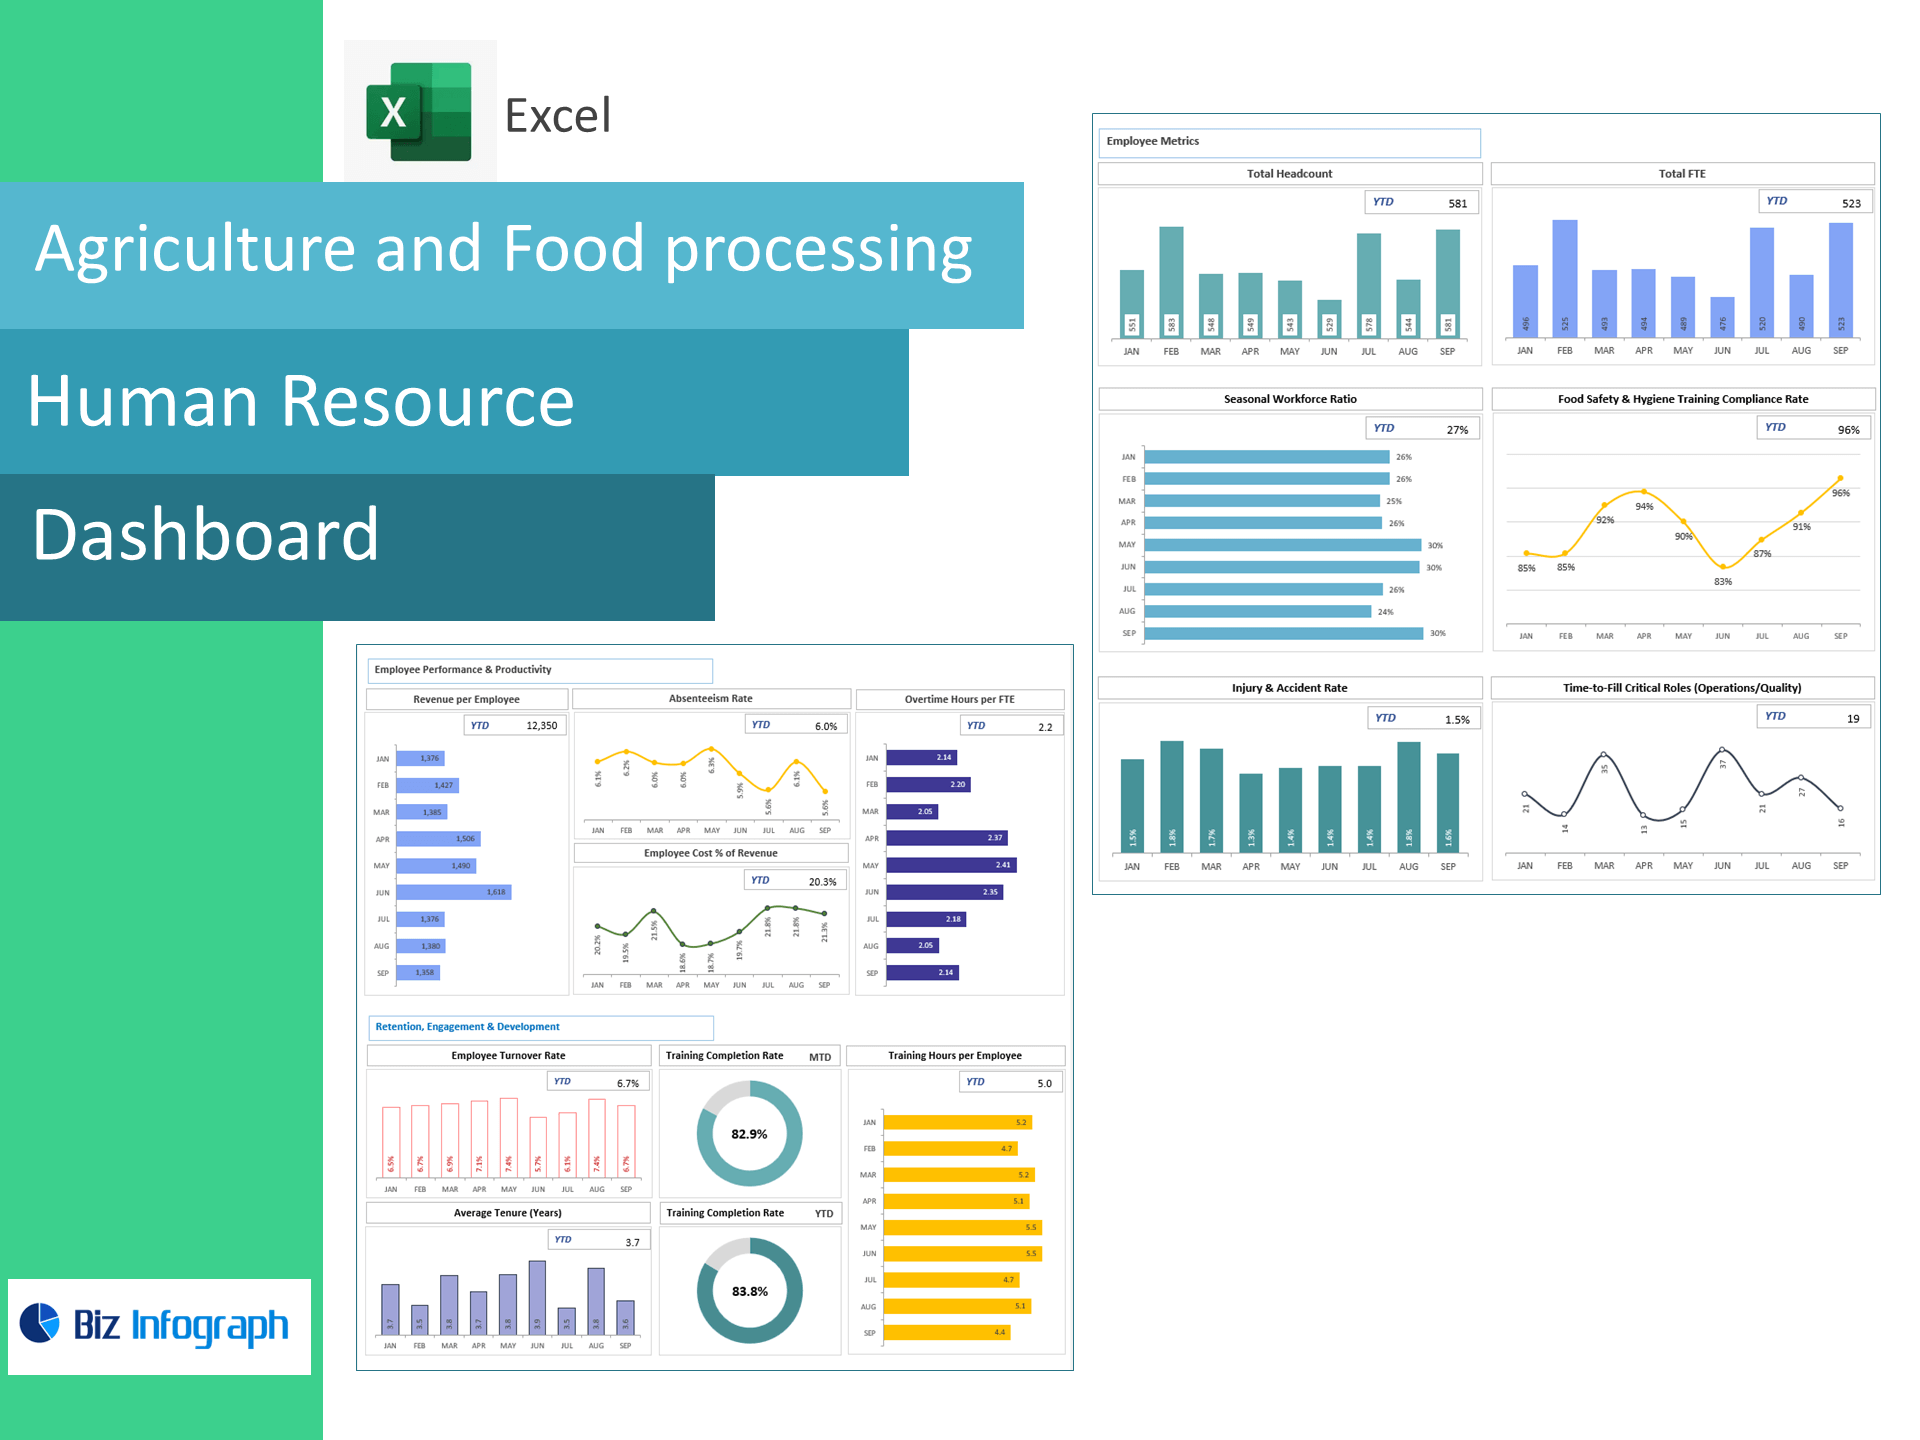
Operations managers, farm owners, CFOs/Finance leads, FP&A analysts, production supervisors, and consultants supporting agriculture and food processing clients.
Key benefits
-
See true unit economics: Connect yield and loss metrics to COGS, margins, and cash.
-
Control costs: Monitor OPEX by category and spot overspend early.
-
Improve throughput: Track plan vs actual and efficiency to reduce downtime.
-
Strengthen liquidity: Keep an eye on OCF, current ratio, and leverage.
-
Make faster decisions: Clear visuals, drill-downs, and automated variance flags.
For ready-to-use Dashboard Templates: