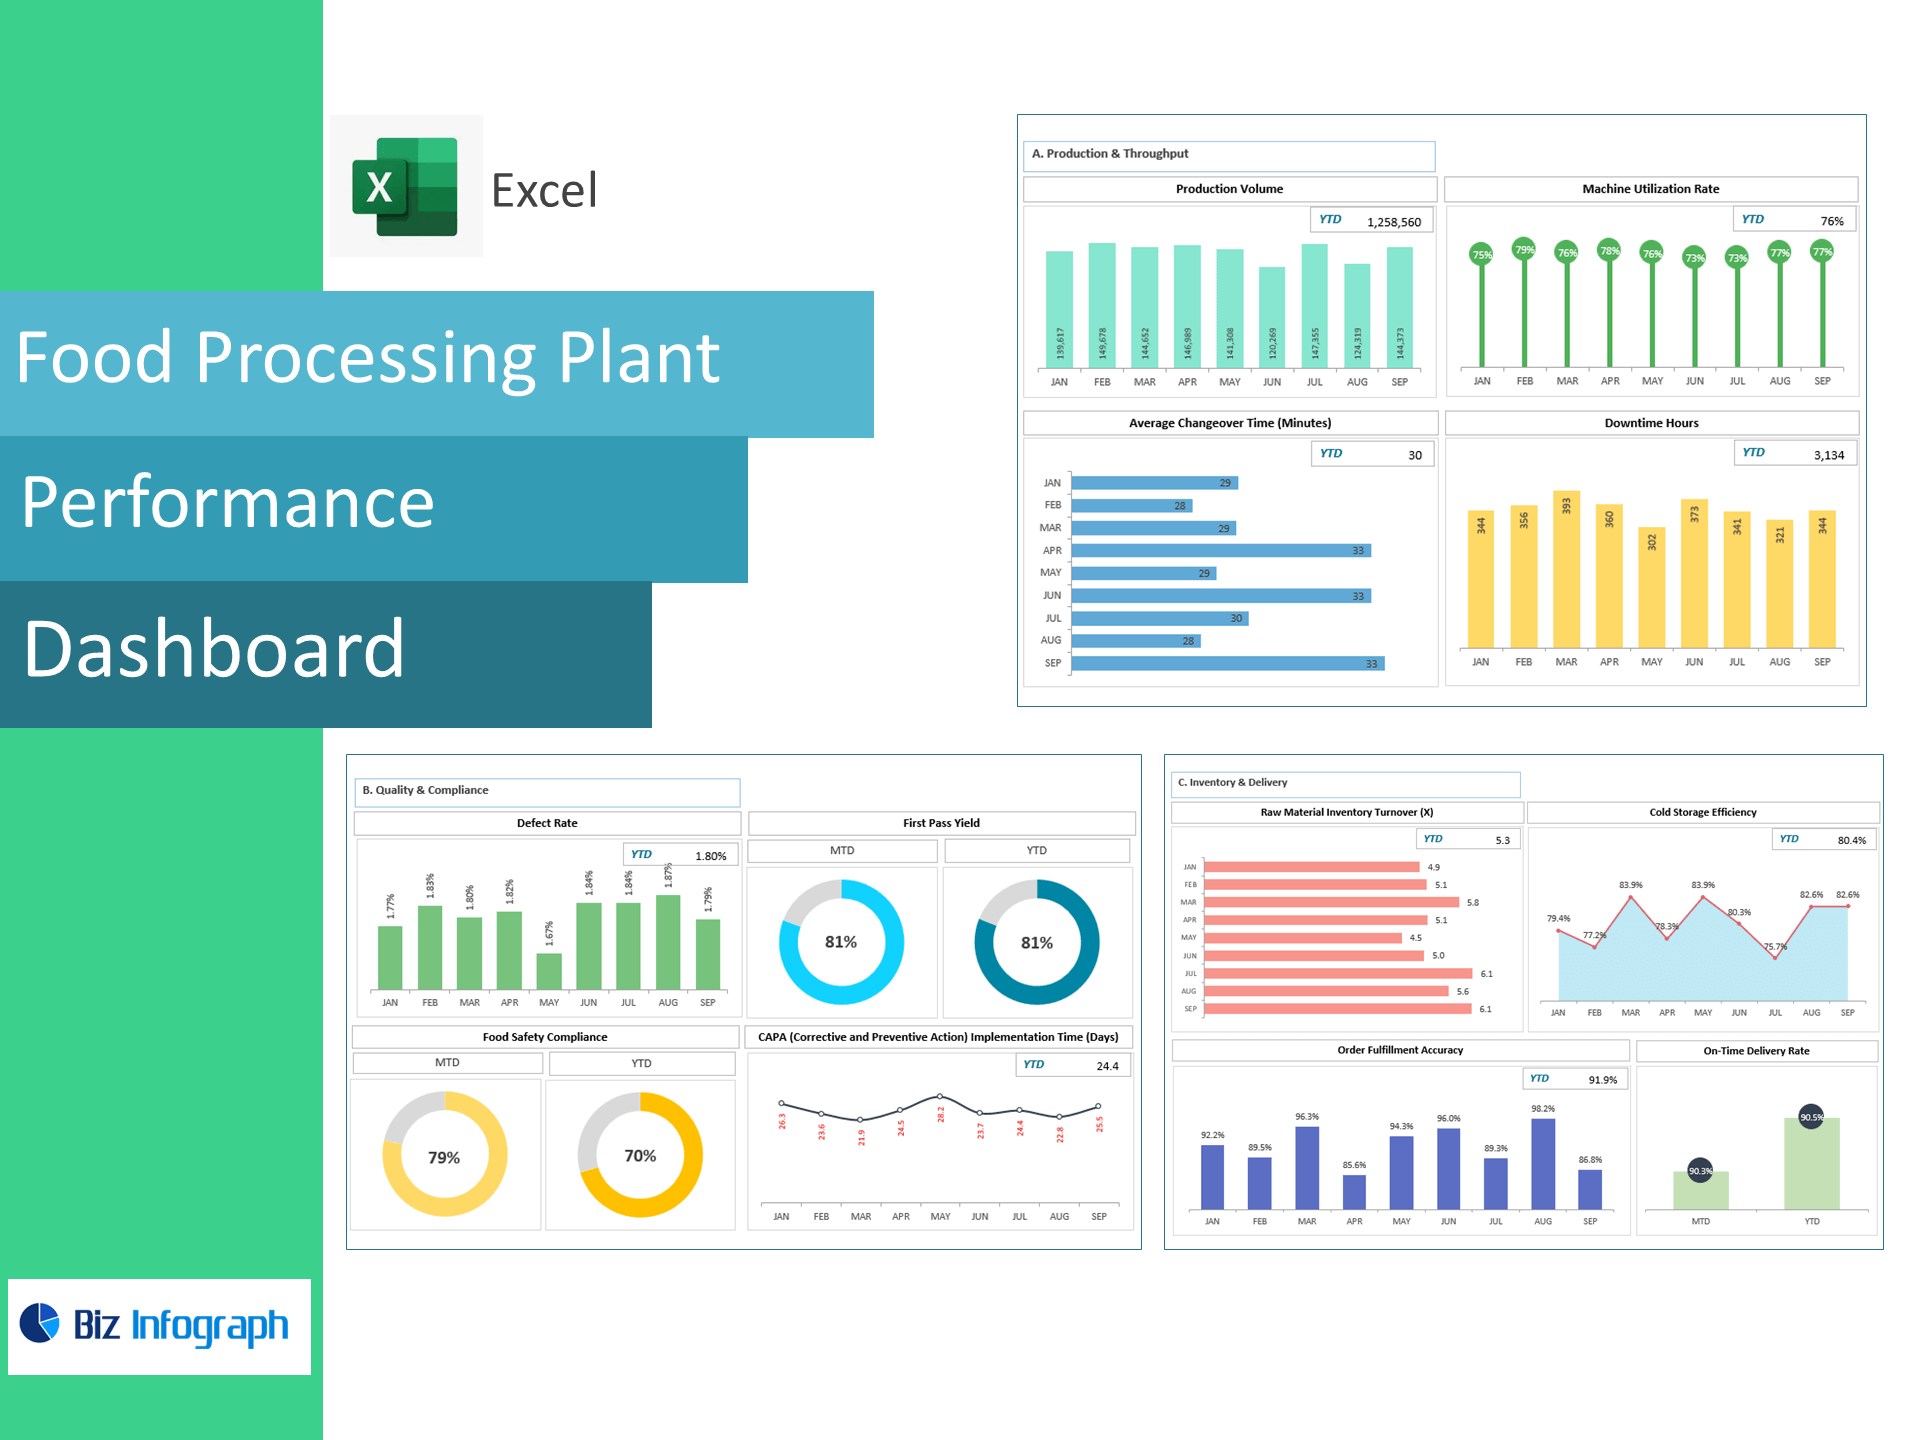
Food Processing Plant Performance Dashboard — Excel Template
Turn shop-floor data into decisions. This SEO-optimized Excel template gives food manufacturers a ready-made, no-code dashboard to track production, quality, compliance, inventory, and delivery performance—all in one place.
Why this template?
-
Built for food processing: includes cold-storage, audit, and CAPA timing KPIs.
-
Fast setup: paste your monthly data and the dashboard auto-calculates metrics and visuals.
-
Actionable insights: instantly see where throughput, quality, or delivery accuracy is slipping.
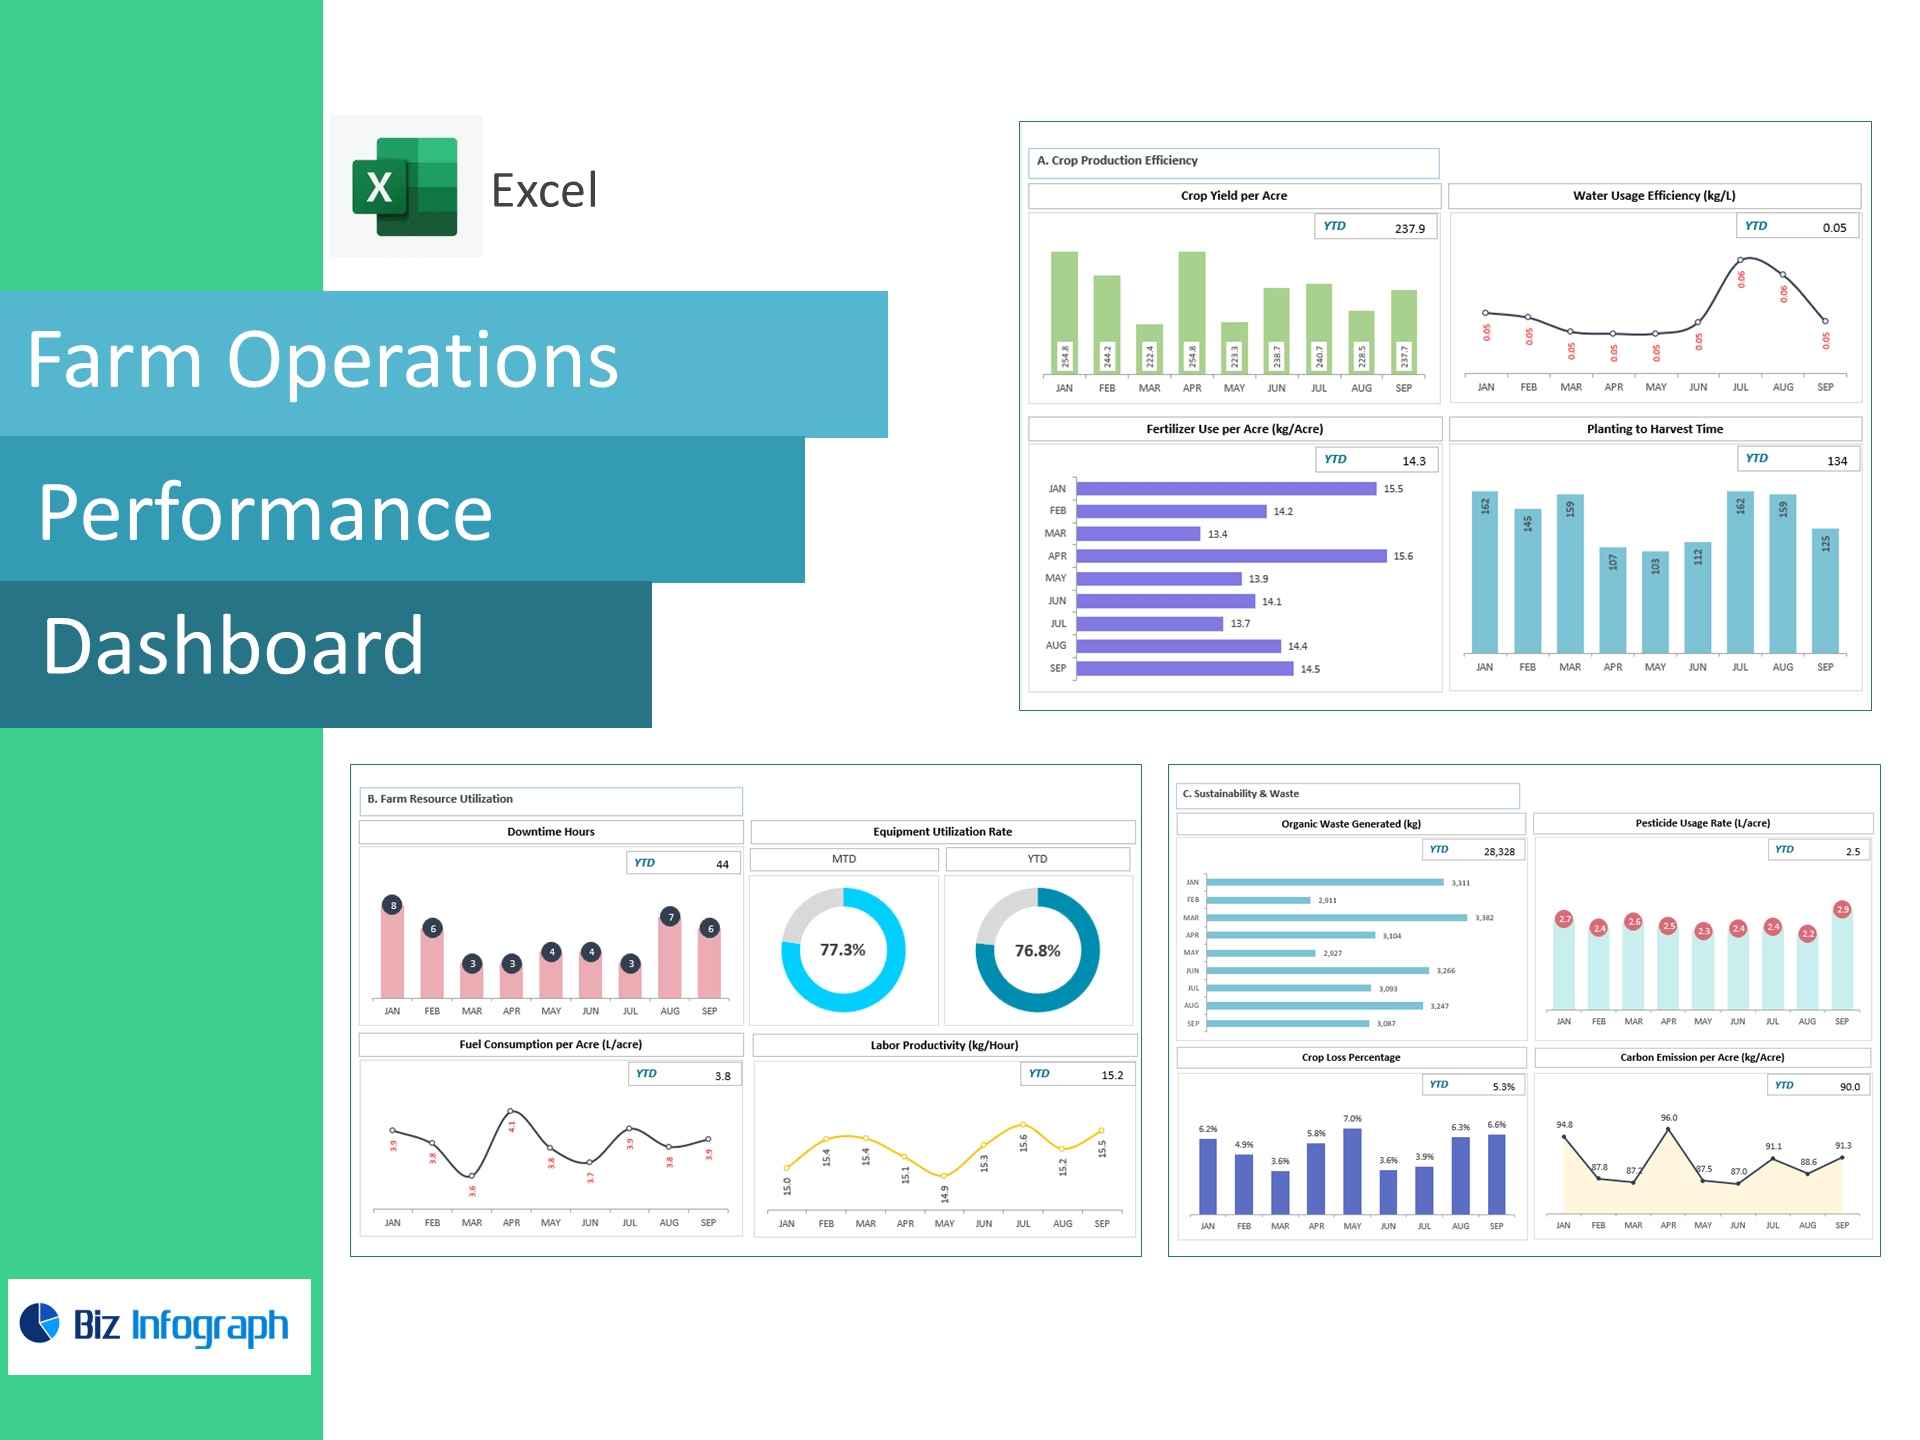
What you’ll track (out-of-the-box KPIs)
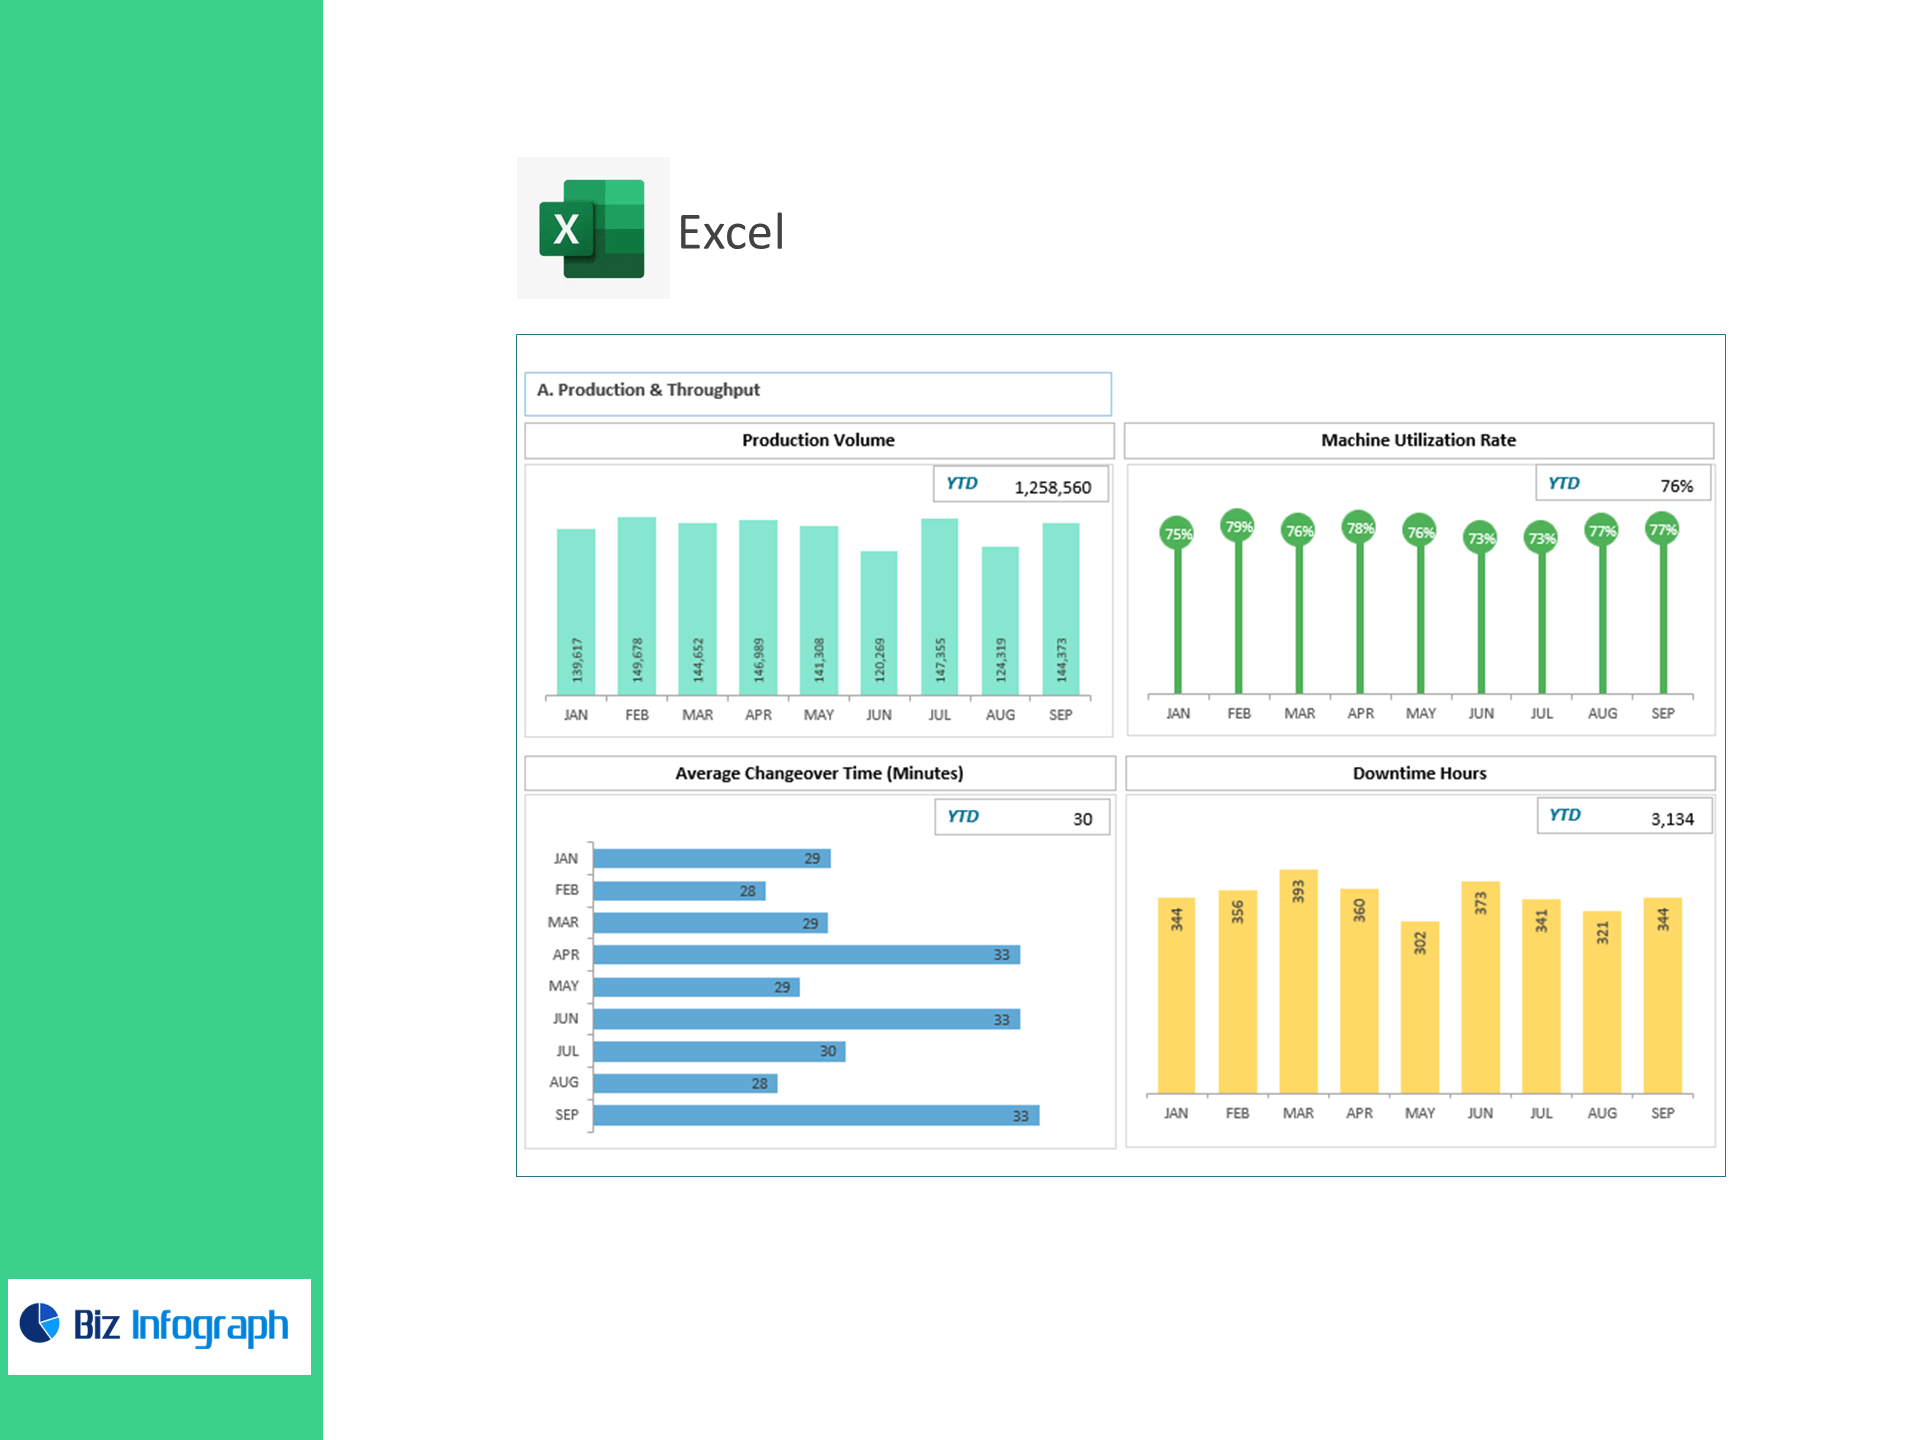
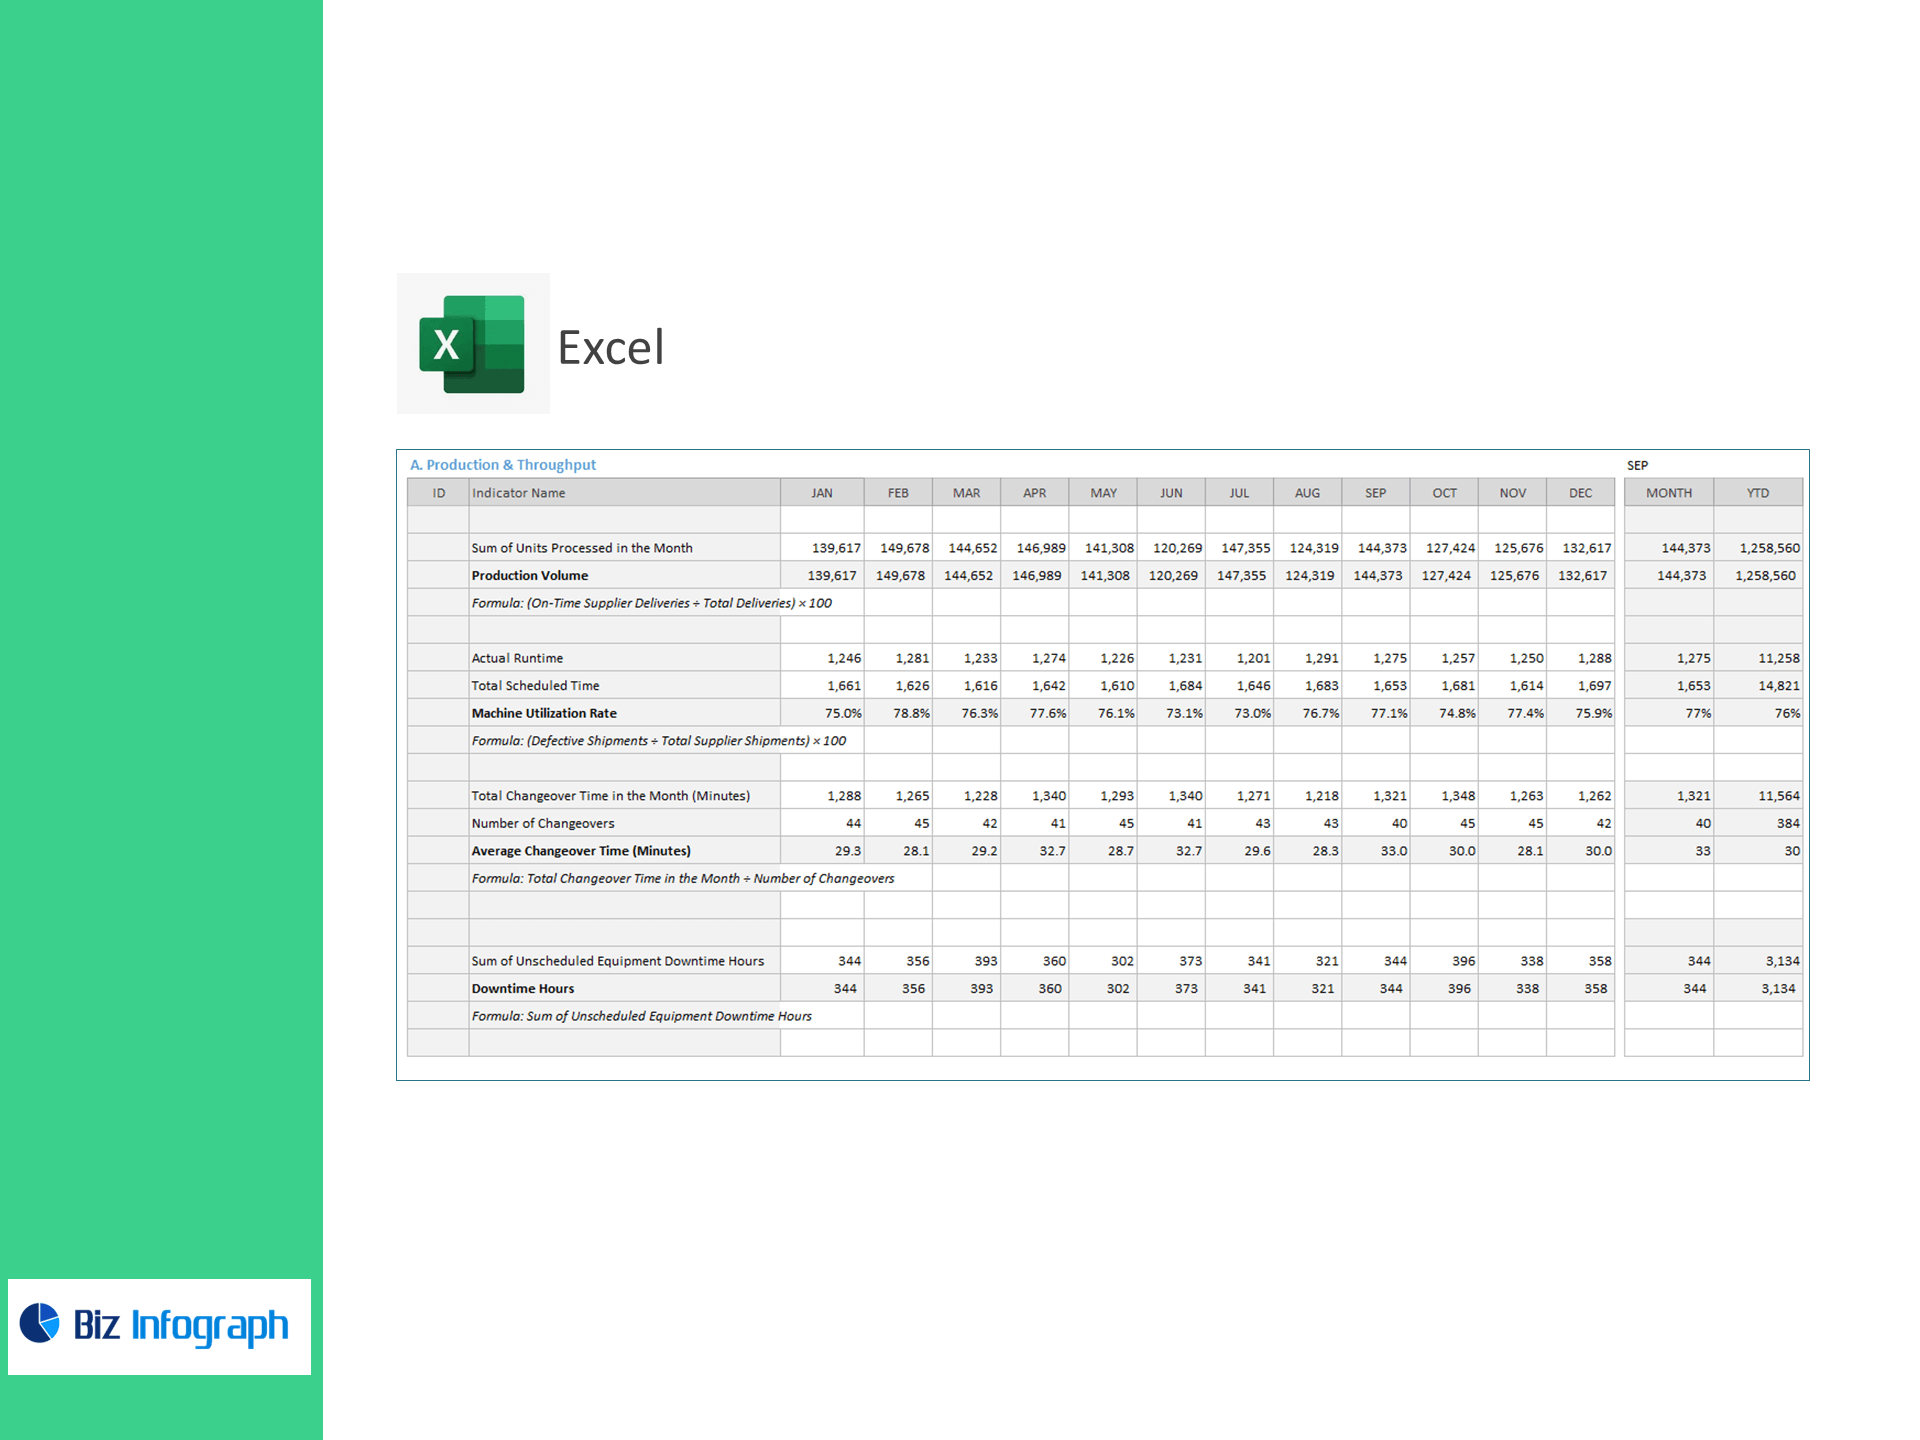
A. Production & Throughput
-
Sum of Units Processed in the Month
-
Production Volume
-
Actual Runtime vs Total Scheduled Time
-
Machine Utilization Rate
-
Formula:
Actual Runtime ÷ Total Scheduled Time
-
-
Total Changeover Time (Minutes), Number of Changeovers, Average Changeover Time (Minutes)
-
Formula:
Total Changeover Time ÷ Number of Changeovers
-
-
Unscheduled Equipment Downtime Hours (Sum)
-
Formula:
Sum of Unscheduled Equipment Downtime Hours
-
-
On-Time Supplier Deliveries % (supplier reliability)
-
Formula:
(On-Time Supplier Deliveries ÷ Total Deliveries) × 100
-
-
Supplier Defect Rate % (incoming quality)
-
Formula:
(Defective Shipments ÷ Total Supplier Shipments) × 100
-
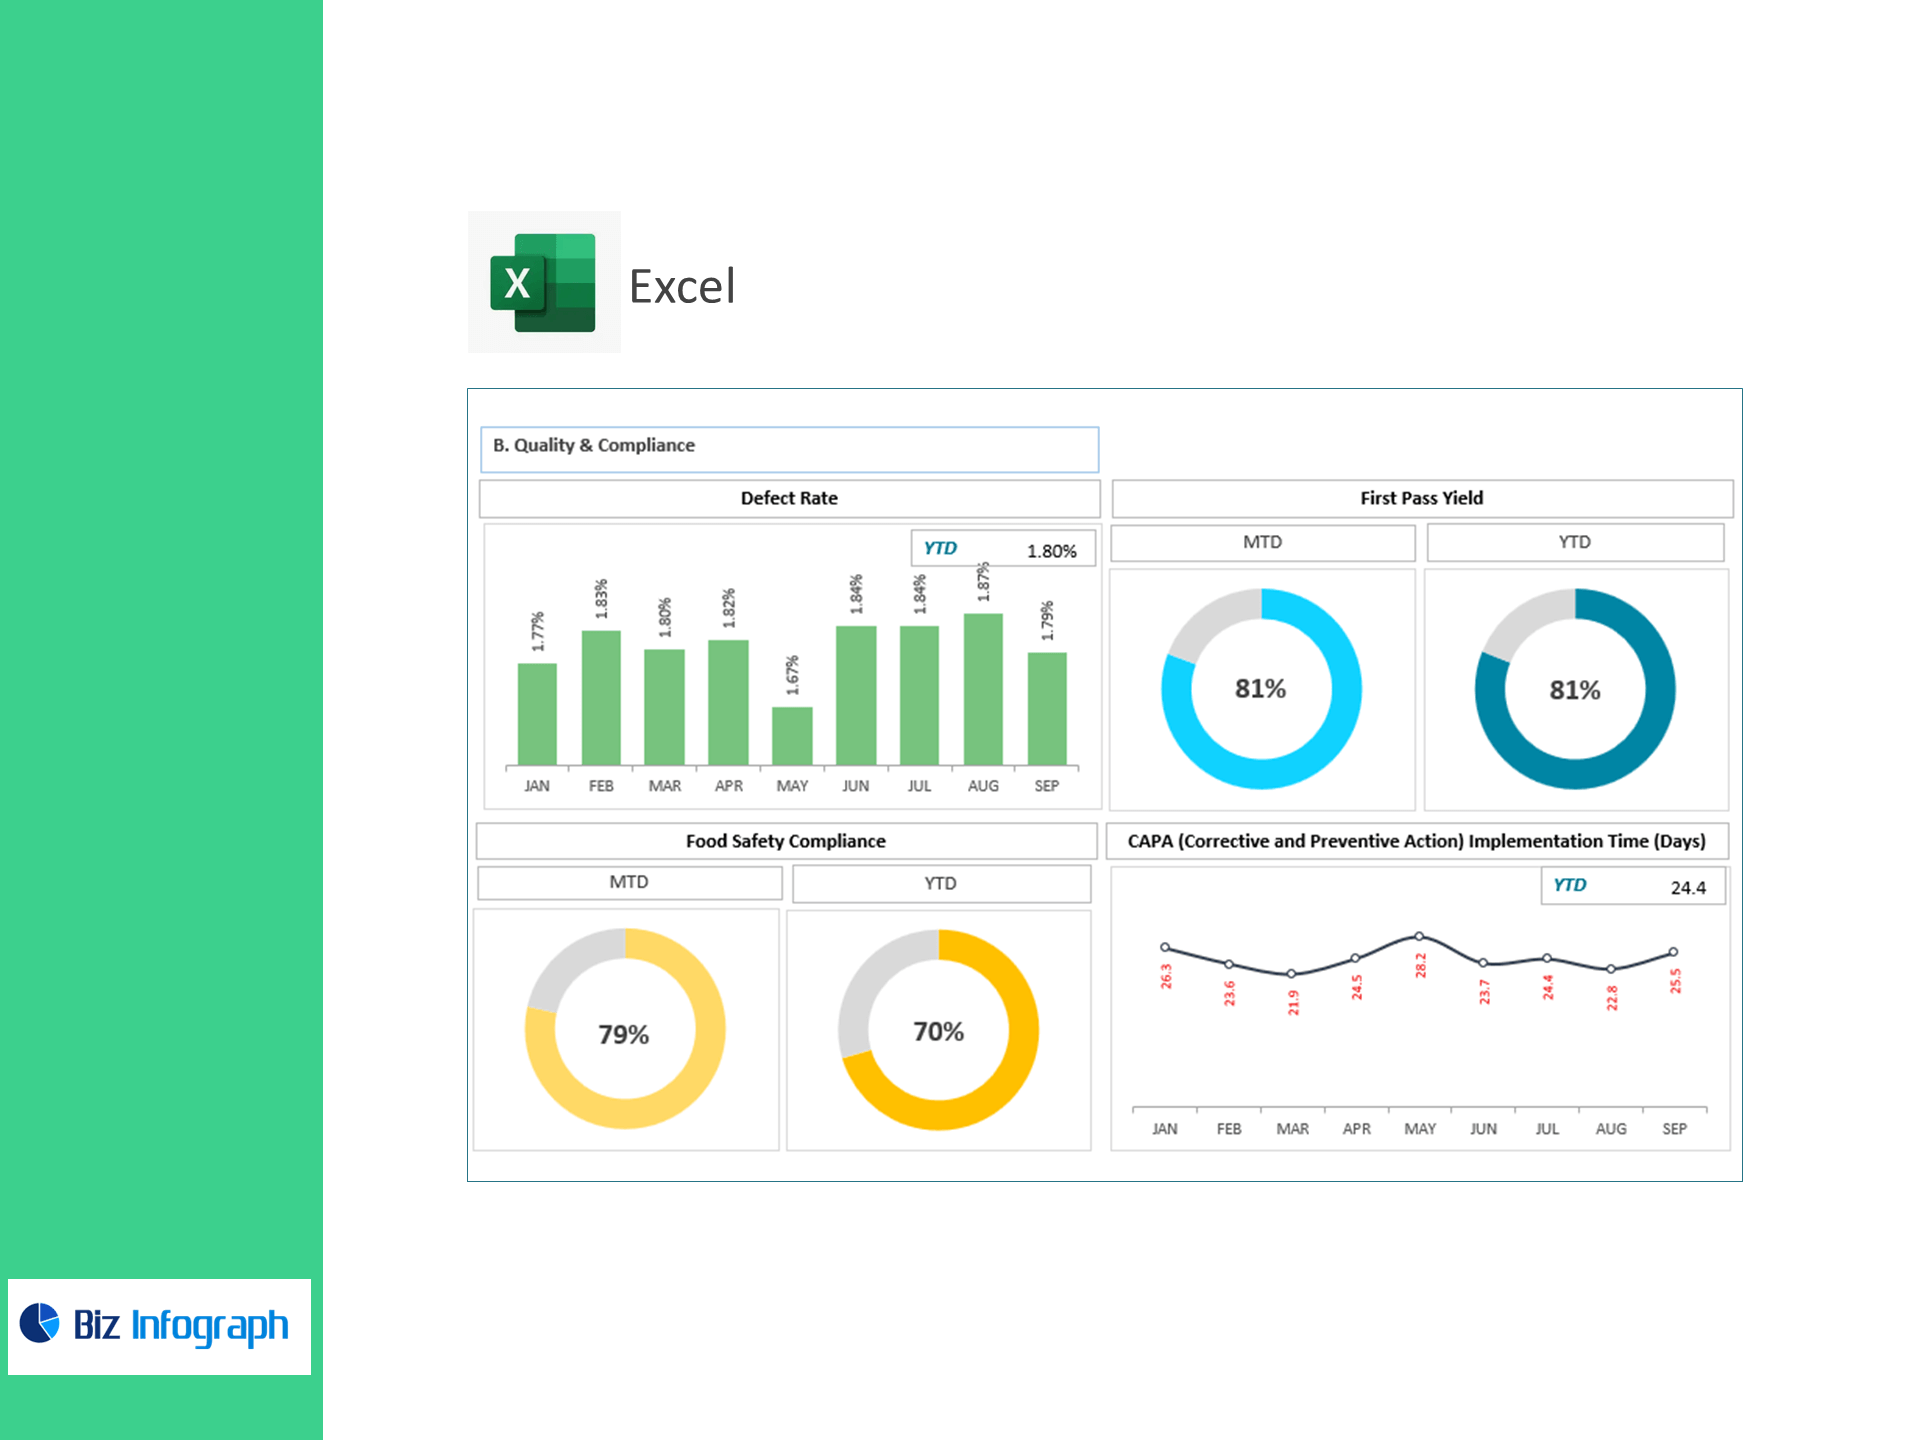
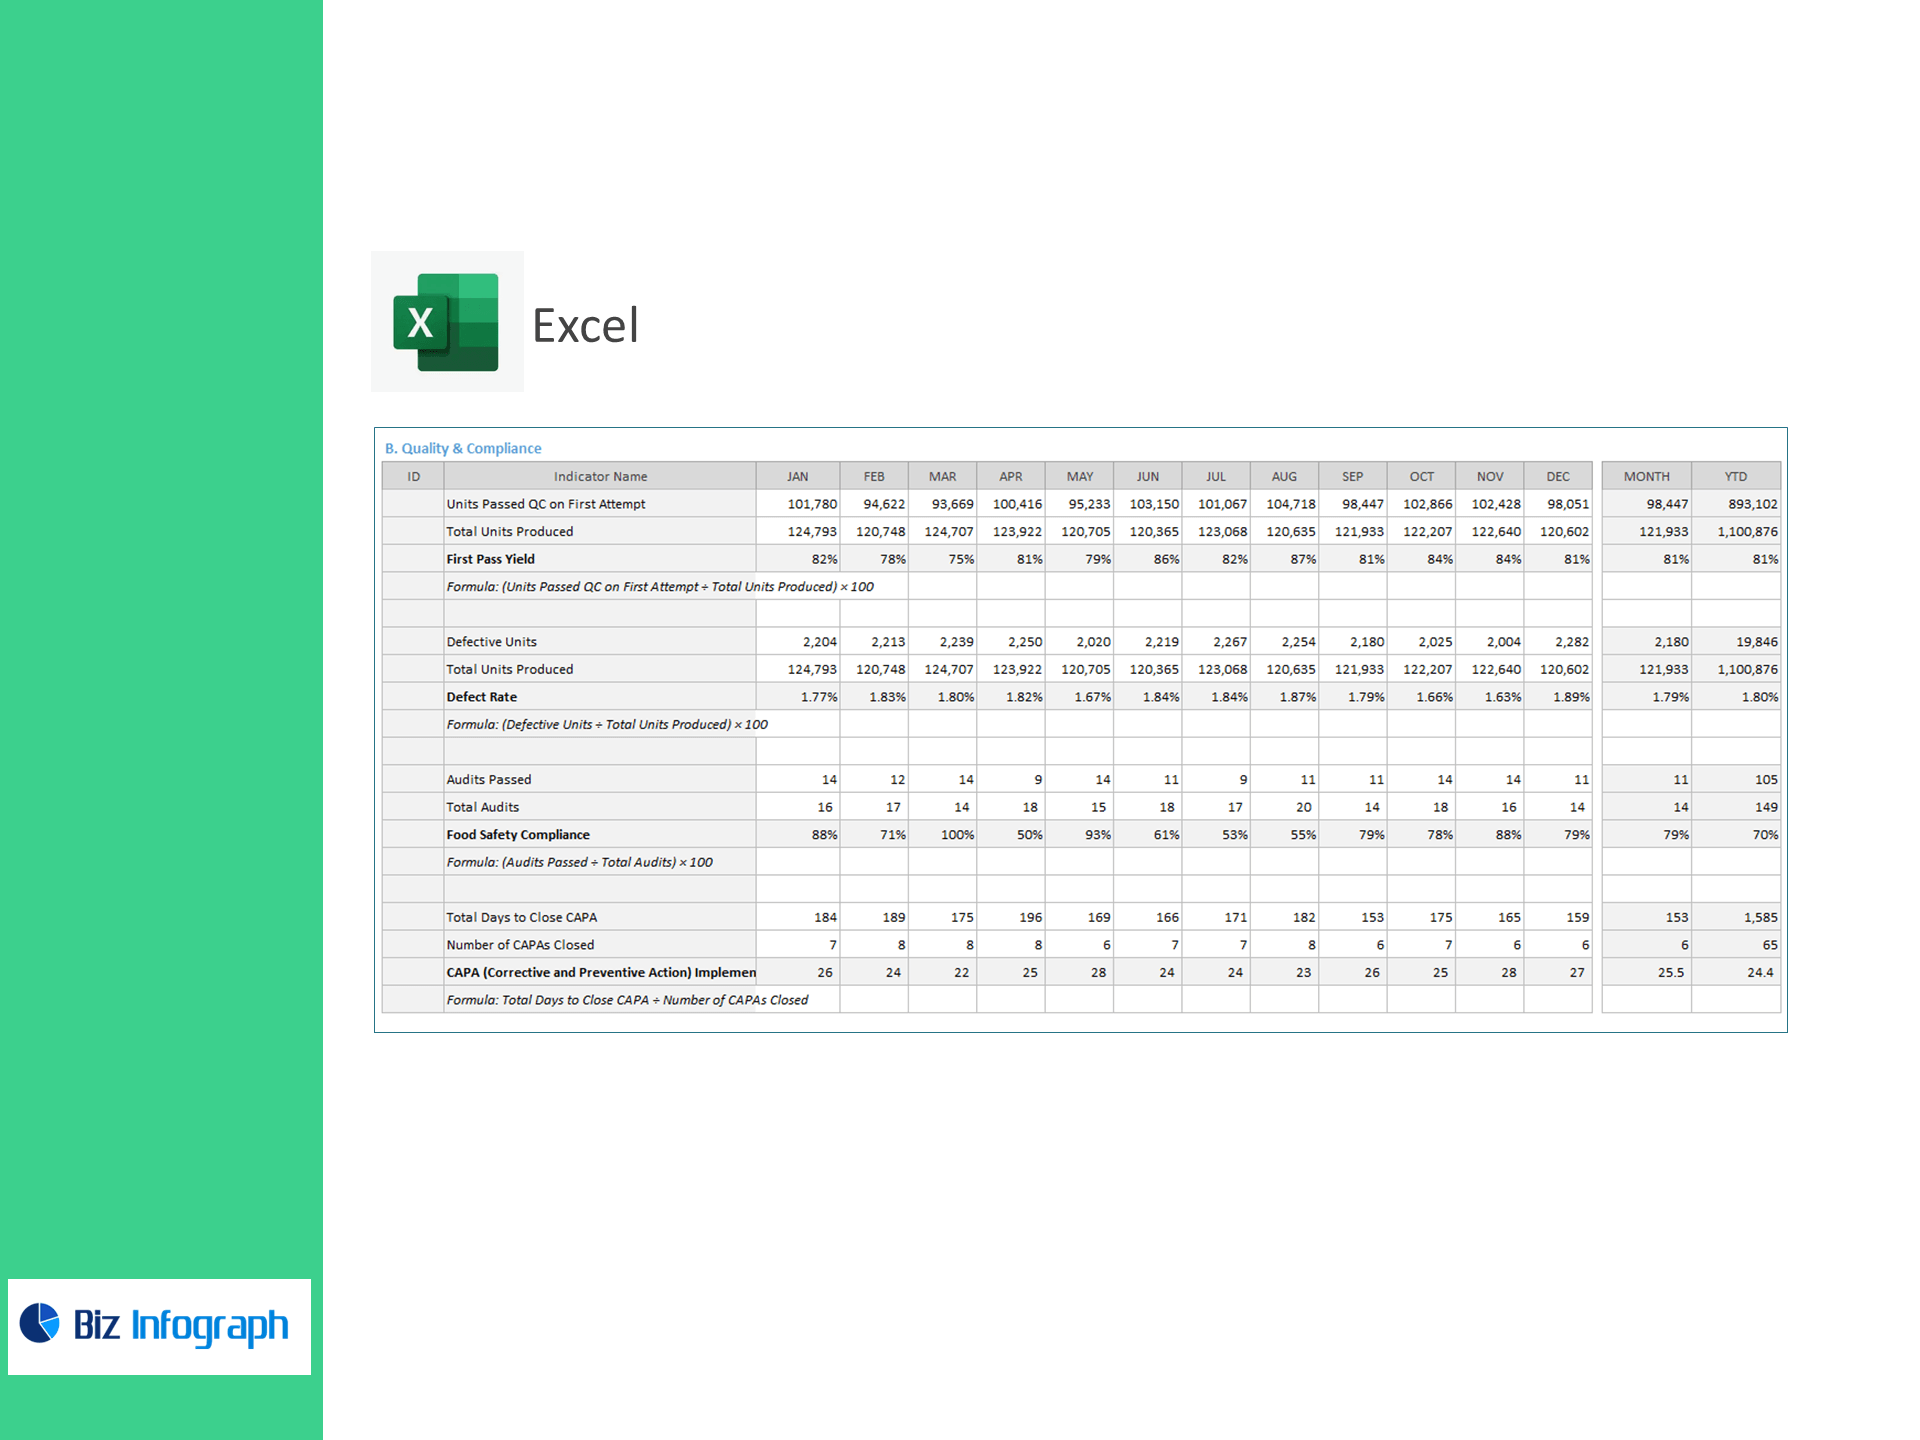
B. Quality & Compliance
-
First Pass Yield (FPY) %
-
Formula:
(Units Passed QC on First Attempt ÷ Total Units Produced) × 100
-
-
Defect Rate %
-
Formula:
(Defective Units ÷ Total Units Produced) × 100
-
-
Food Safety Compliance % (audit pass rate)
-
Formula:
(Audits Passed ÷ Total Audits) × 100
-
-
CAPA Implementation Time (Days)
-
Formula:
Total Days to Close CAPA ÷ Number of CAPAs Closed
-
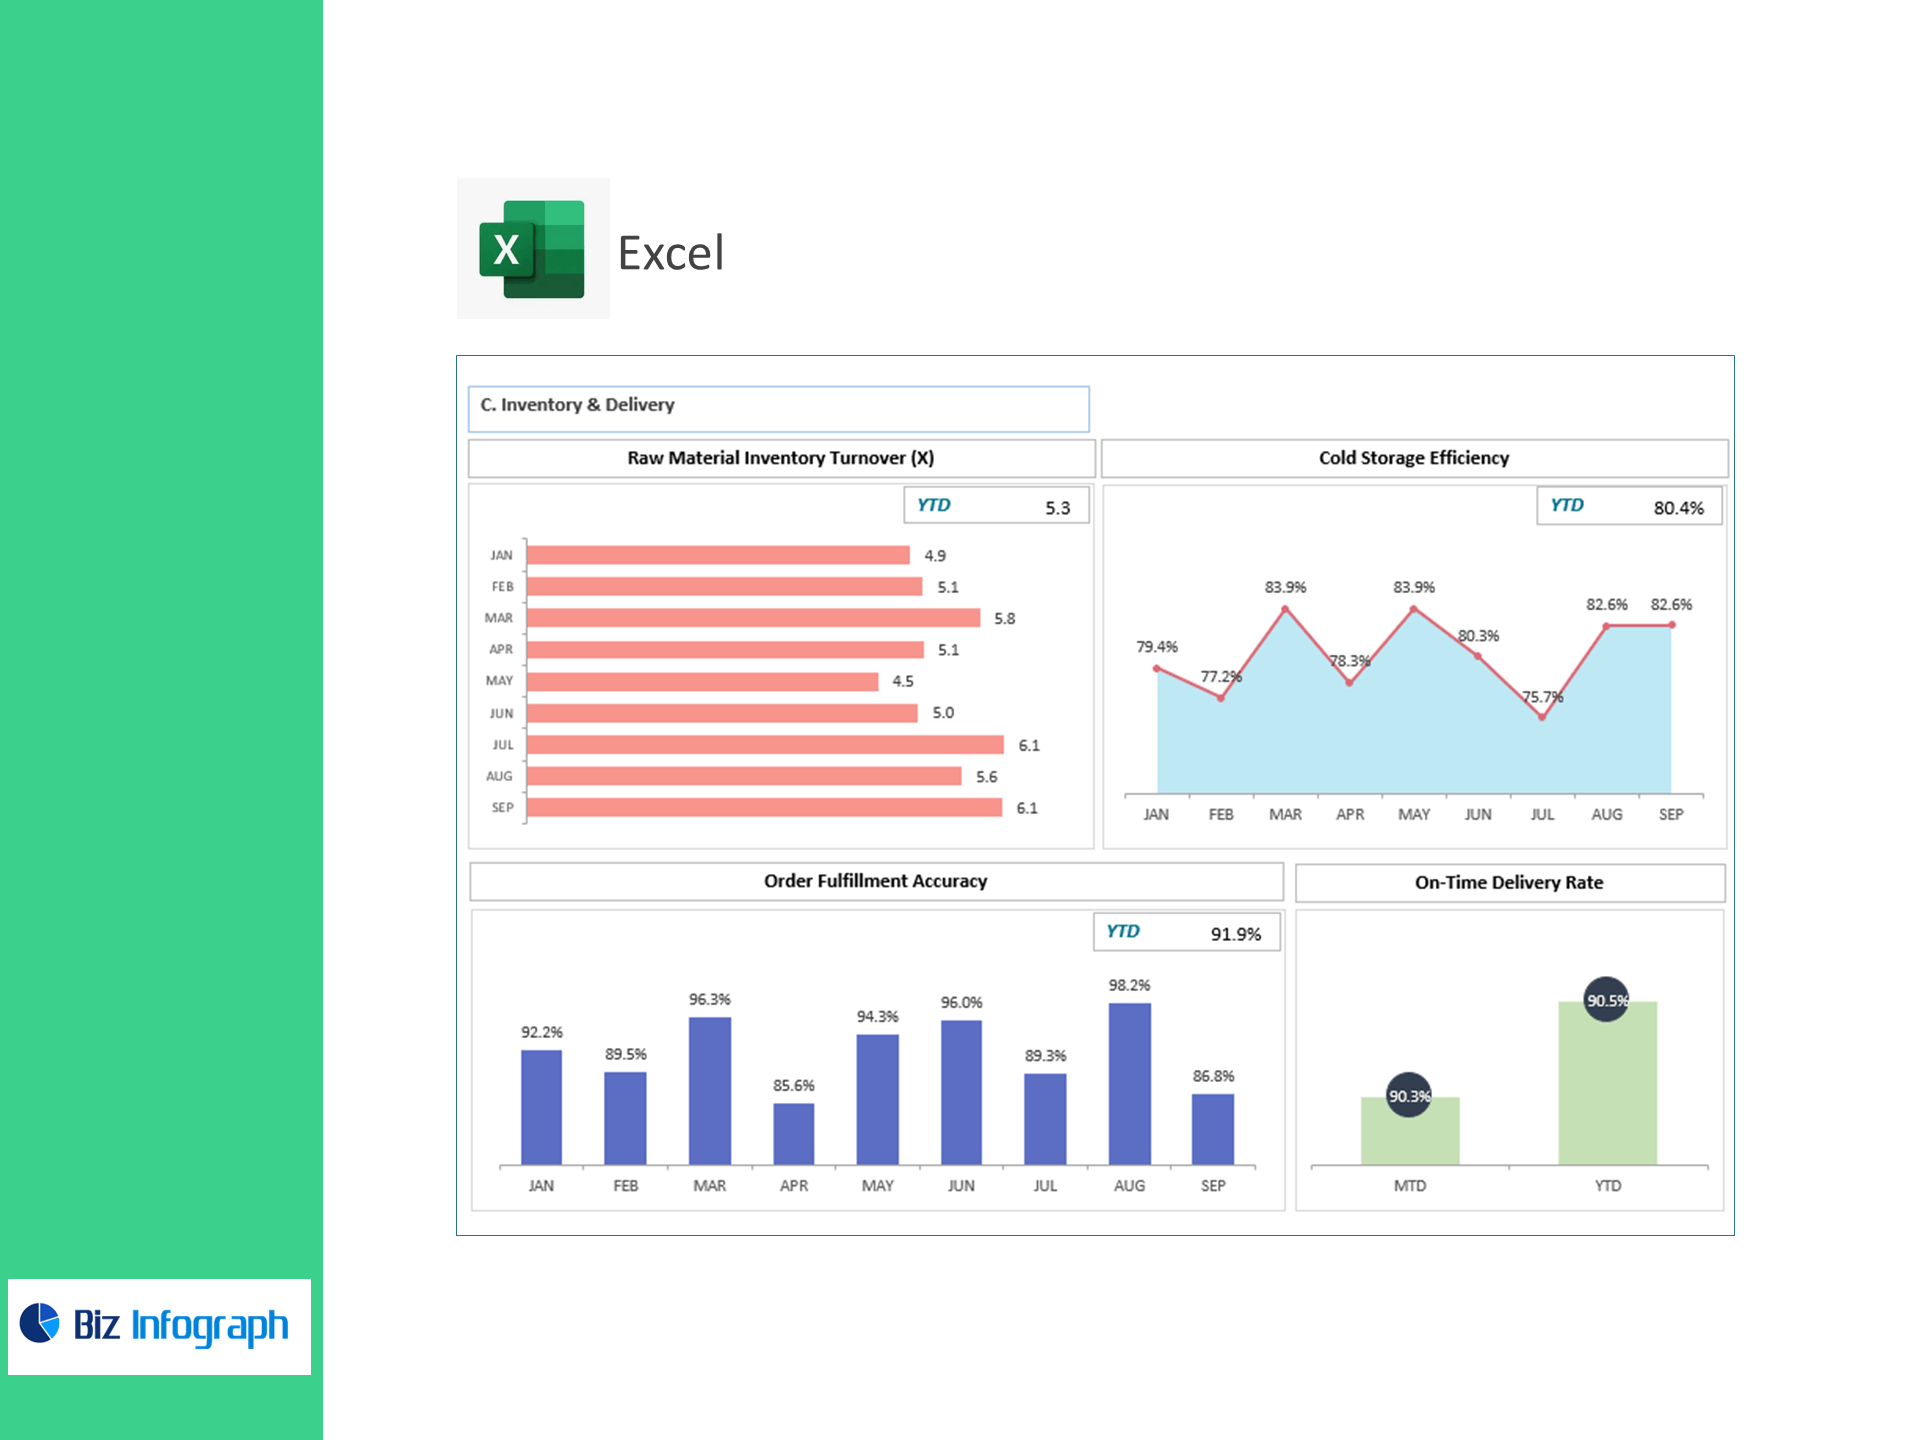
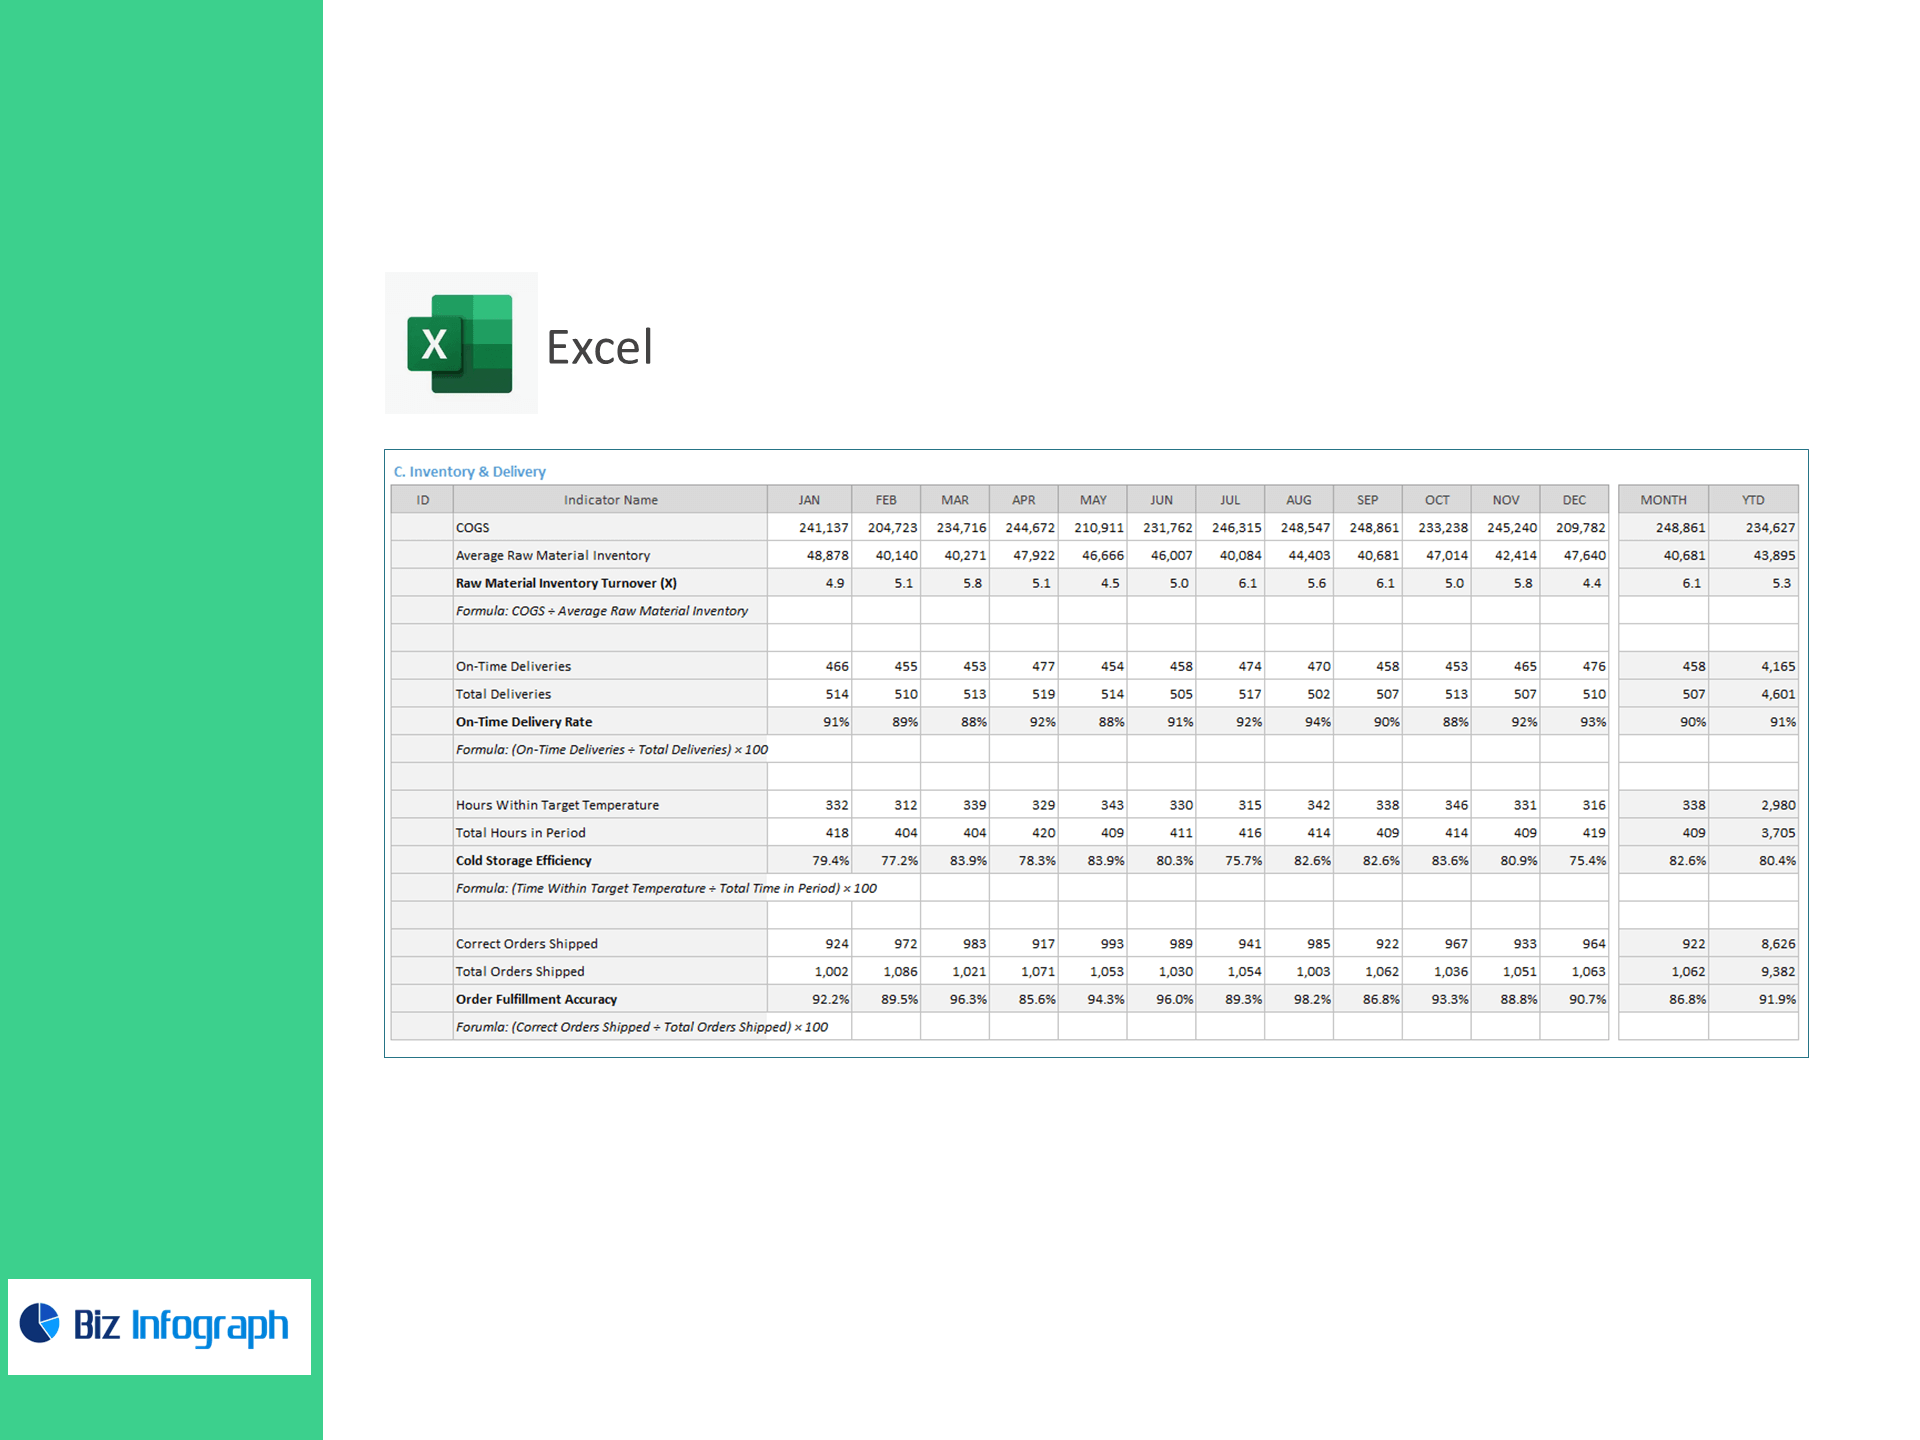
C. Inventory & Delivery
-
Raw Material Inventory Turnover (x)
-
Formula:
COGS ÷ Average Raw Material Inventory
-
-
On-Time Delivery Rate % (to customers)
-
Formula:
(On-Time Deliveries ÷ Total Deliveries) × 100
-
-
Cold Storage Efficiency %
-
Formula:
(Hours Within Target Temperature ÷ Total Hours in Period) × 100
-
-
Order Fulfillment Accuracy %
-
Formula:
(Correct Orders Shipped ÷ Total Orders Shipped) × 100
-
What’s inside
-
Interactive Dashboard: clean visuals for production, quality/compliance, and inventory/delivery.
-
Data Entry Sheet: paste raw monthly numbers; no formulas to edit.
-
KPI Engine: prebuilt calculations (see formulas above) with error checks.
-
Trends & Targets: month-over-month charts, variance to target, red/amber/green status.
-
Supplier & Customer Drilldowns: identify problem lanes quickly.
-
Documentation Tab: metric definitions and how-to steps.
Benefits for food manufacturers
-
Improve throughput: monitor changeover time and machine utilization to unlock hidden capacity.
-
Reduce losses: track FPY and defect rate to cut rework, scrap, and hold/release costs.
-
Strengthen compliance: keep audit pass rate and CAPA closure time on target.
-
Protect the cold chain: watch temperature-within-target hours across the period.
-
Deliver reliably: raise on-time delivery and order accuracy for happier customers.
For ready-to-use Dashboard Templates: