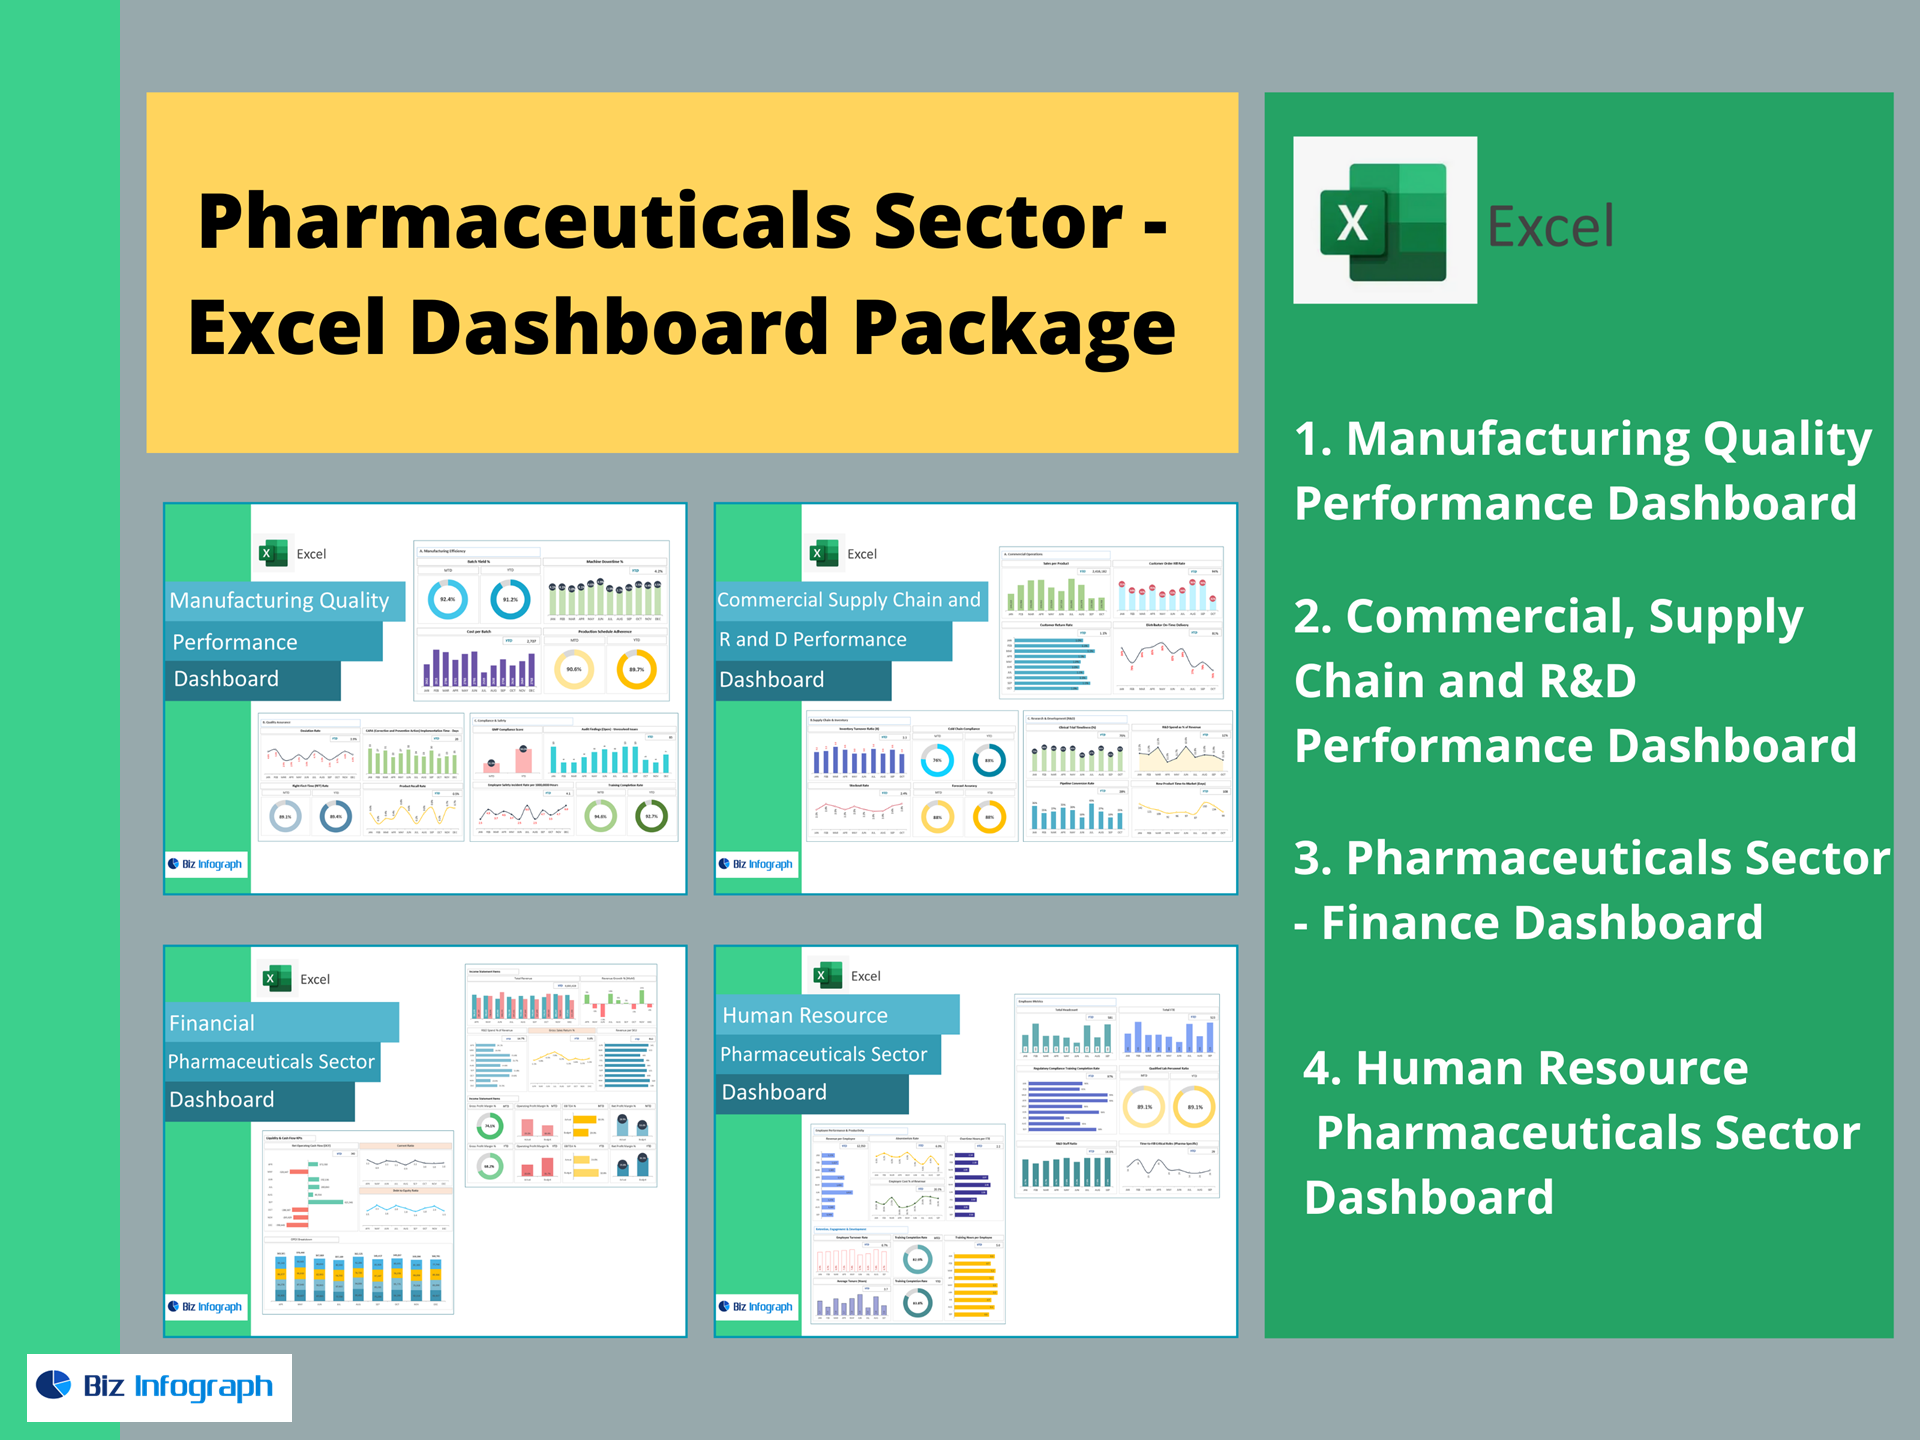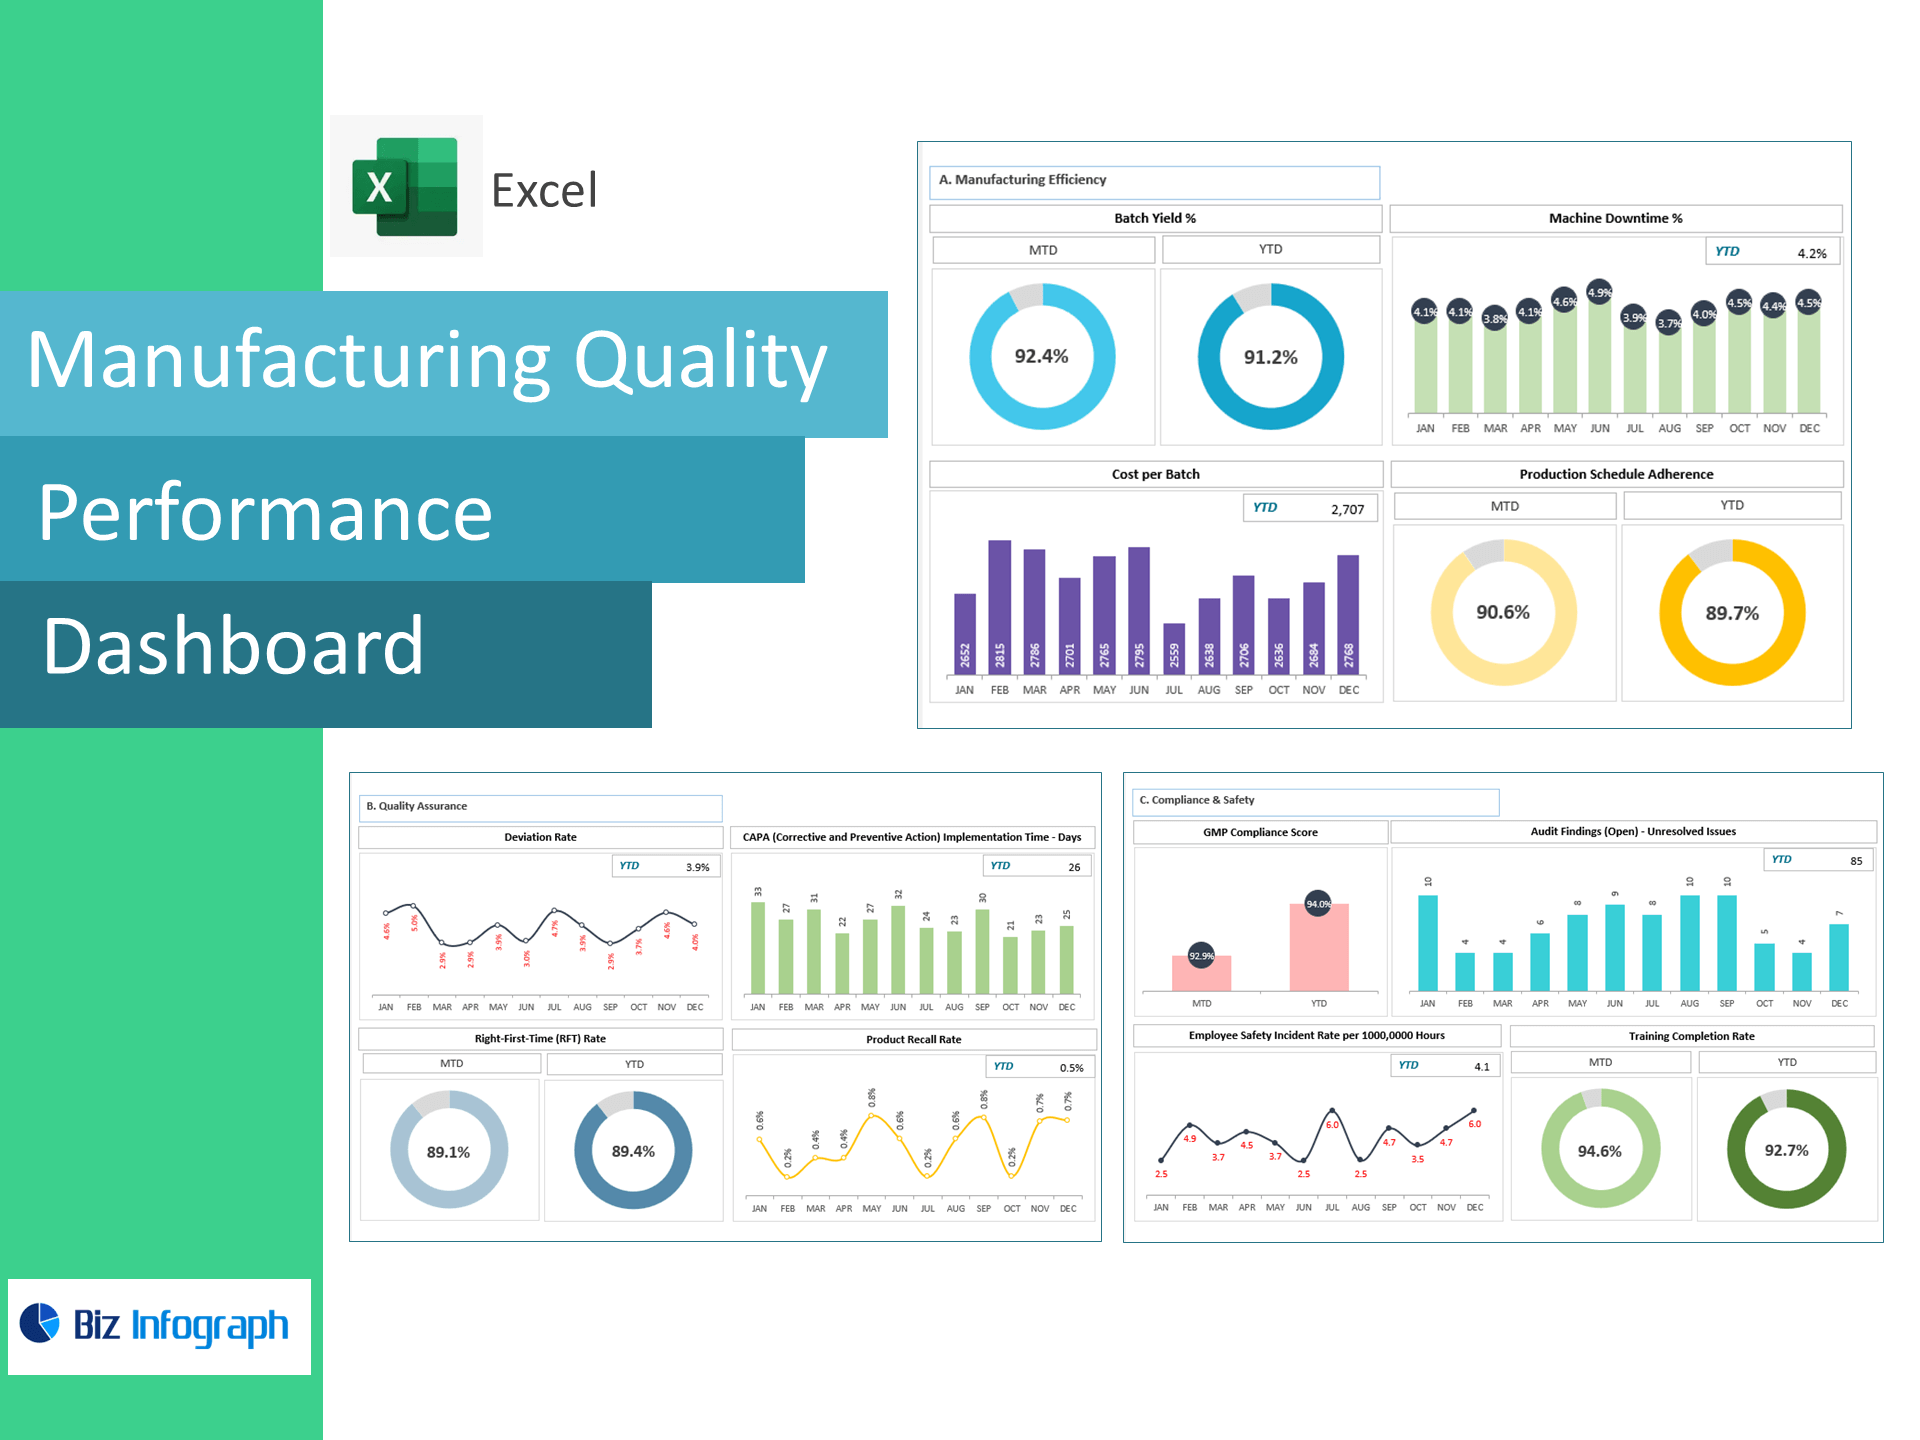
Manufacturing Quality Performance Dashboard — Excel Template
Elevate your shop-floor decisions with a ready-to-use Excel dashboard built for manufacturing operations, quality, and EHS teams. Track yield, deviations, RFT, CAPA, recalls, audits, downtime, and safety in one place—no macros required, fully editable.
KPI Coverage (out of the box)
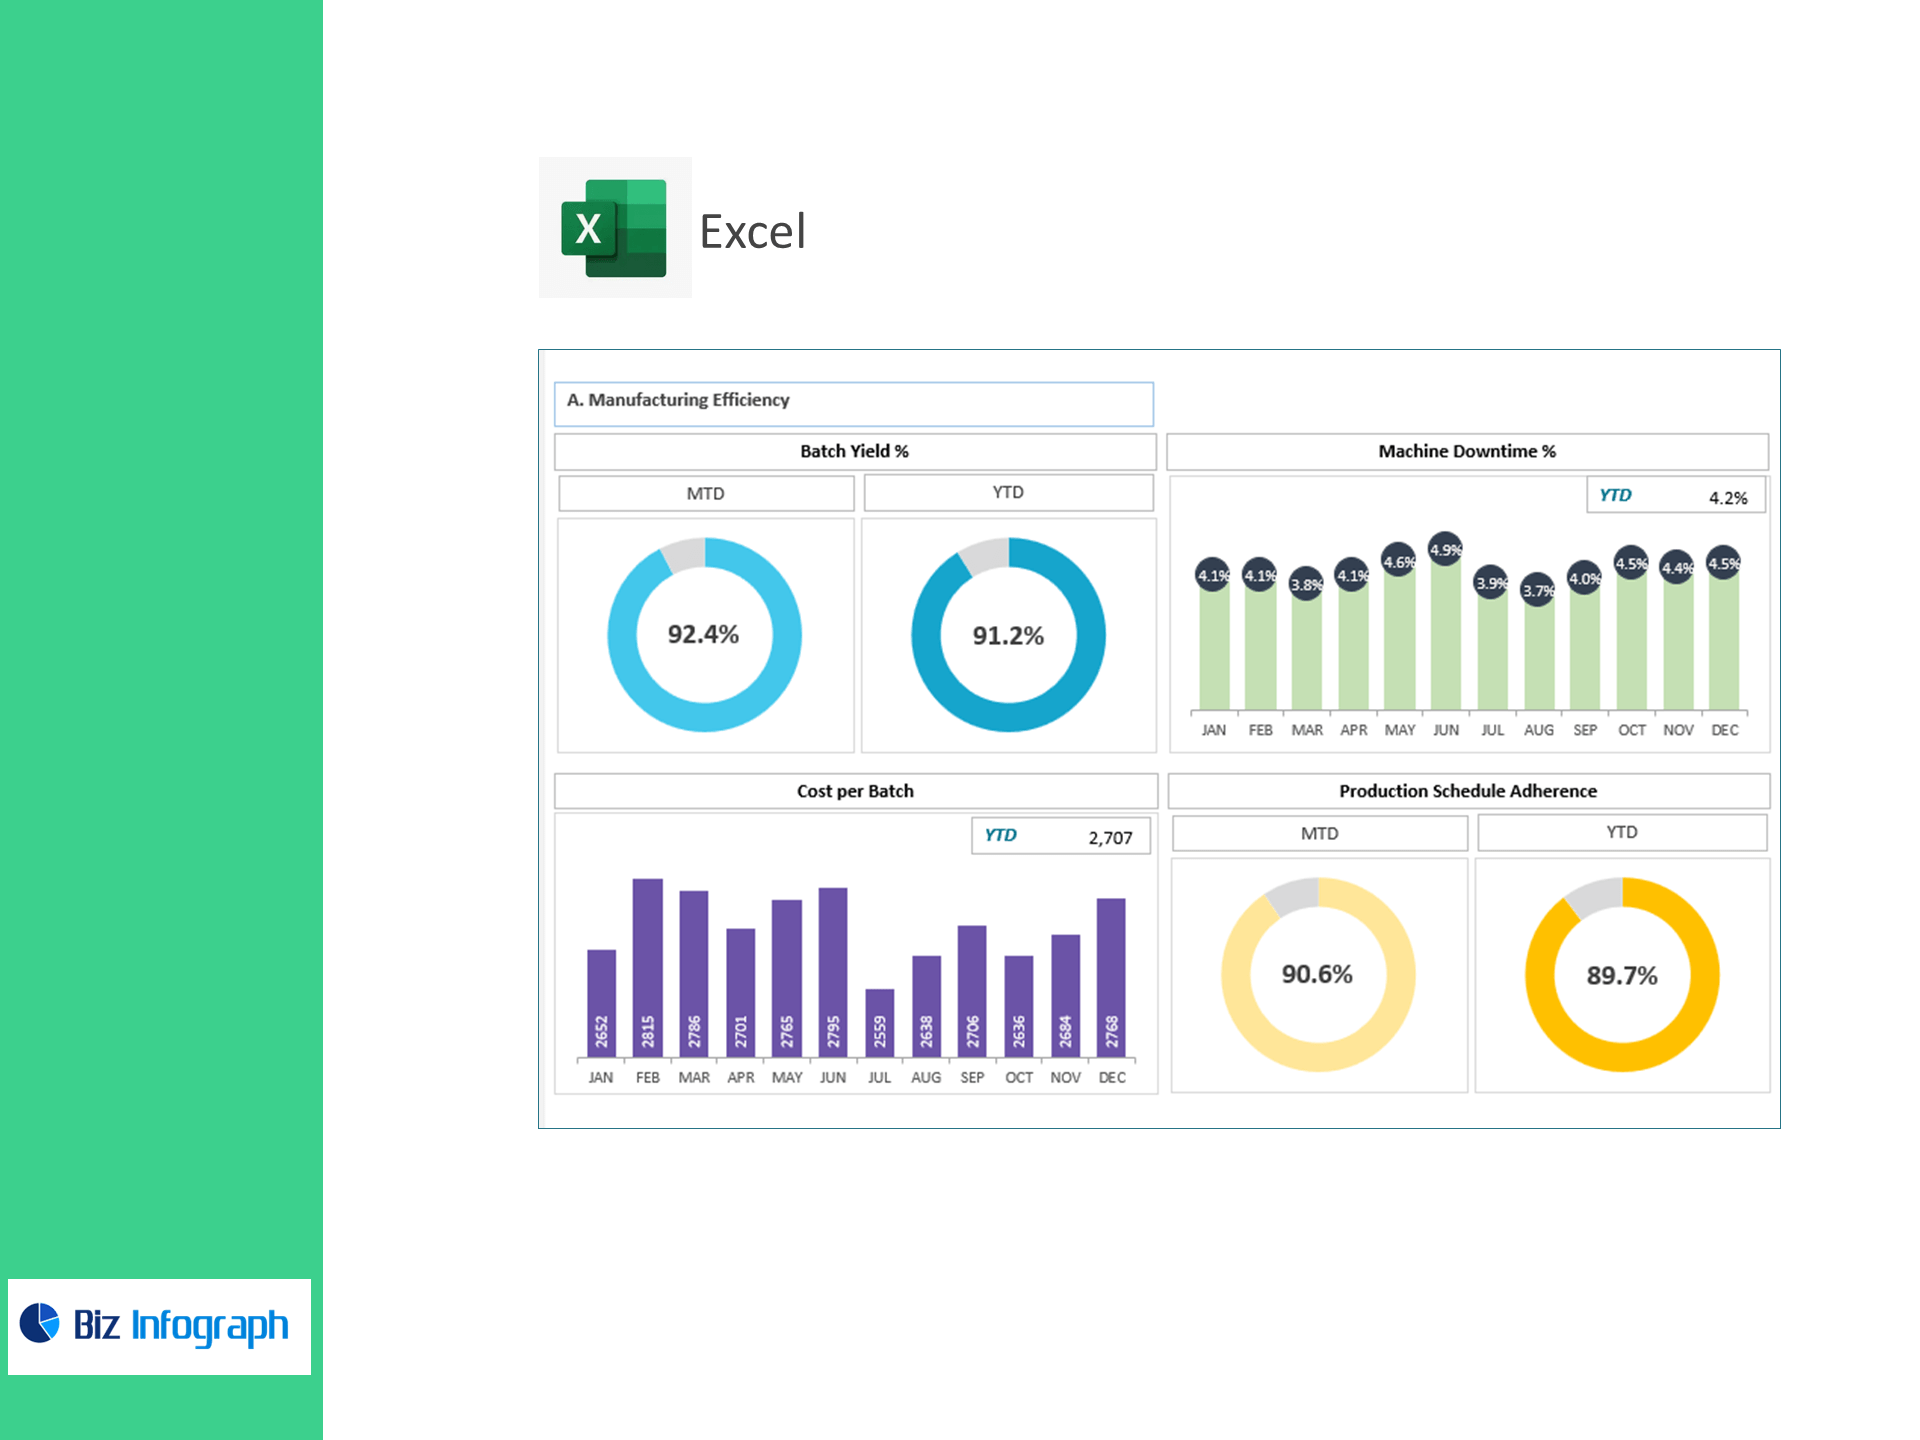
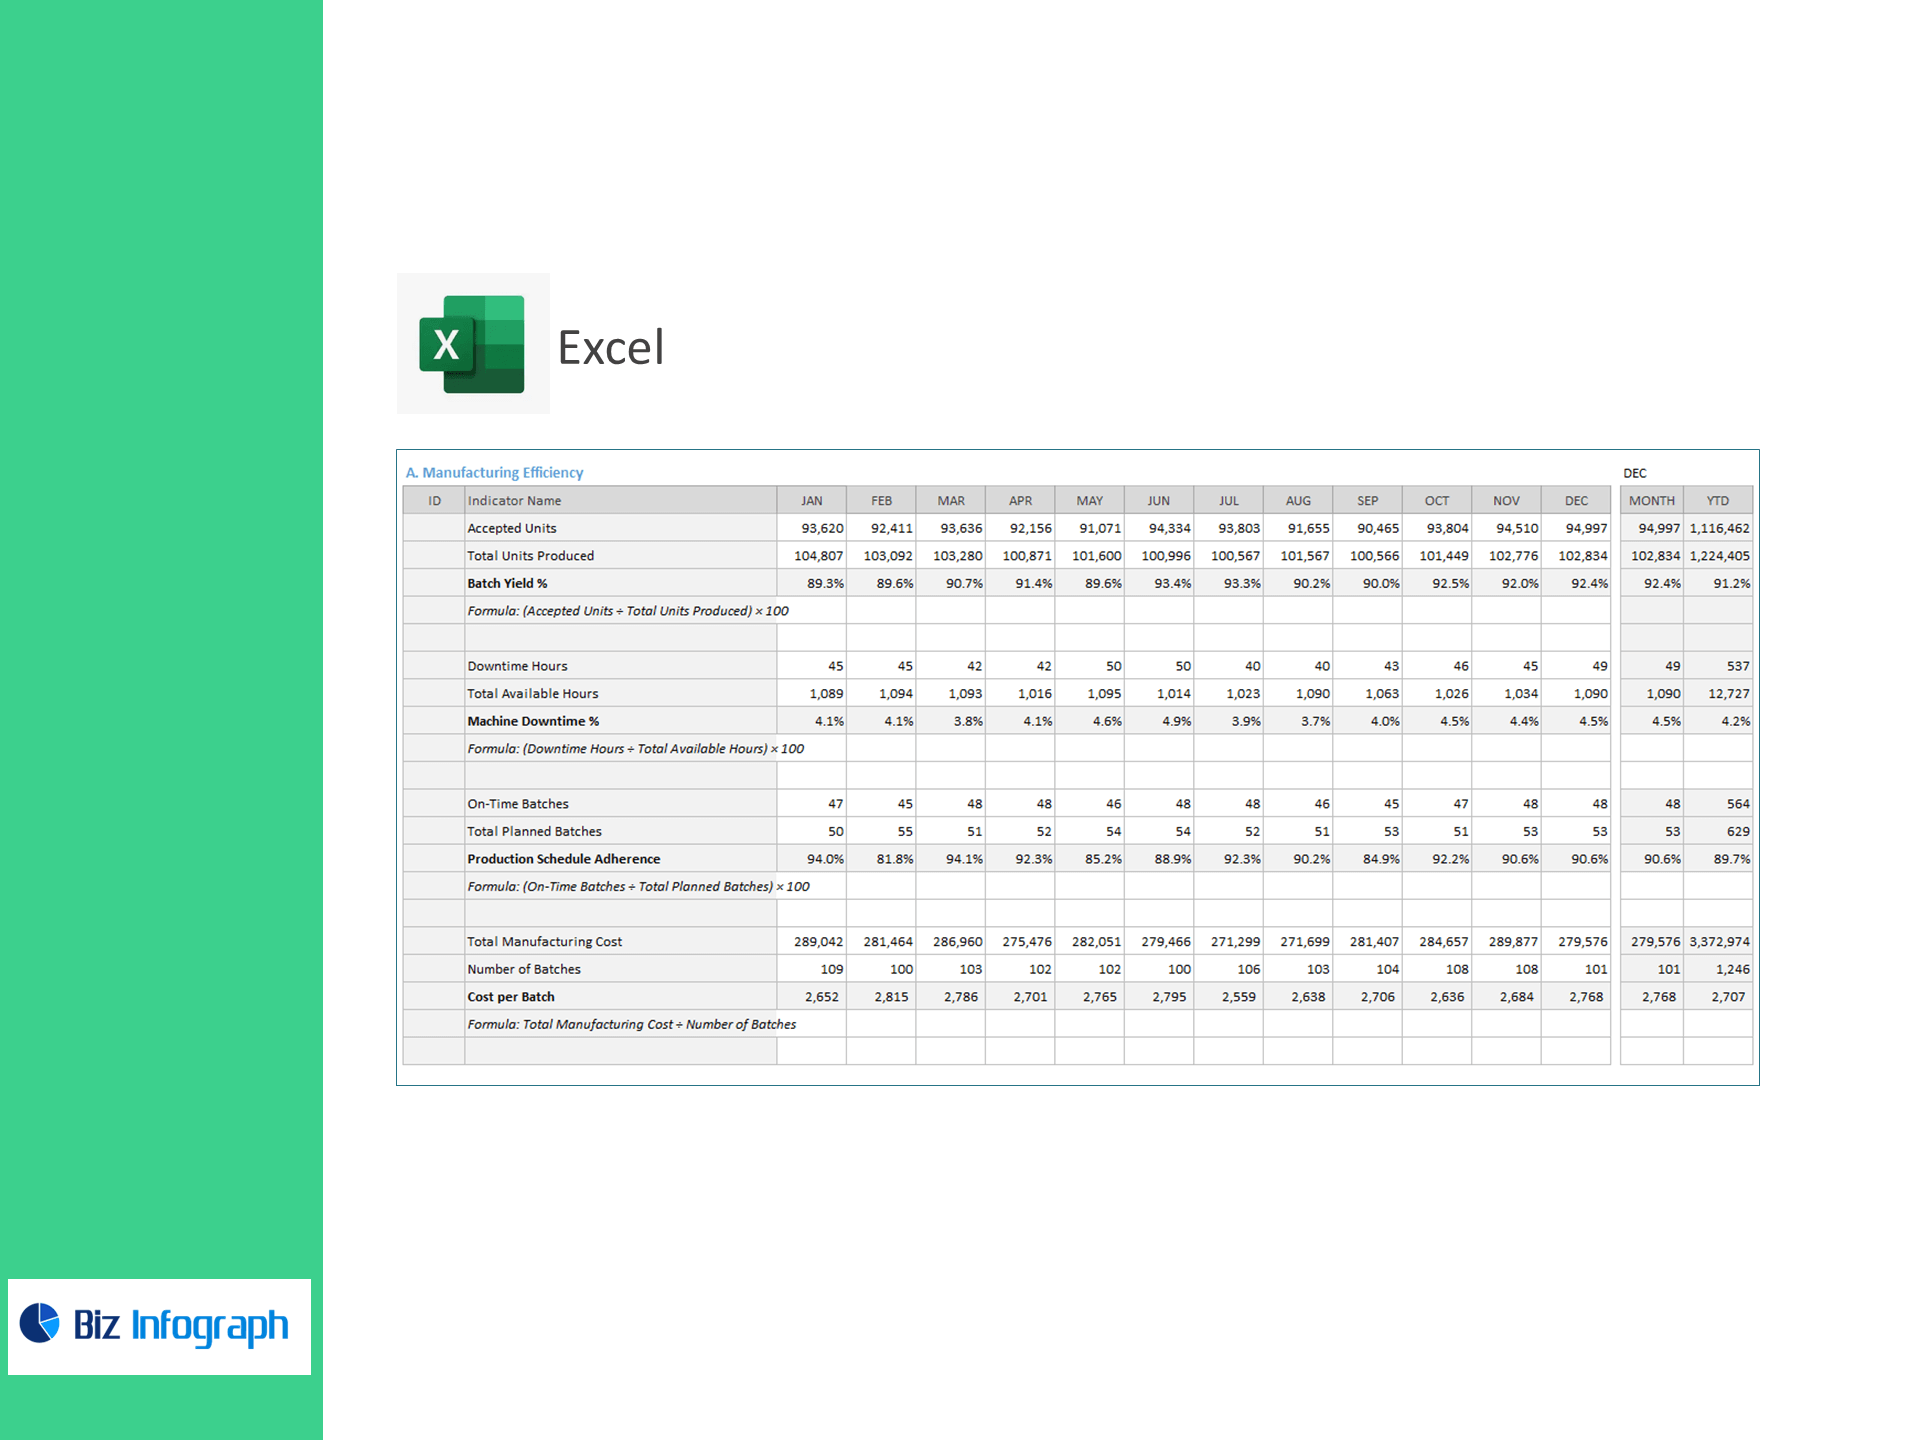
Manufacturing Efficiency
-
Batch Yield % (Accepted Units ÷ Total Units Produced)
-
Machine Downtime % (Downtime Hours ÷ Available Hours)
-
Production Schedule Adherence (On-Time Batches ÷ Planned Batches)
-
Cost per Batch (Total Manufacturing Cost ÷ Number of Batches)
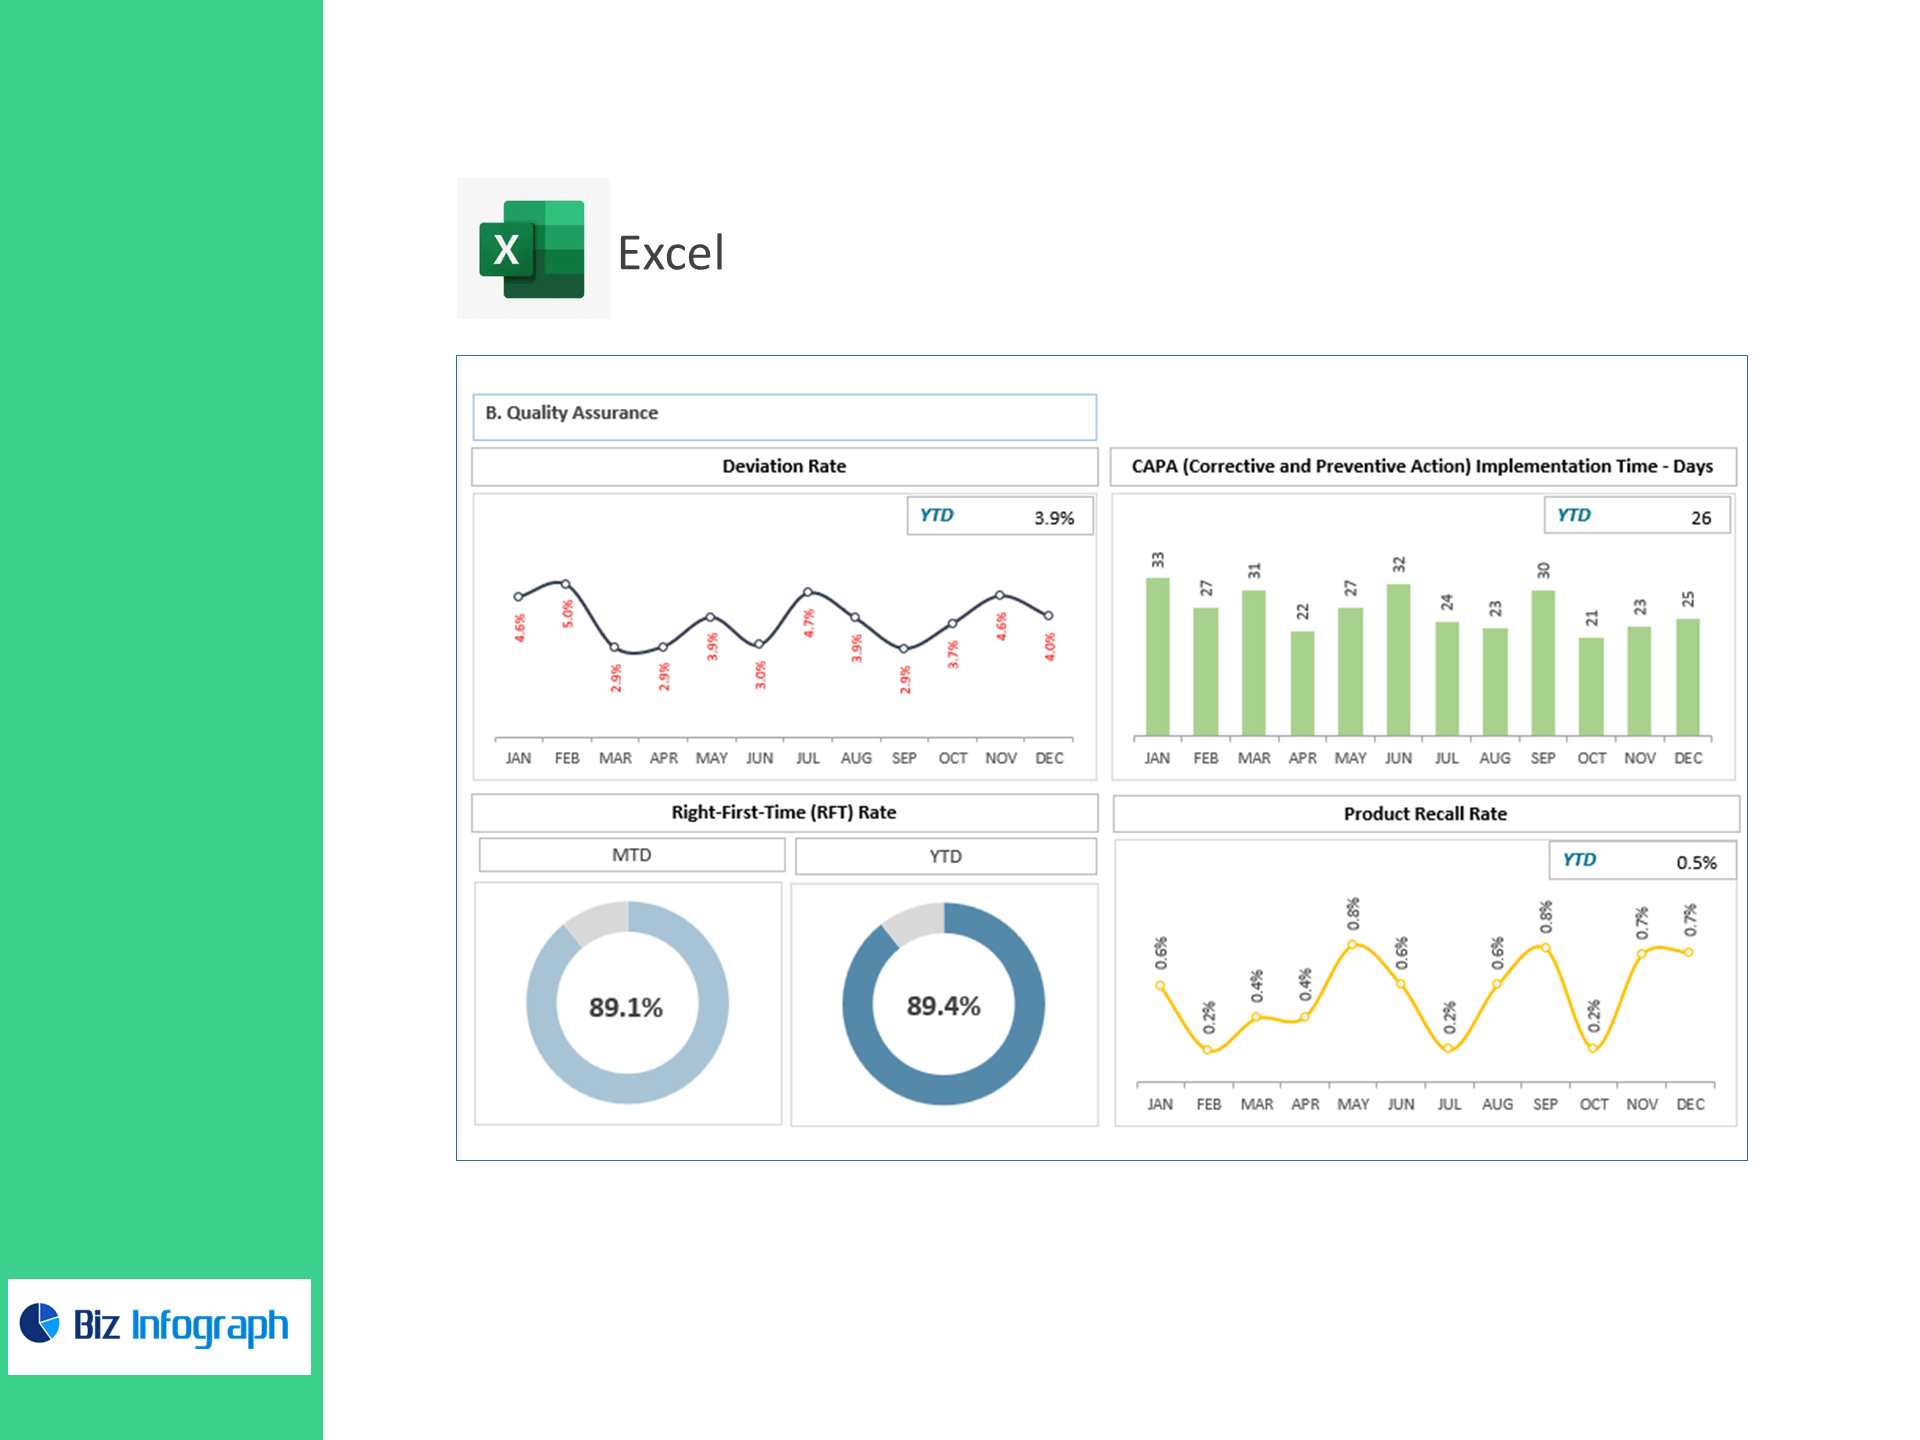
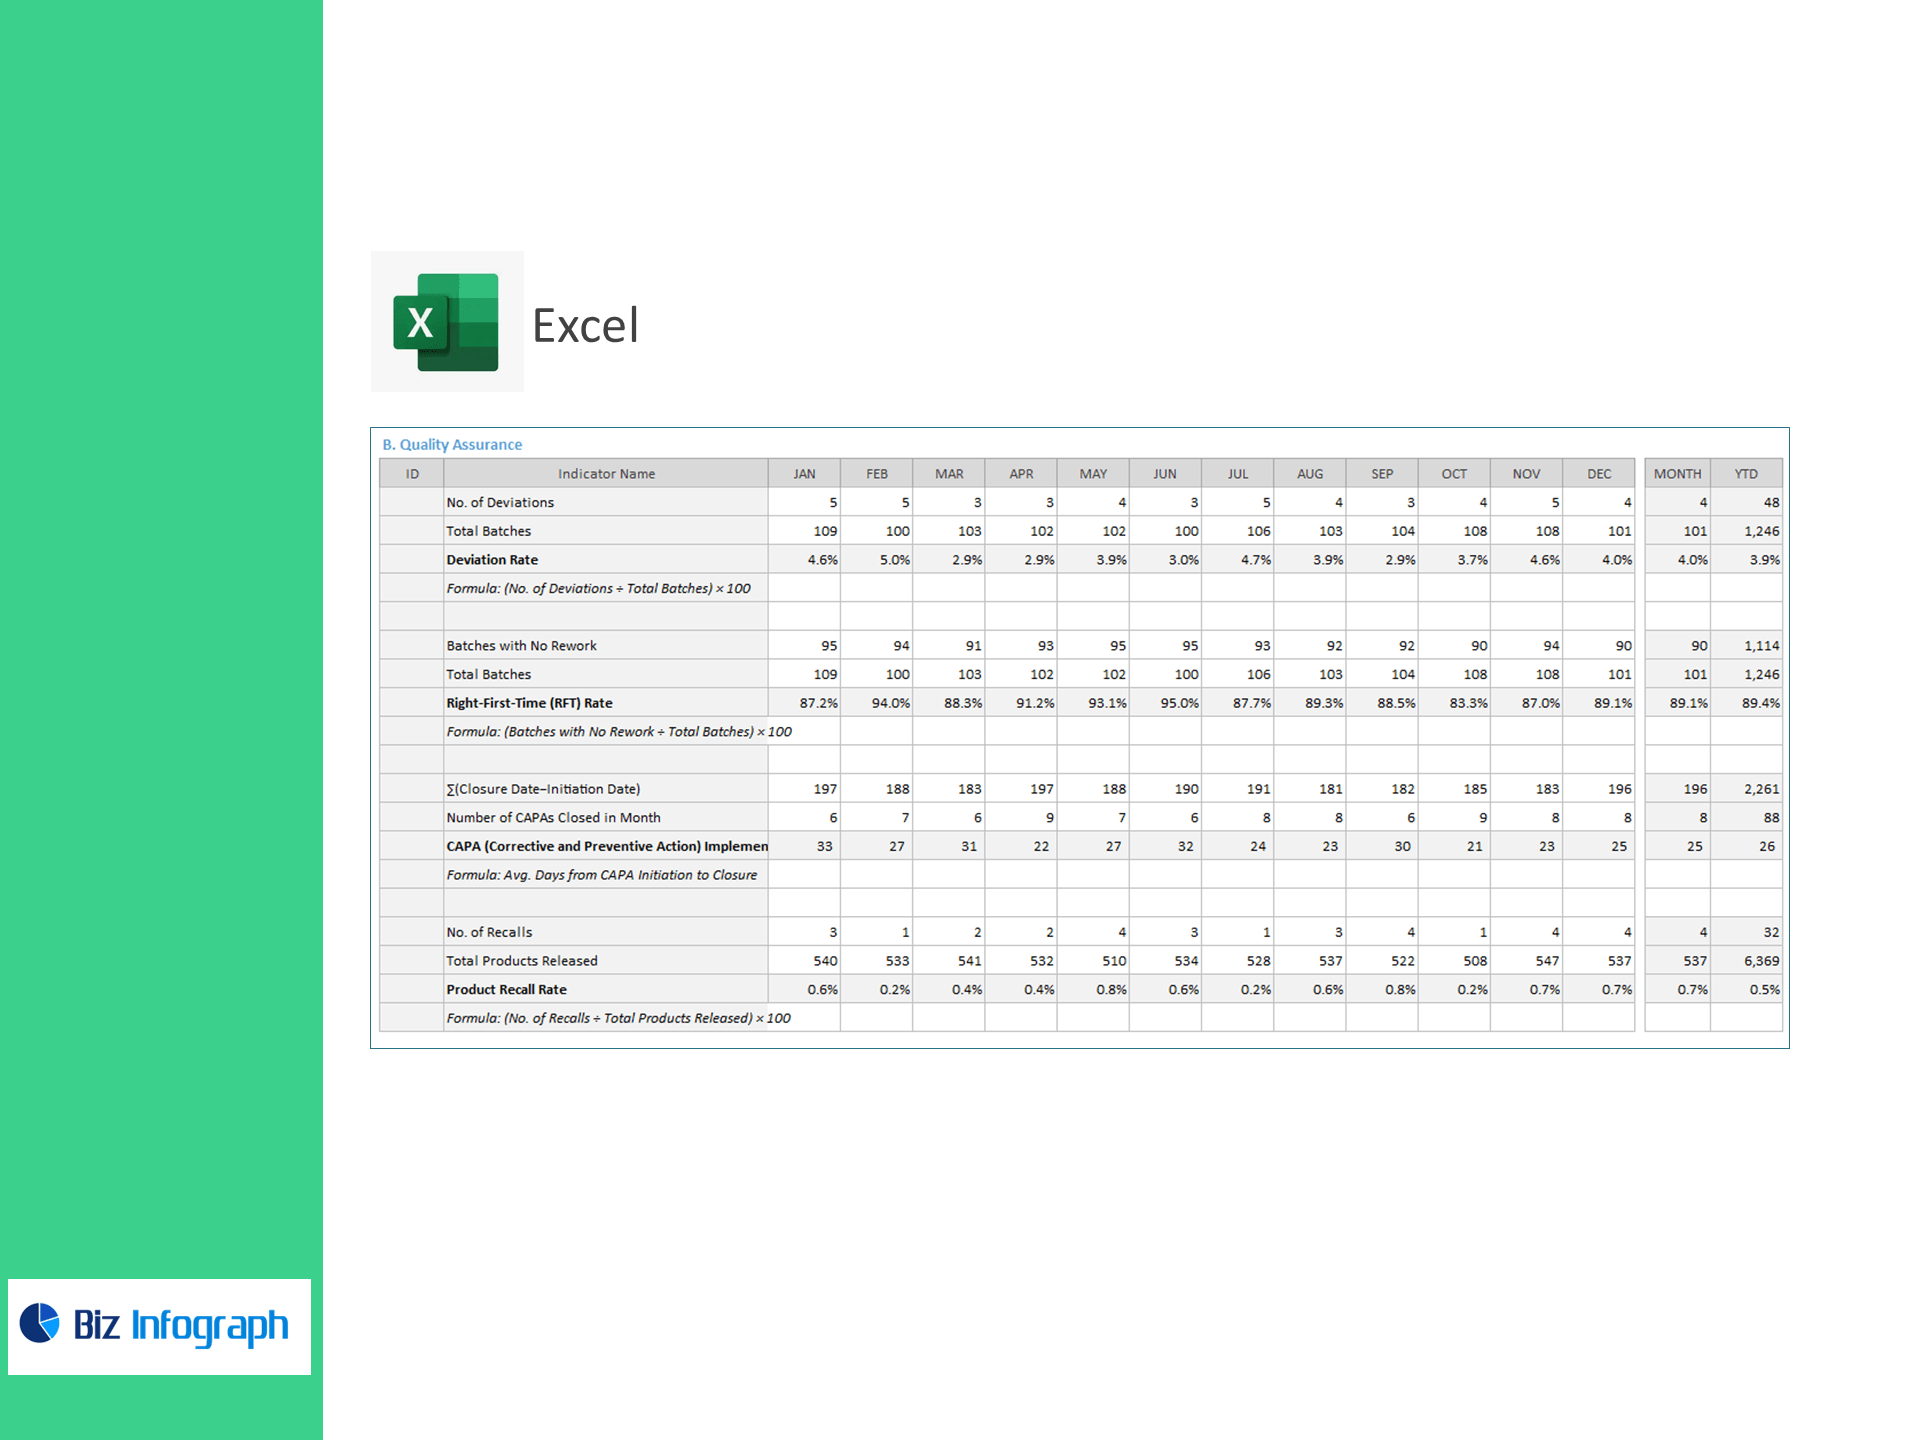
Quality Assurance
-
Deviation Rate (Deviations ÷ Total Batches)
-
Right-First-Time (RFT) Rate (Batches with No Rework ÷ Total Batches)
-
CAPA Implementation Time (days) — initiation to closure
-
Product Recall Rate (Recalls ÷ Products Released)
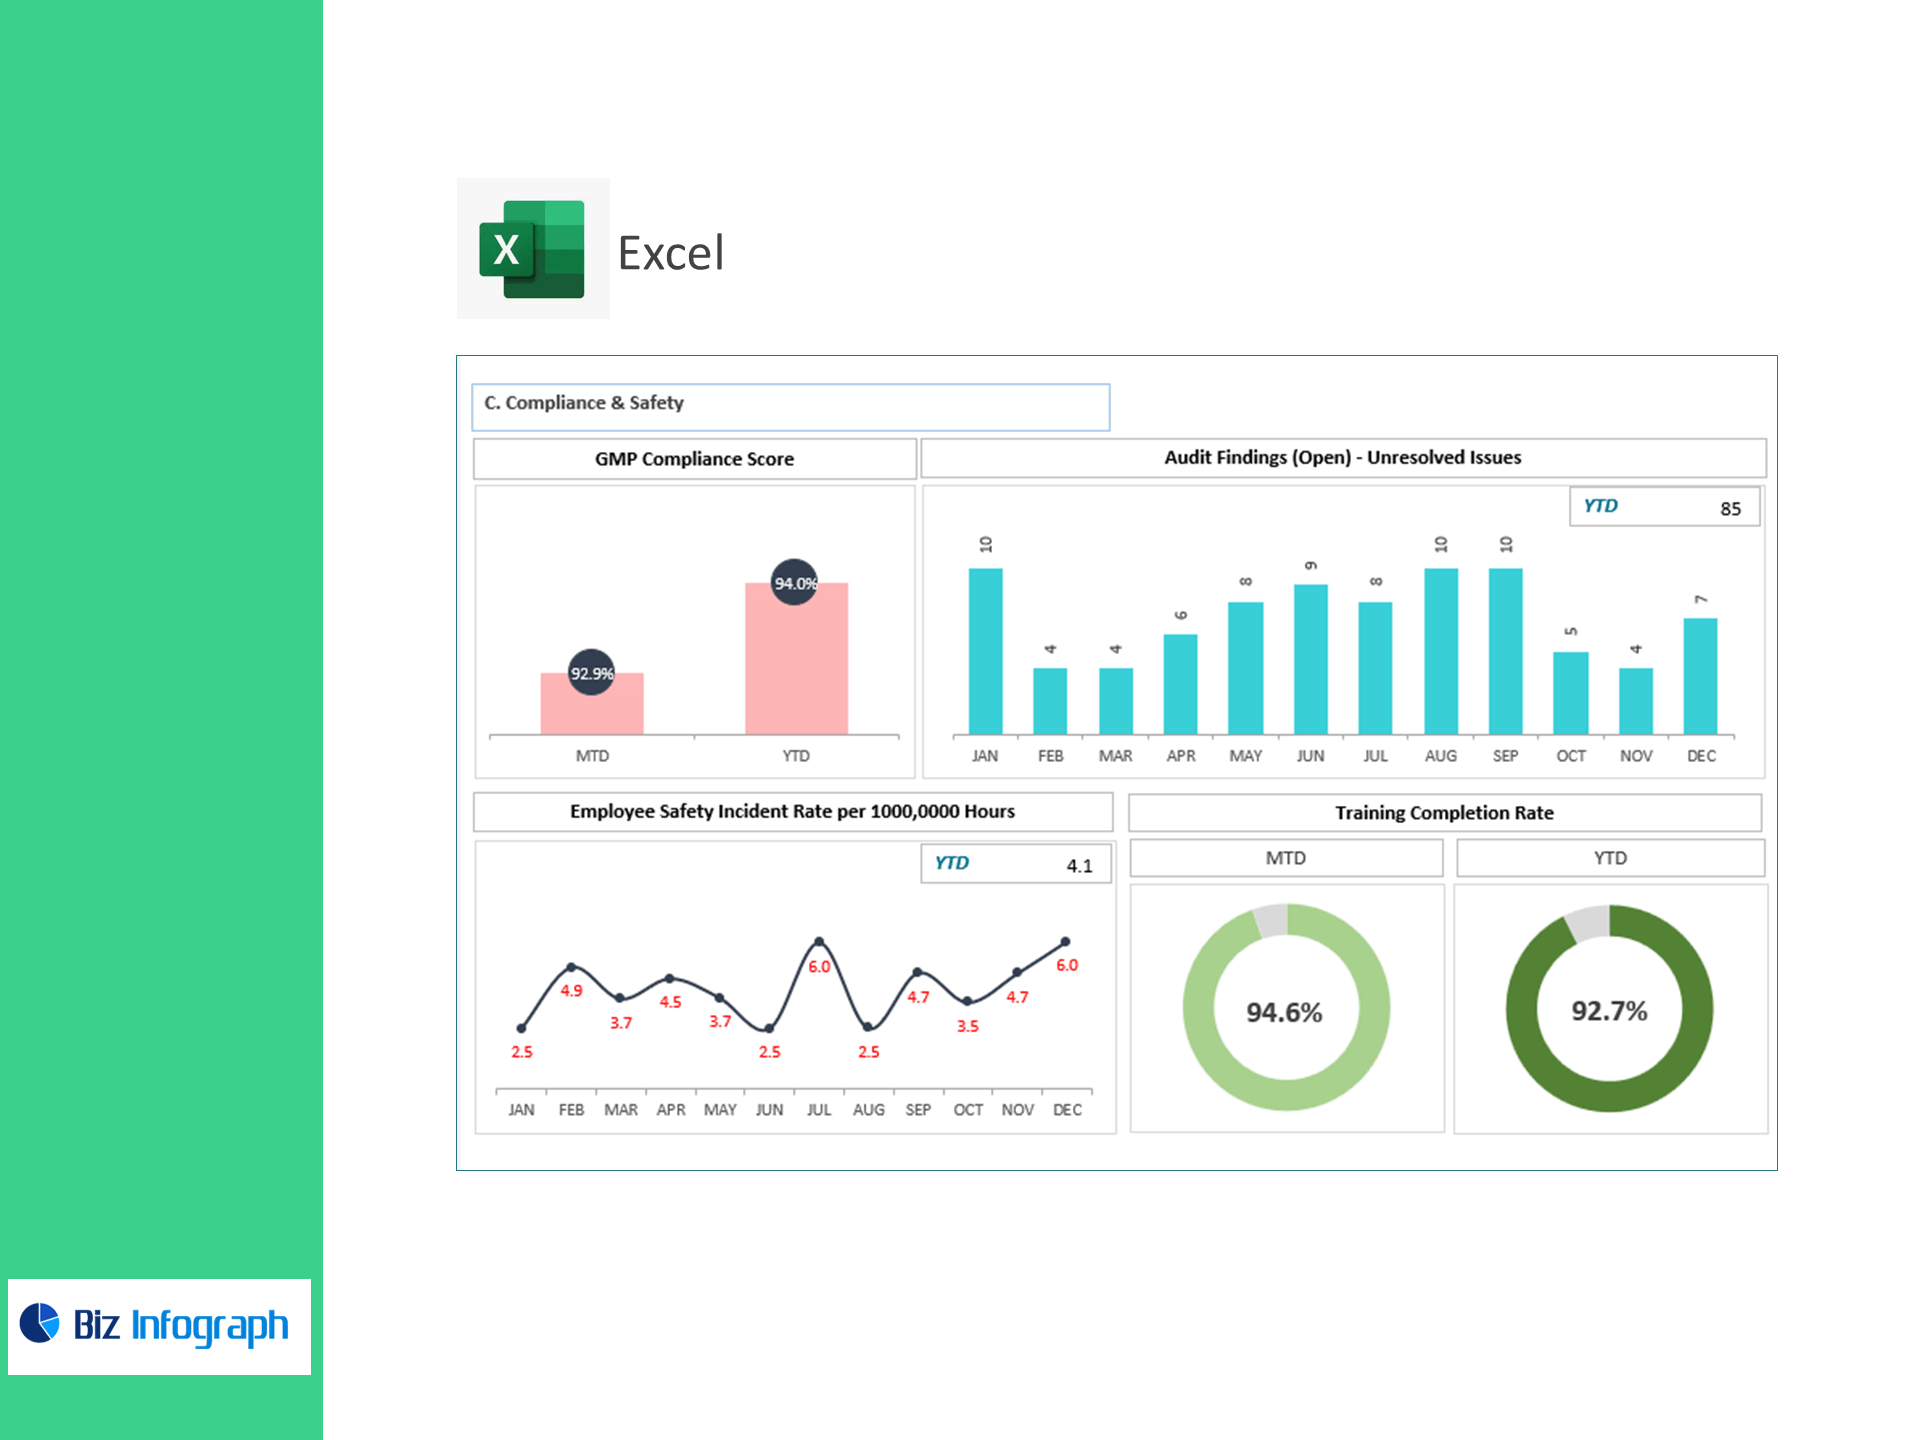
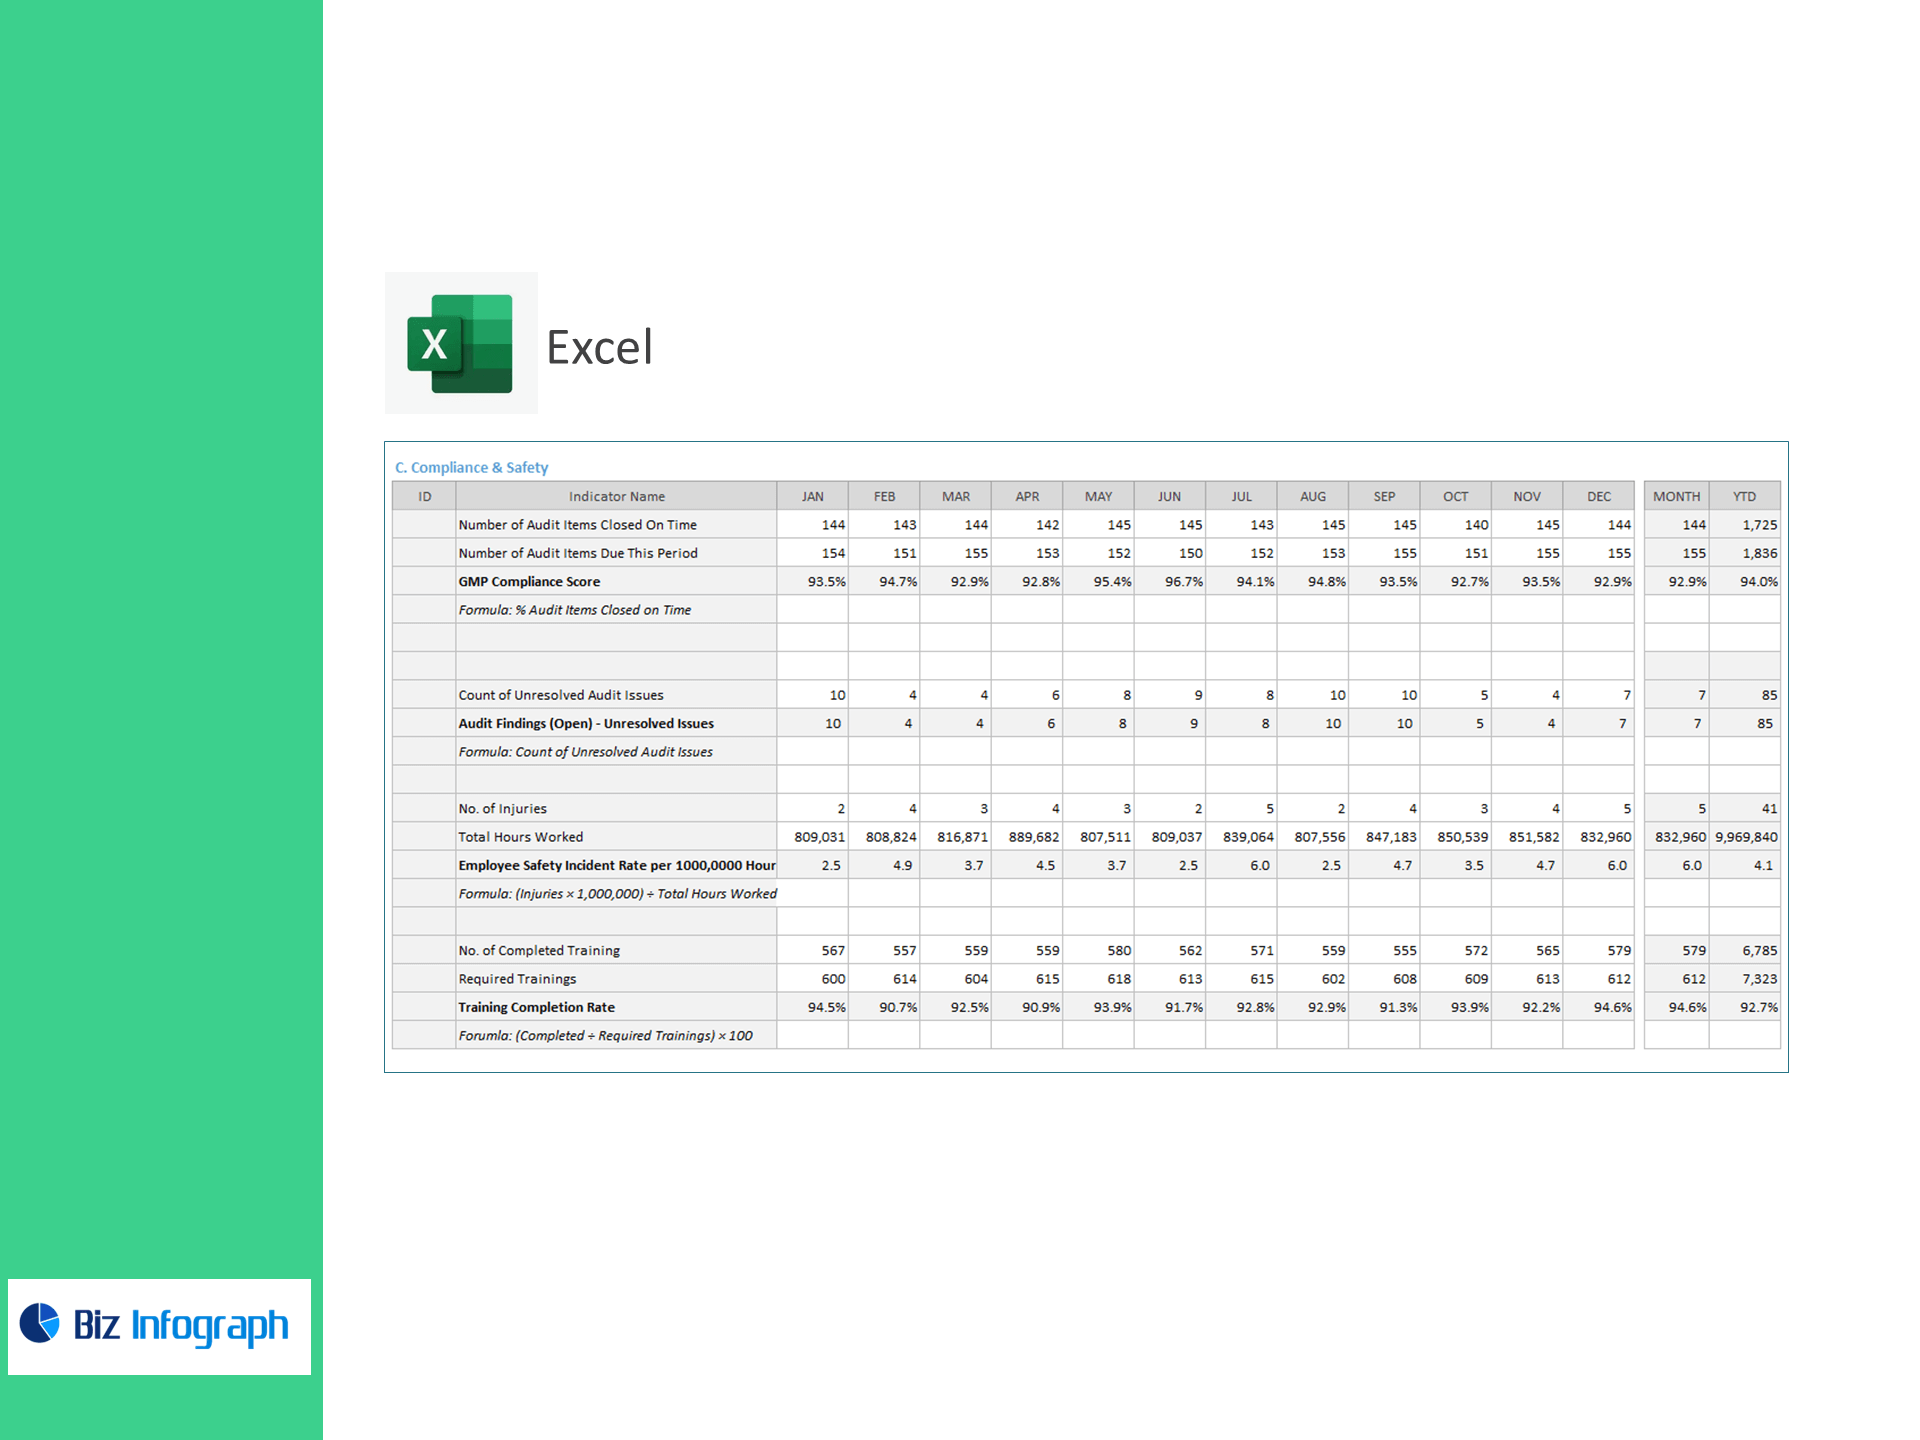
Compliance & Safety
-
GMP Compliance Score (% audit items closed on time)
-
Audit Findings (Open) — unresolved issues at period end
-
Employee Safety Incident Rate per 1,000,000 hours
-
Training Completion Rate (Completed ÷ Required trainings)
What you get
-
Interactive Excel workbook with KPI cards, trend charts, Pareto & variance views
-
Slicers for plant, line, product, batch type, month/quarter
-
Data tabs for easy paste from MES/LIMS/QMS/EHS systems (CSV/XLSX)
-
Thresholds & RAG alerts for deviations, downtime, CAPA aging, and audit closures
-
Clean exports to PDF/PPT for monthly quality reviews and audits
-
Works with Excel 365/2021 (Windows & Mac)
Perfect for
-
Quality & Operations leaders needing GMP-ready reporting
-
Plant managers tracking throughput vs. cost per batch
-
EHS & Training teams monitoring incident and compliance KPIs
-
CI/Lean practitioners running CAPA and RFT improvements
For ready-to-use Dashboard Templates: