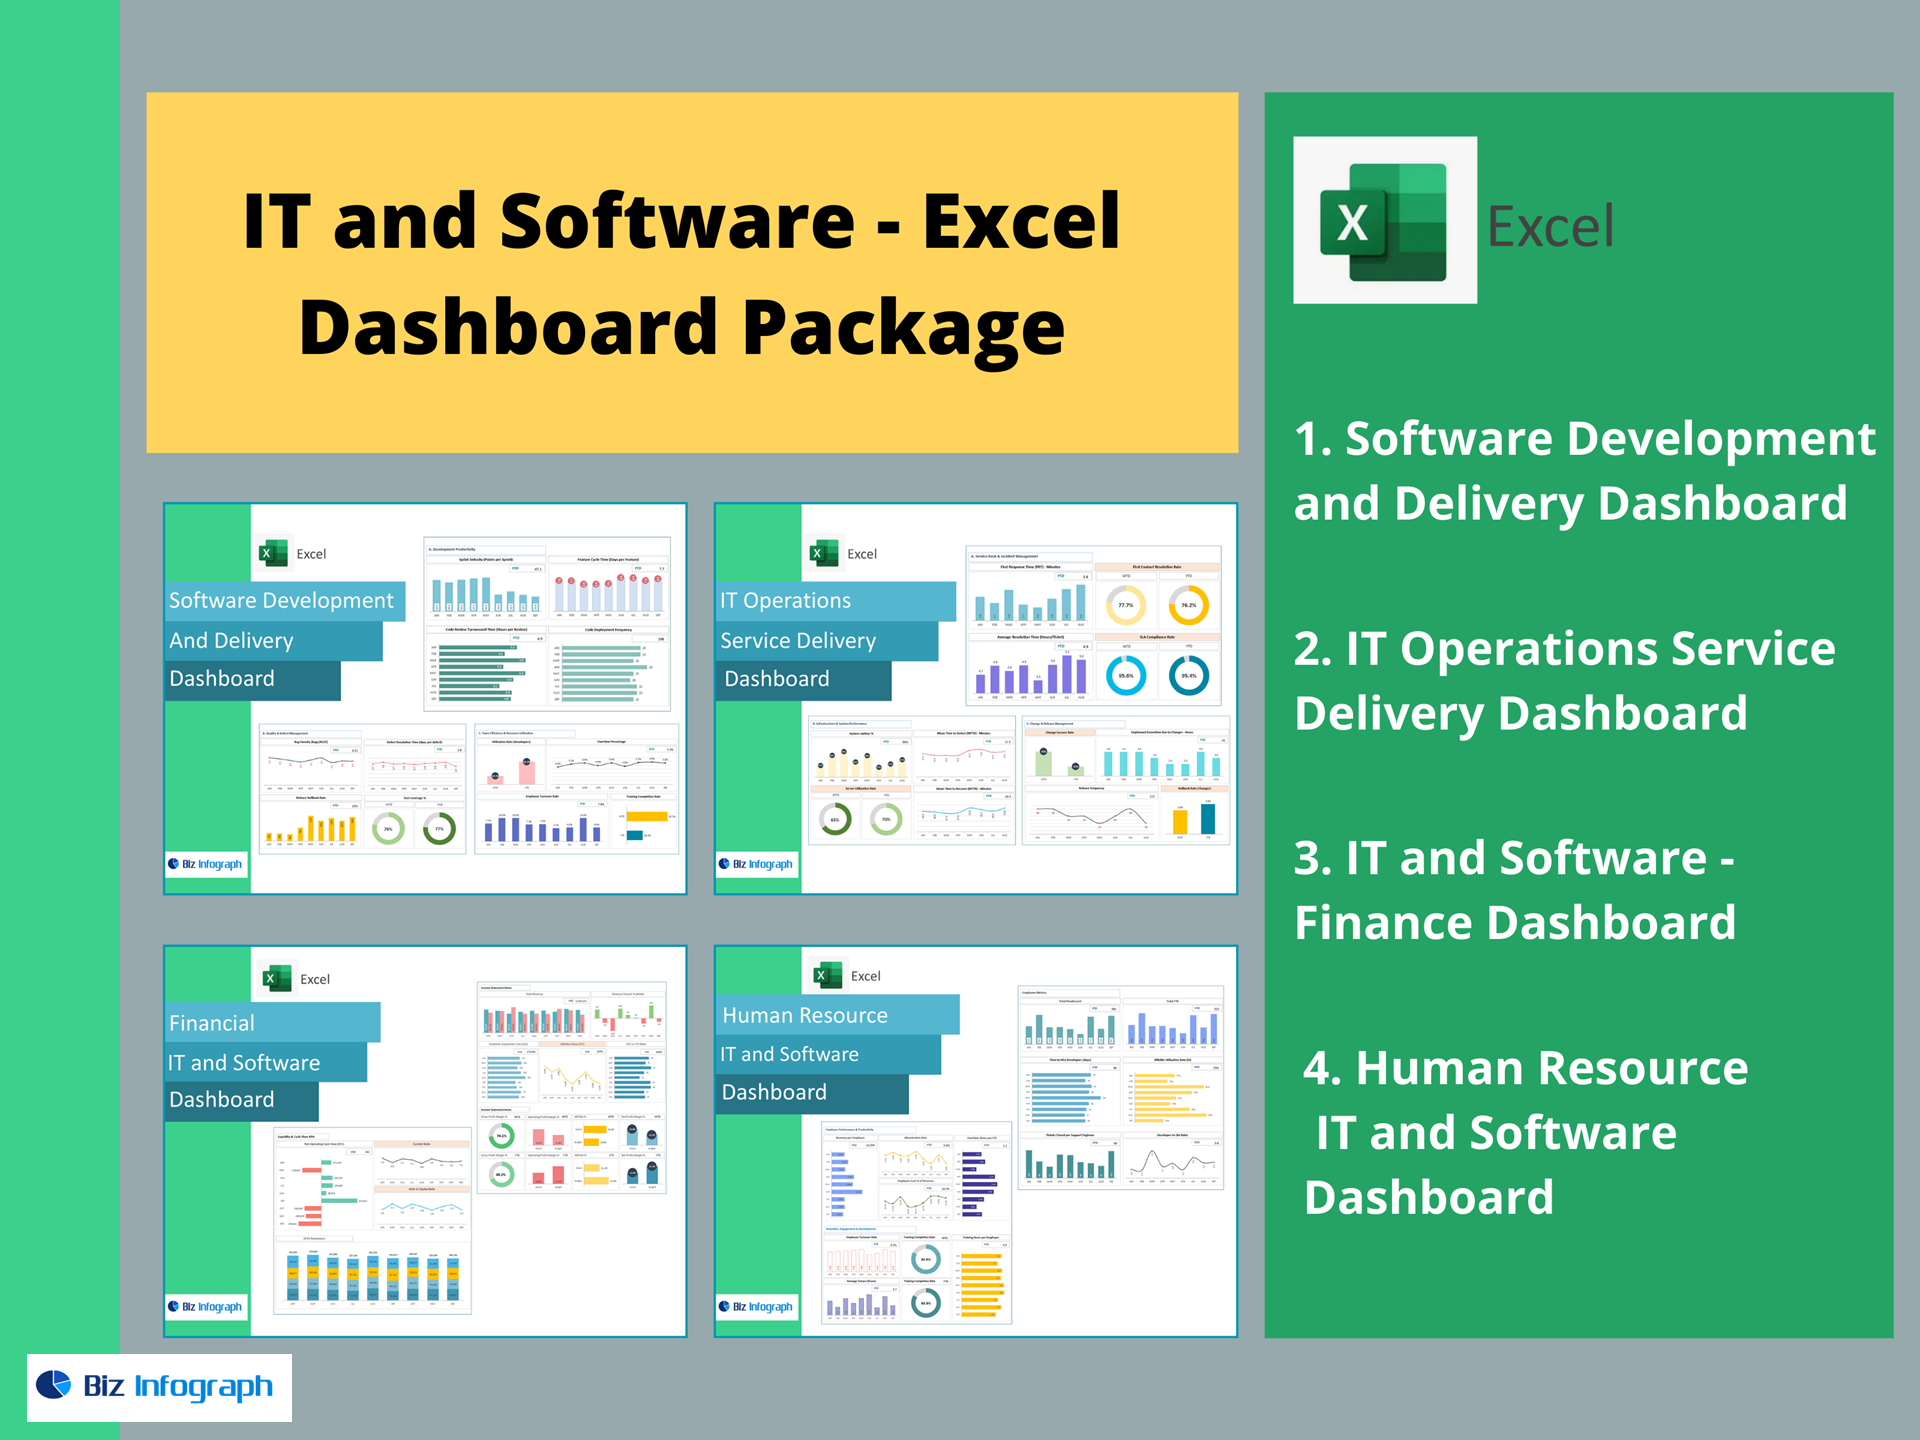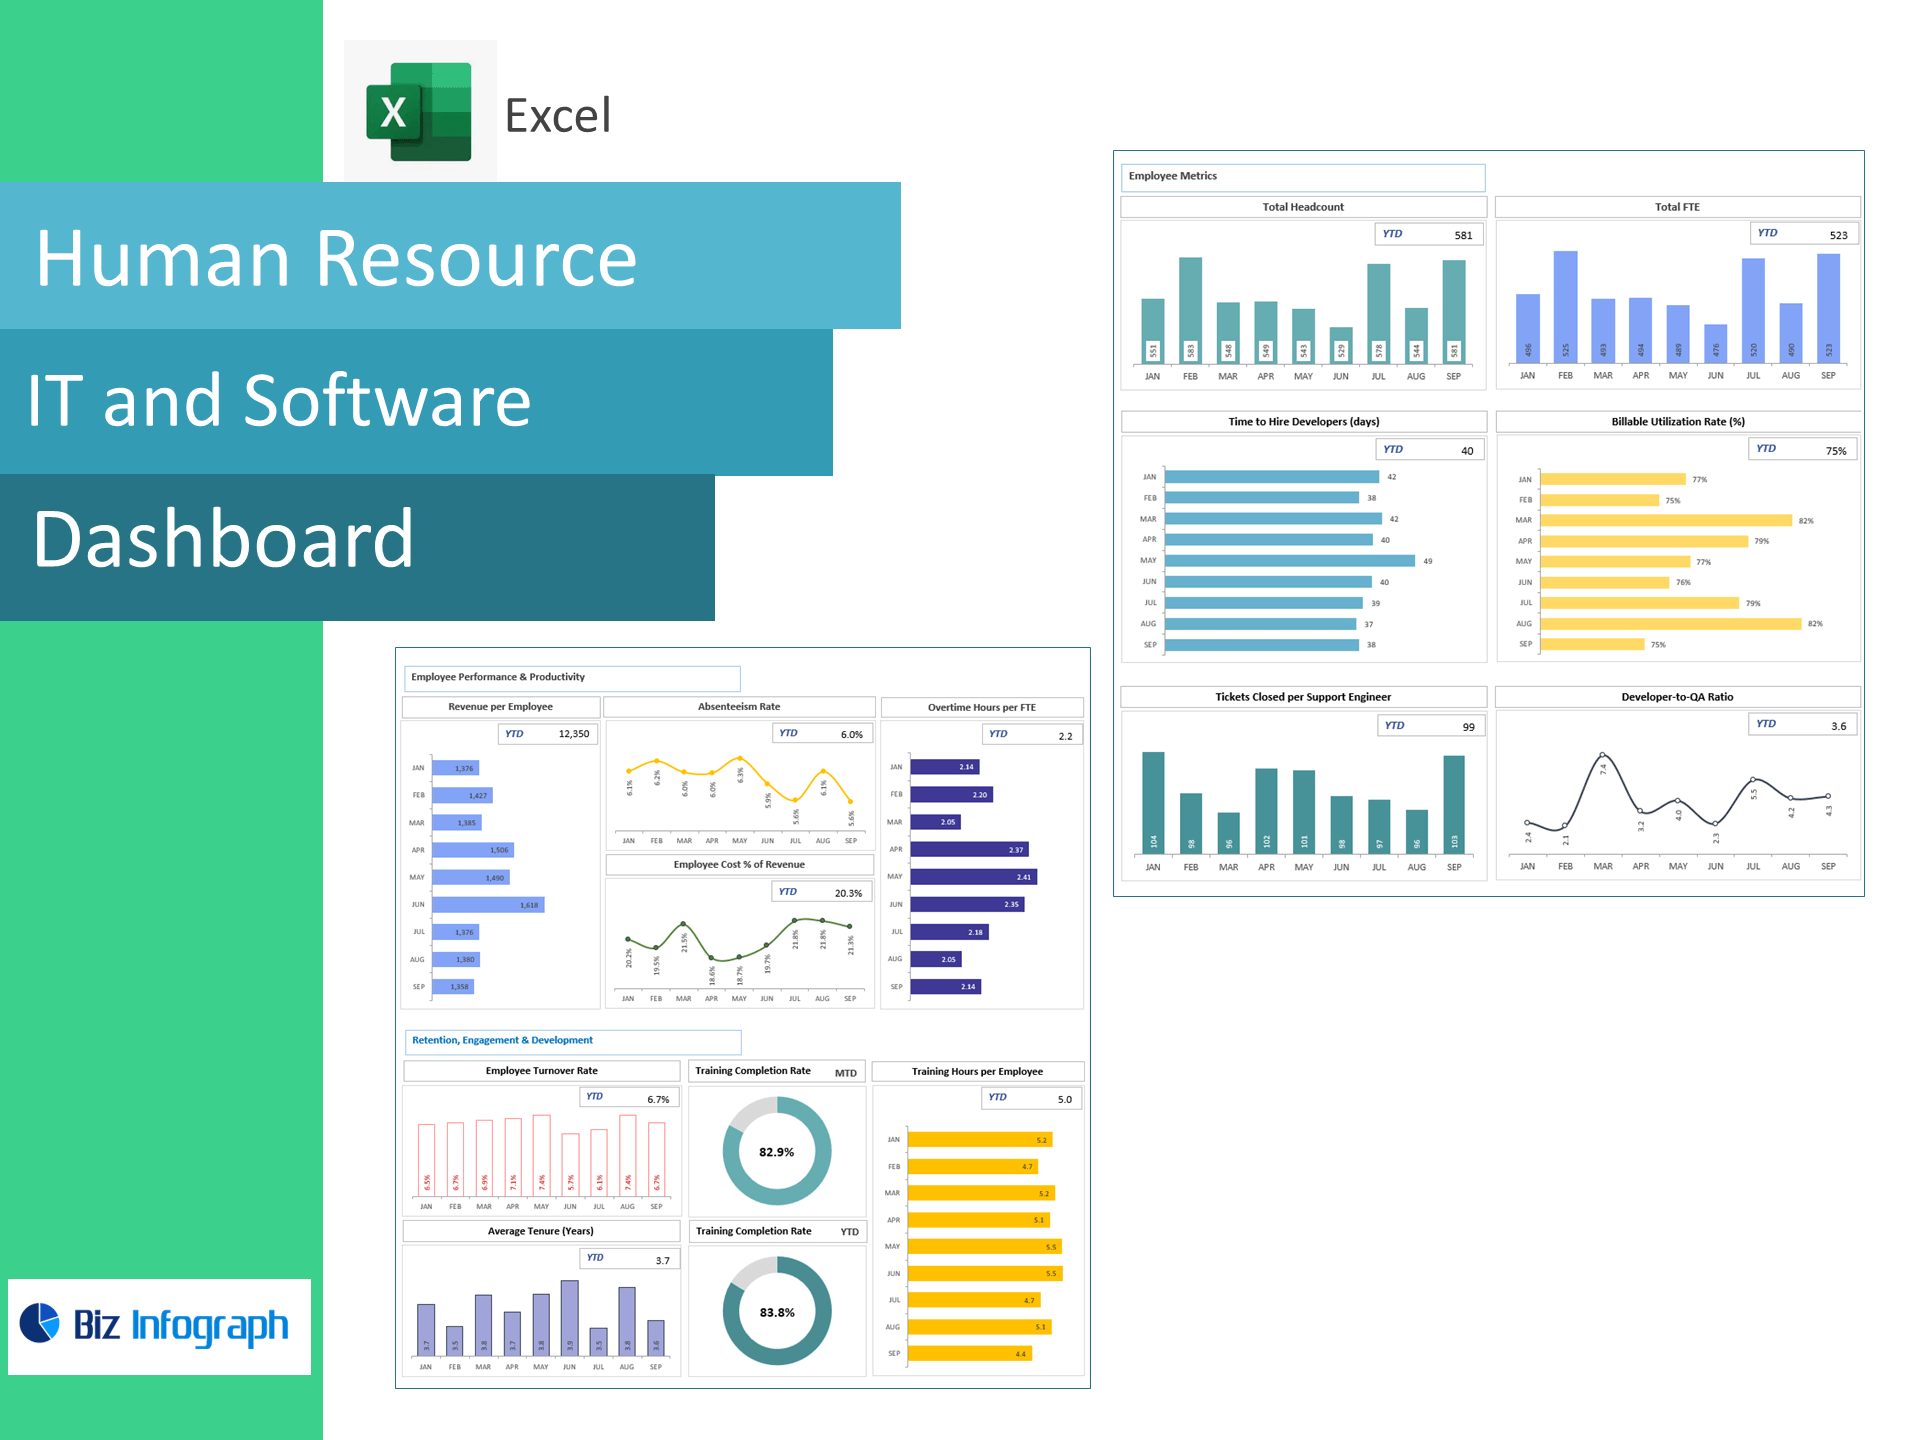
HR IT & Software Dashboard — Excel Template
Hire faster, boost utilization, and retain top tech talent—right in Excel. This ready-to-use HR analytics template turns HCM, timesheet, and help-desk exports into a live dashboard tracking Time to Hire Developers, Billable Utilization, Tickets per Support Engineer, Developer-to-QA Ratio, Revenue per Employee, Absenteeism, Overtime per FTE, Employee Cost % of Revenue, Turnover, Average Tenure, Training Completion, and Training Hours per Employee—so you can staff critical projects with confidence and protect margins.
What it tracks (prebuilt KPIs & formulas)
Workforce & Hiring
-
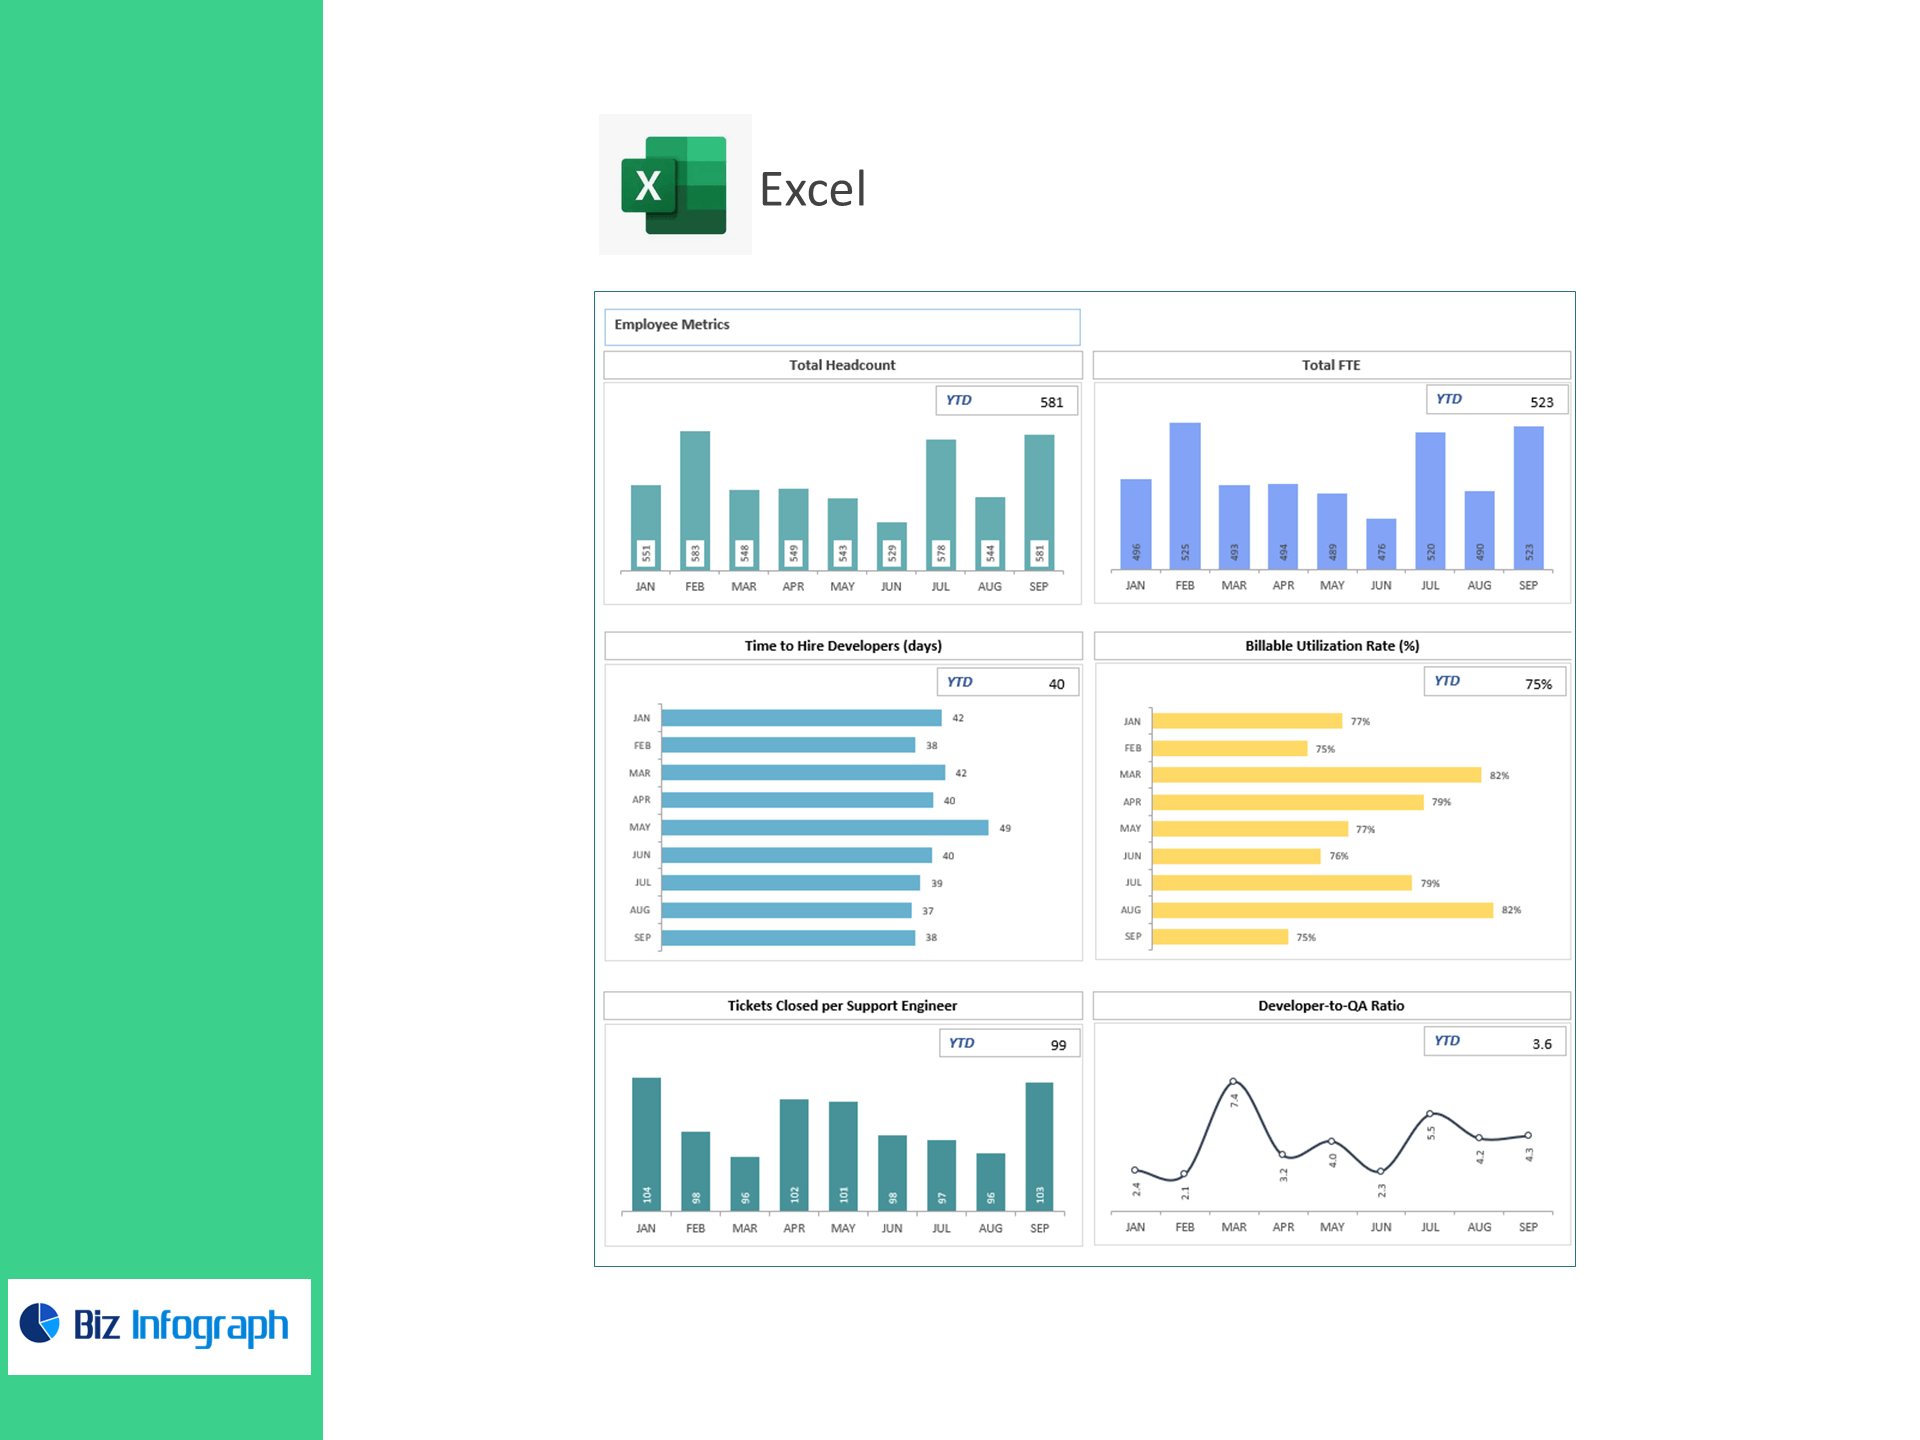
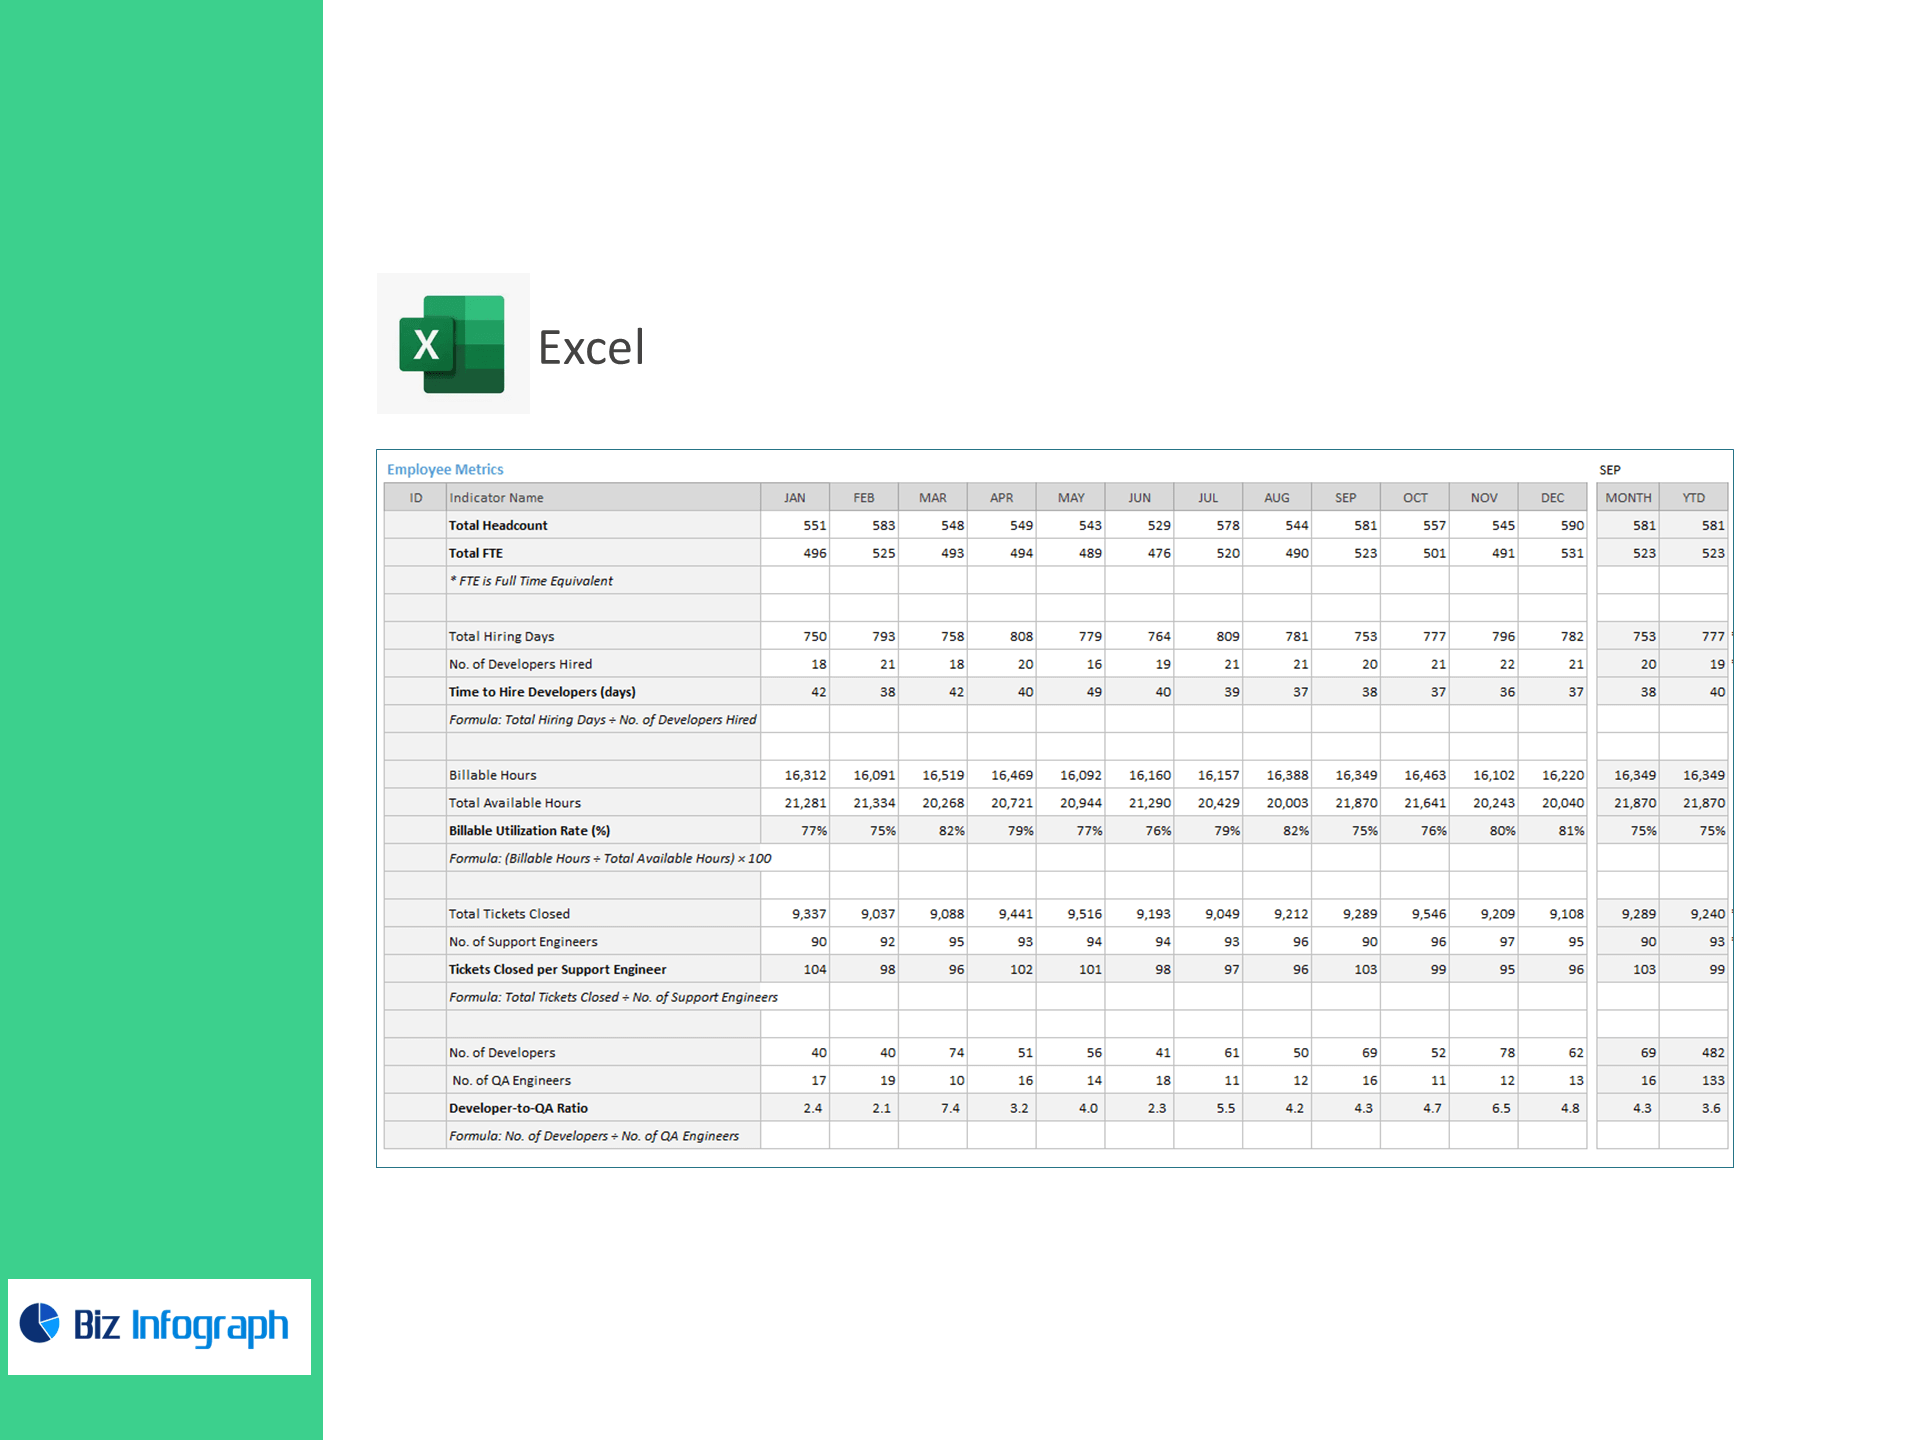
Total Headcount, Total FTE
-
Time to Hire Developers (days) = Total Hiring Days ÷ Developers Hired
-
Developer-to-QA Ratio = Developers ÷ QA Engineers
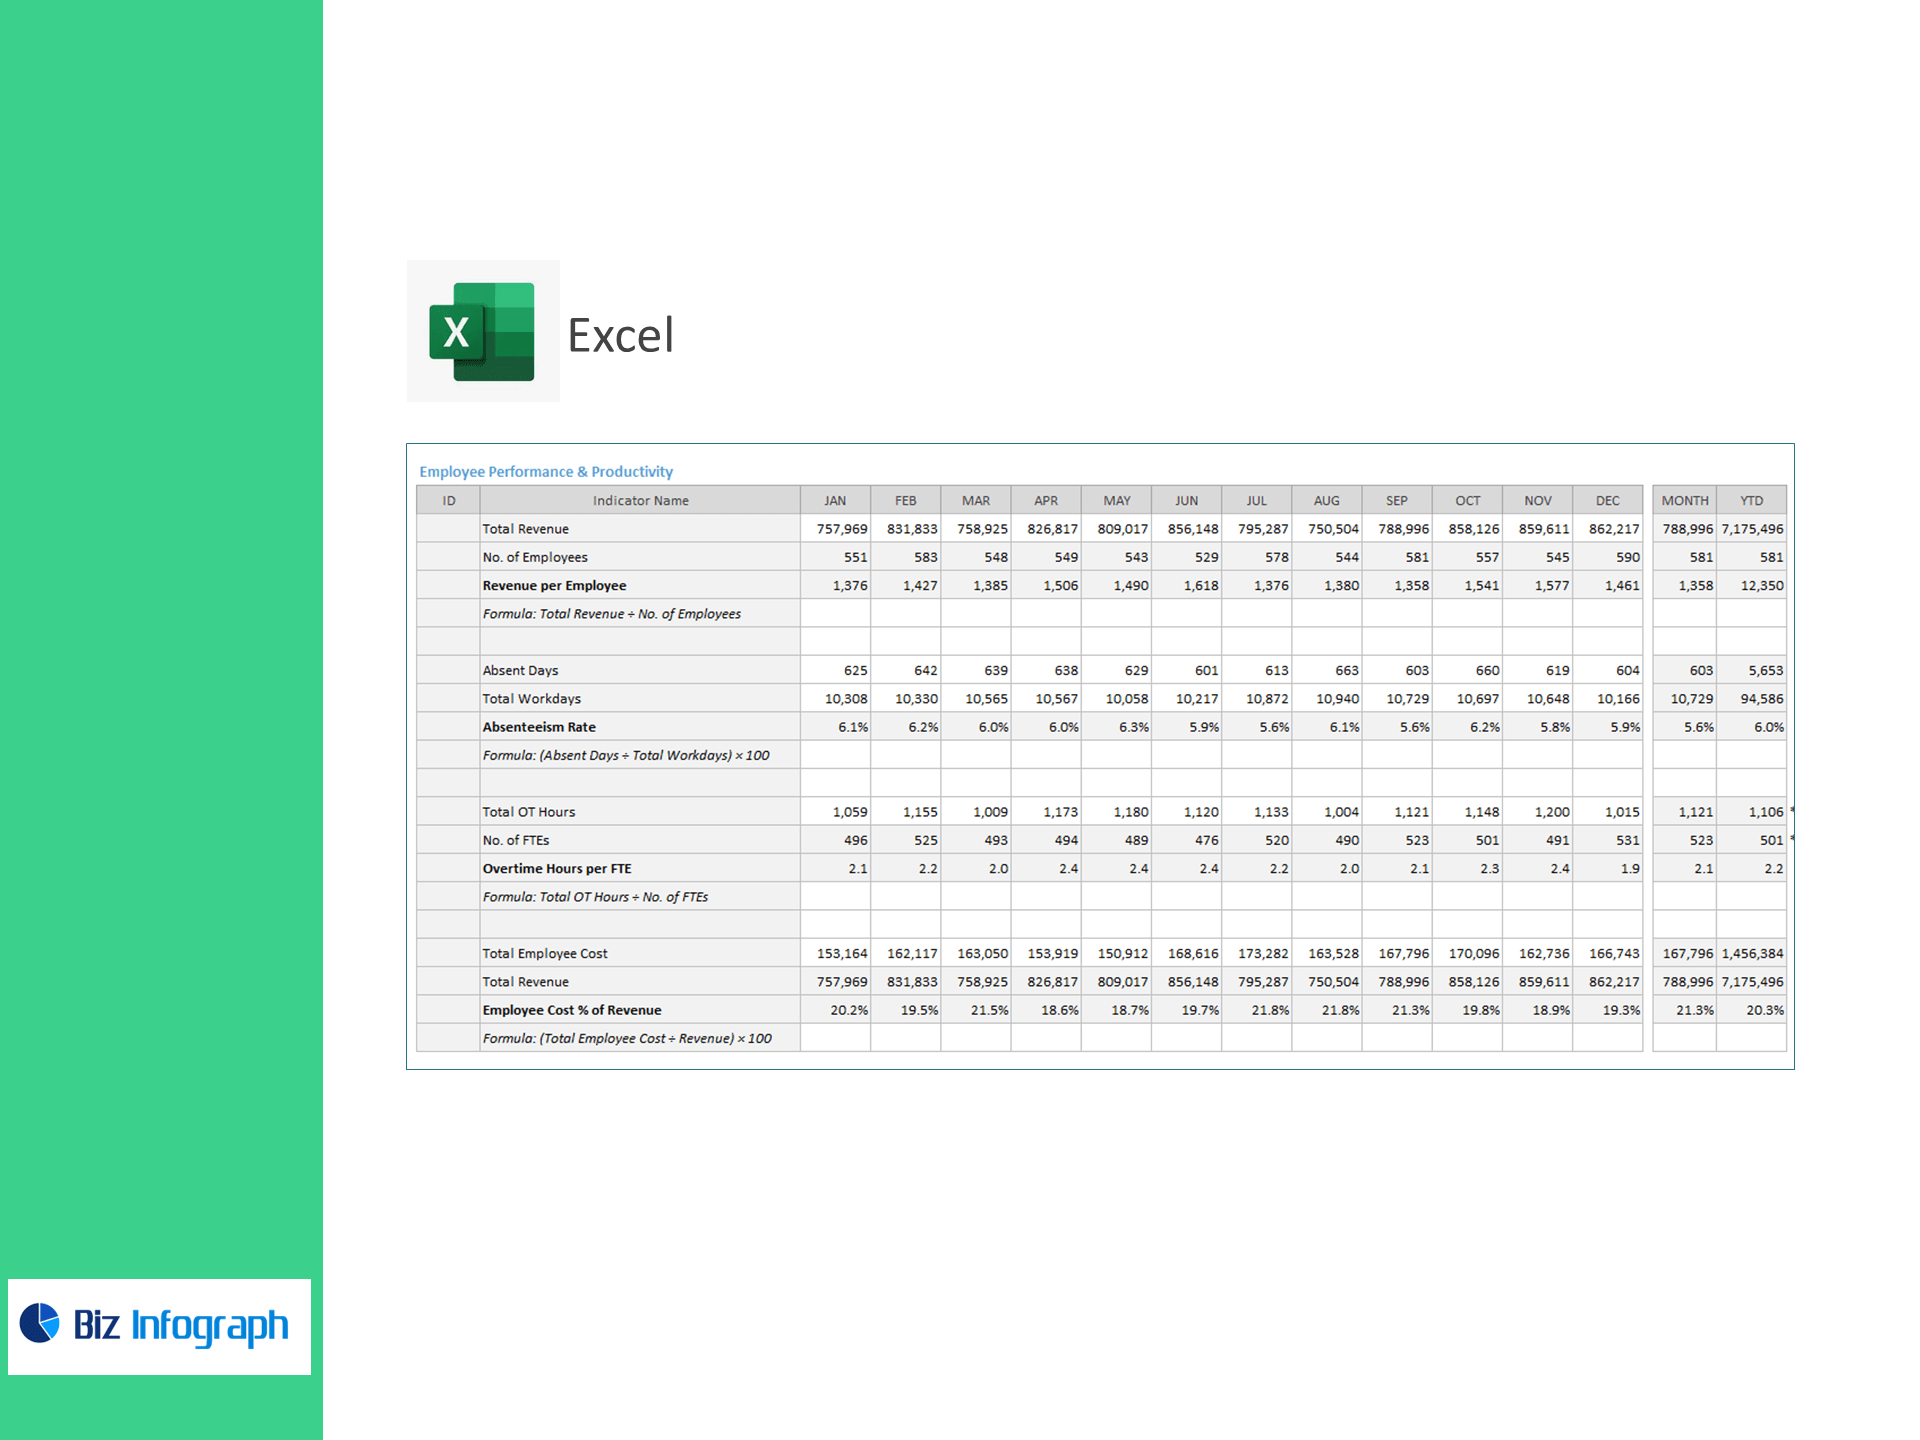
Productivity & Service
-
Billable Utilization (%) = Billable Hours ÷ Available Hours × 100
-
Tickets per Support Engineer = Total Tickets Closed ÷ Support Engineers
-
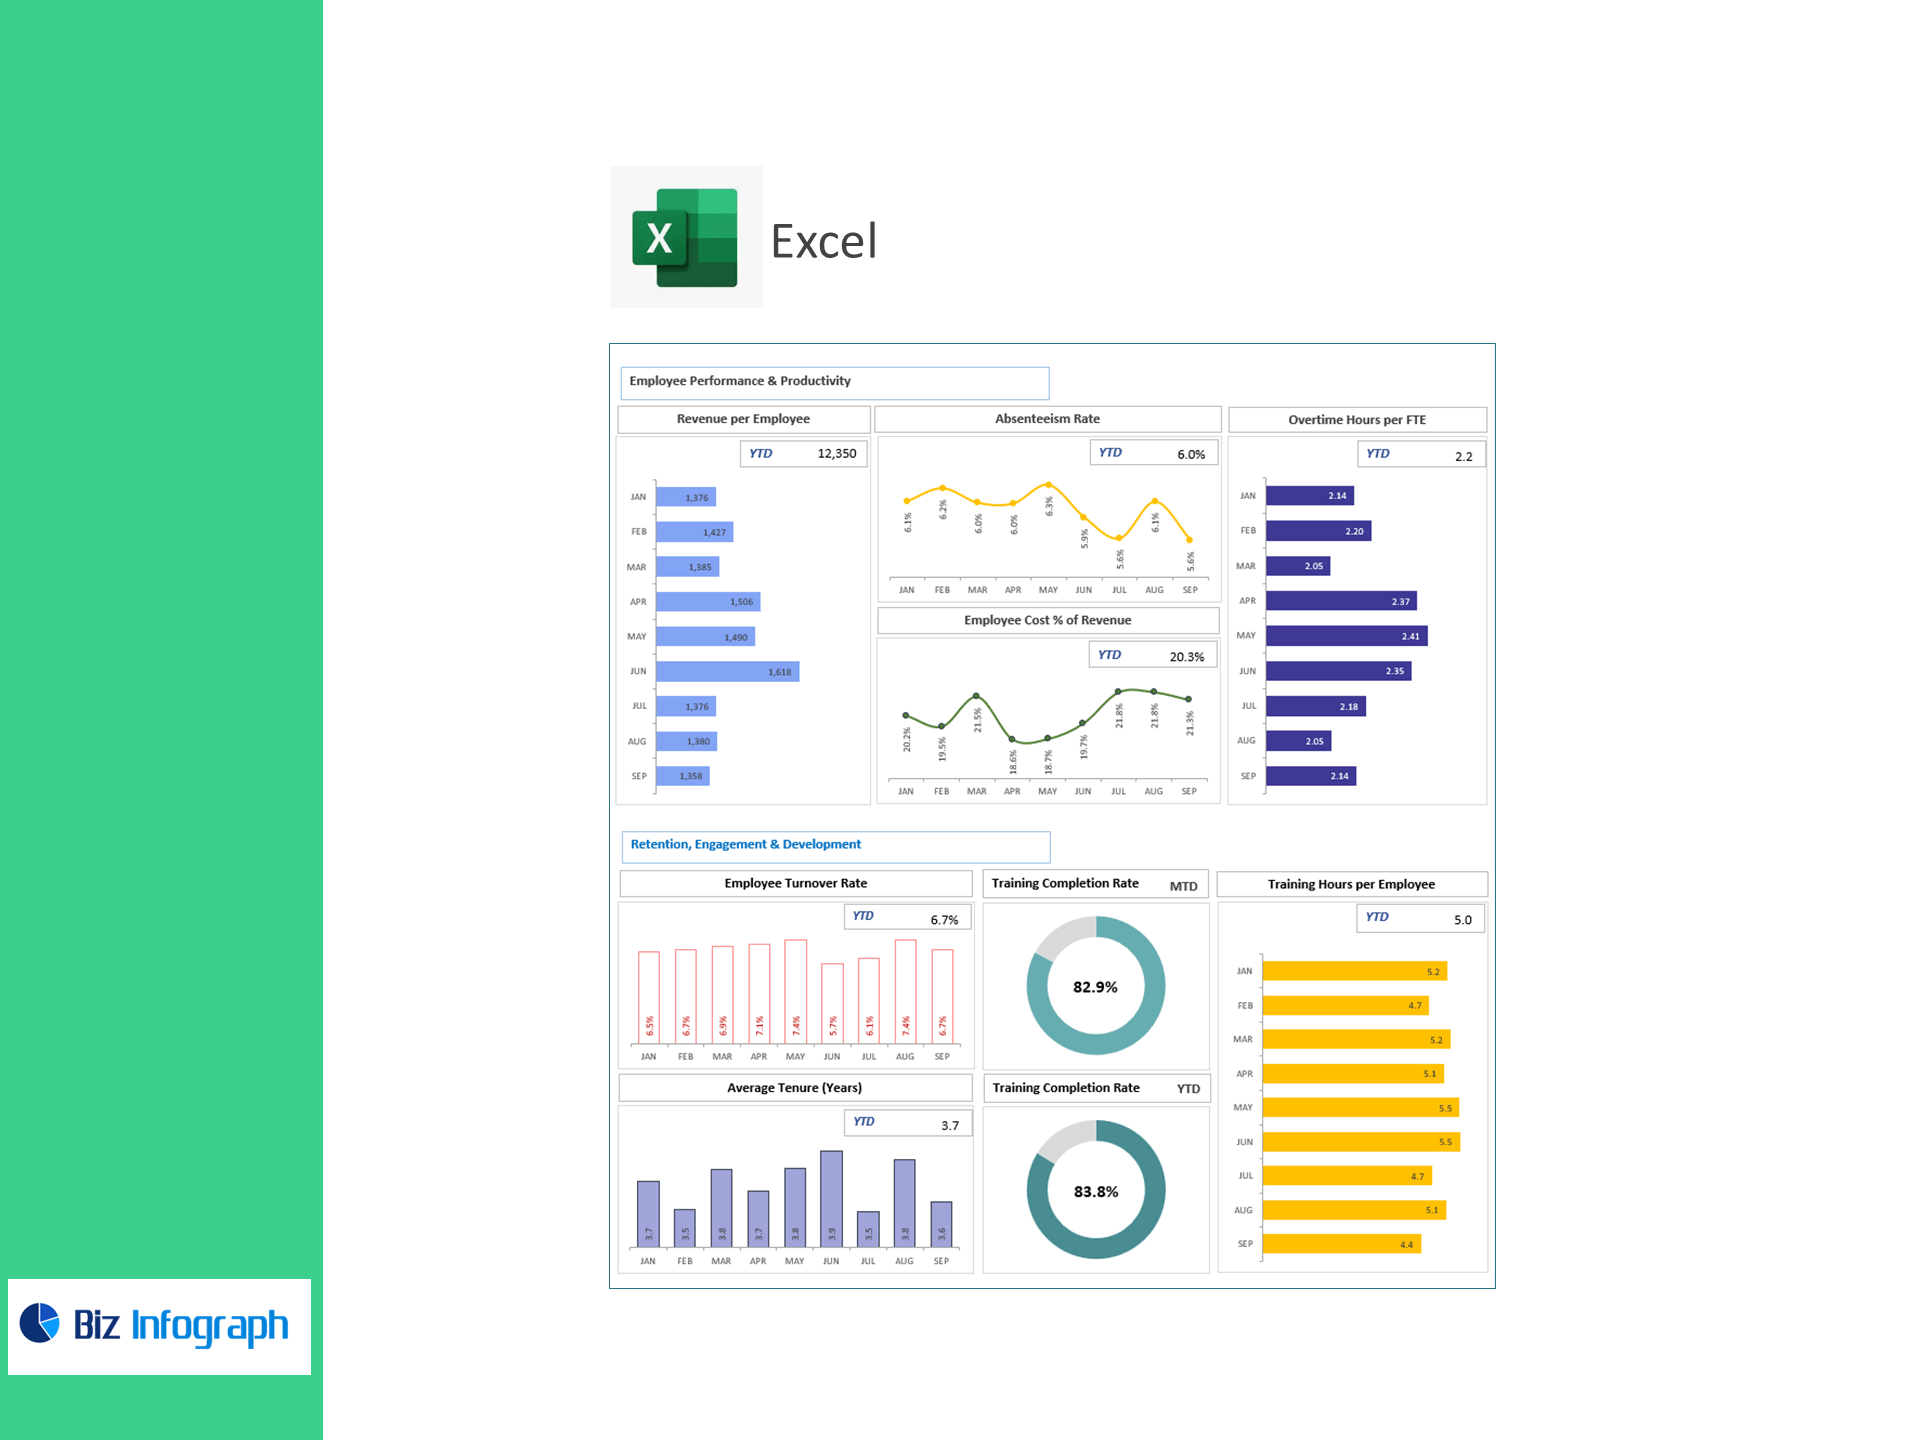
Revenue per Employee = Revenue ÷ Employees
Cost & Capacity
-
Overtime Hours per FTE = OT Hours ÷ FTEs
-
Employee Cost % of Revenue = Total Employee Cost ÷ Revenue × 100
-
Absenteeism Rate (%) = Absent Days ÷ Workdays × 100
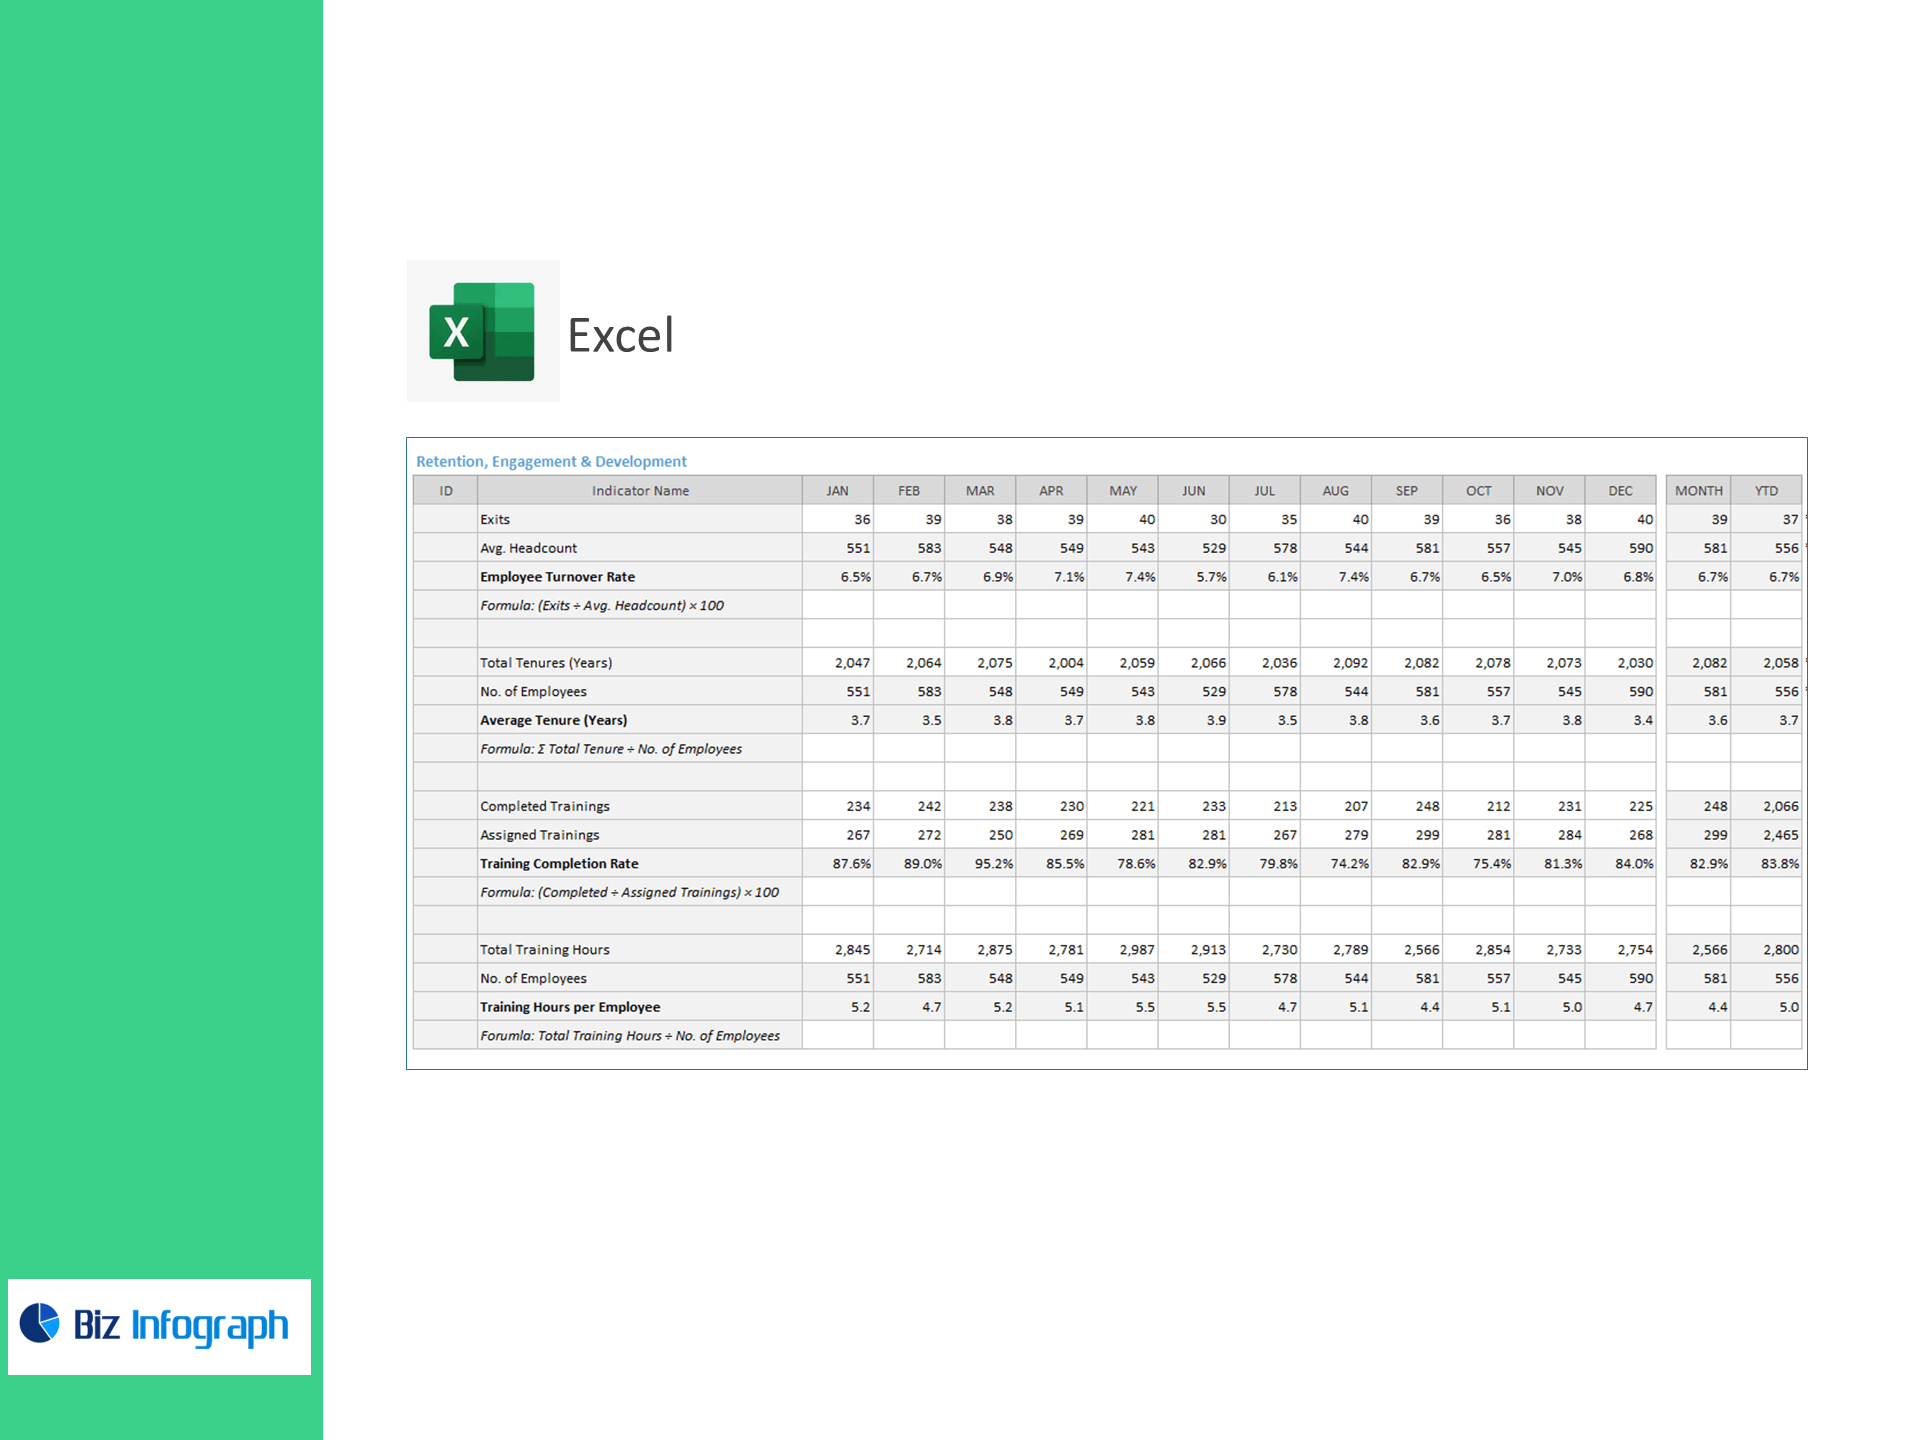
Retention & Capability
-
Employee Turnover Rate (%) = Exits ÷ Avg Headcount × 100
-
Average Tenure (Years) = Σ Tenure ÷ Employees
-
Training Completion Rate (%) = Completed ÷ Assigned Trainings × 100
-
Training Hours per Employee = Total Training Hours ÷ Employees
Why IT & software teams love it
-
Delivery-aligned HR: See hiring speed, utilization, and support throughput in one view.
-
Margin protection: Track labor mix, OT, and cost share against revenue.
-
Skills growth: Monitor training velocity and completion by role or squad.
-
Excel-native: Paste CSVs—no macros, add-ins, or coding required.
What’s inside
-
Executive Dashboard: Utilization, hiring speed, ticket throughput, cost share, attrition & tenure with Above/Below-Target flags.
-
Role & Team Drilldowns: Developers, QA, Support, and Ops with filters by project, location, or squad.
-
Training & Compliance Panel: Completion and hours by technology stack or certification.
-
Clean Data Tables: Headcount, hours (billable/available/OT), tickets, exits, and learning records.
-
Quick-Start Guide with sample data.
For ready-to-use Dashboard Templates: