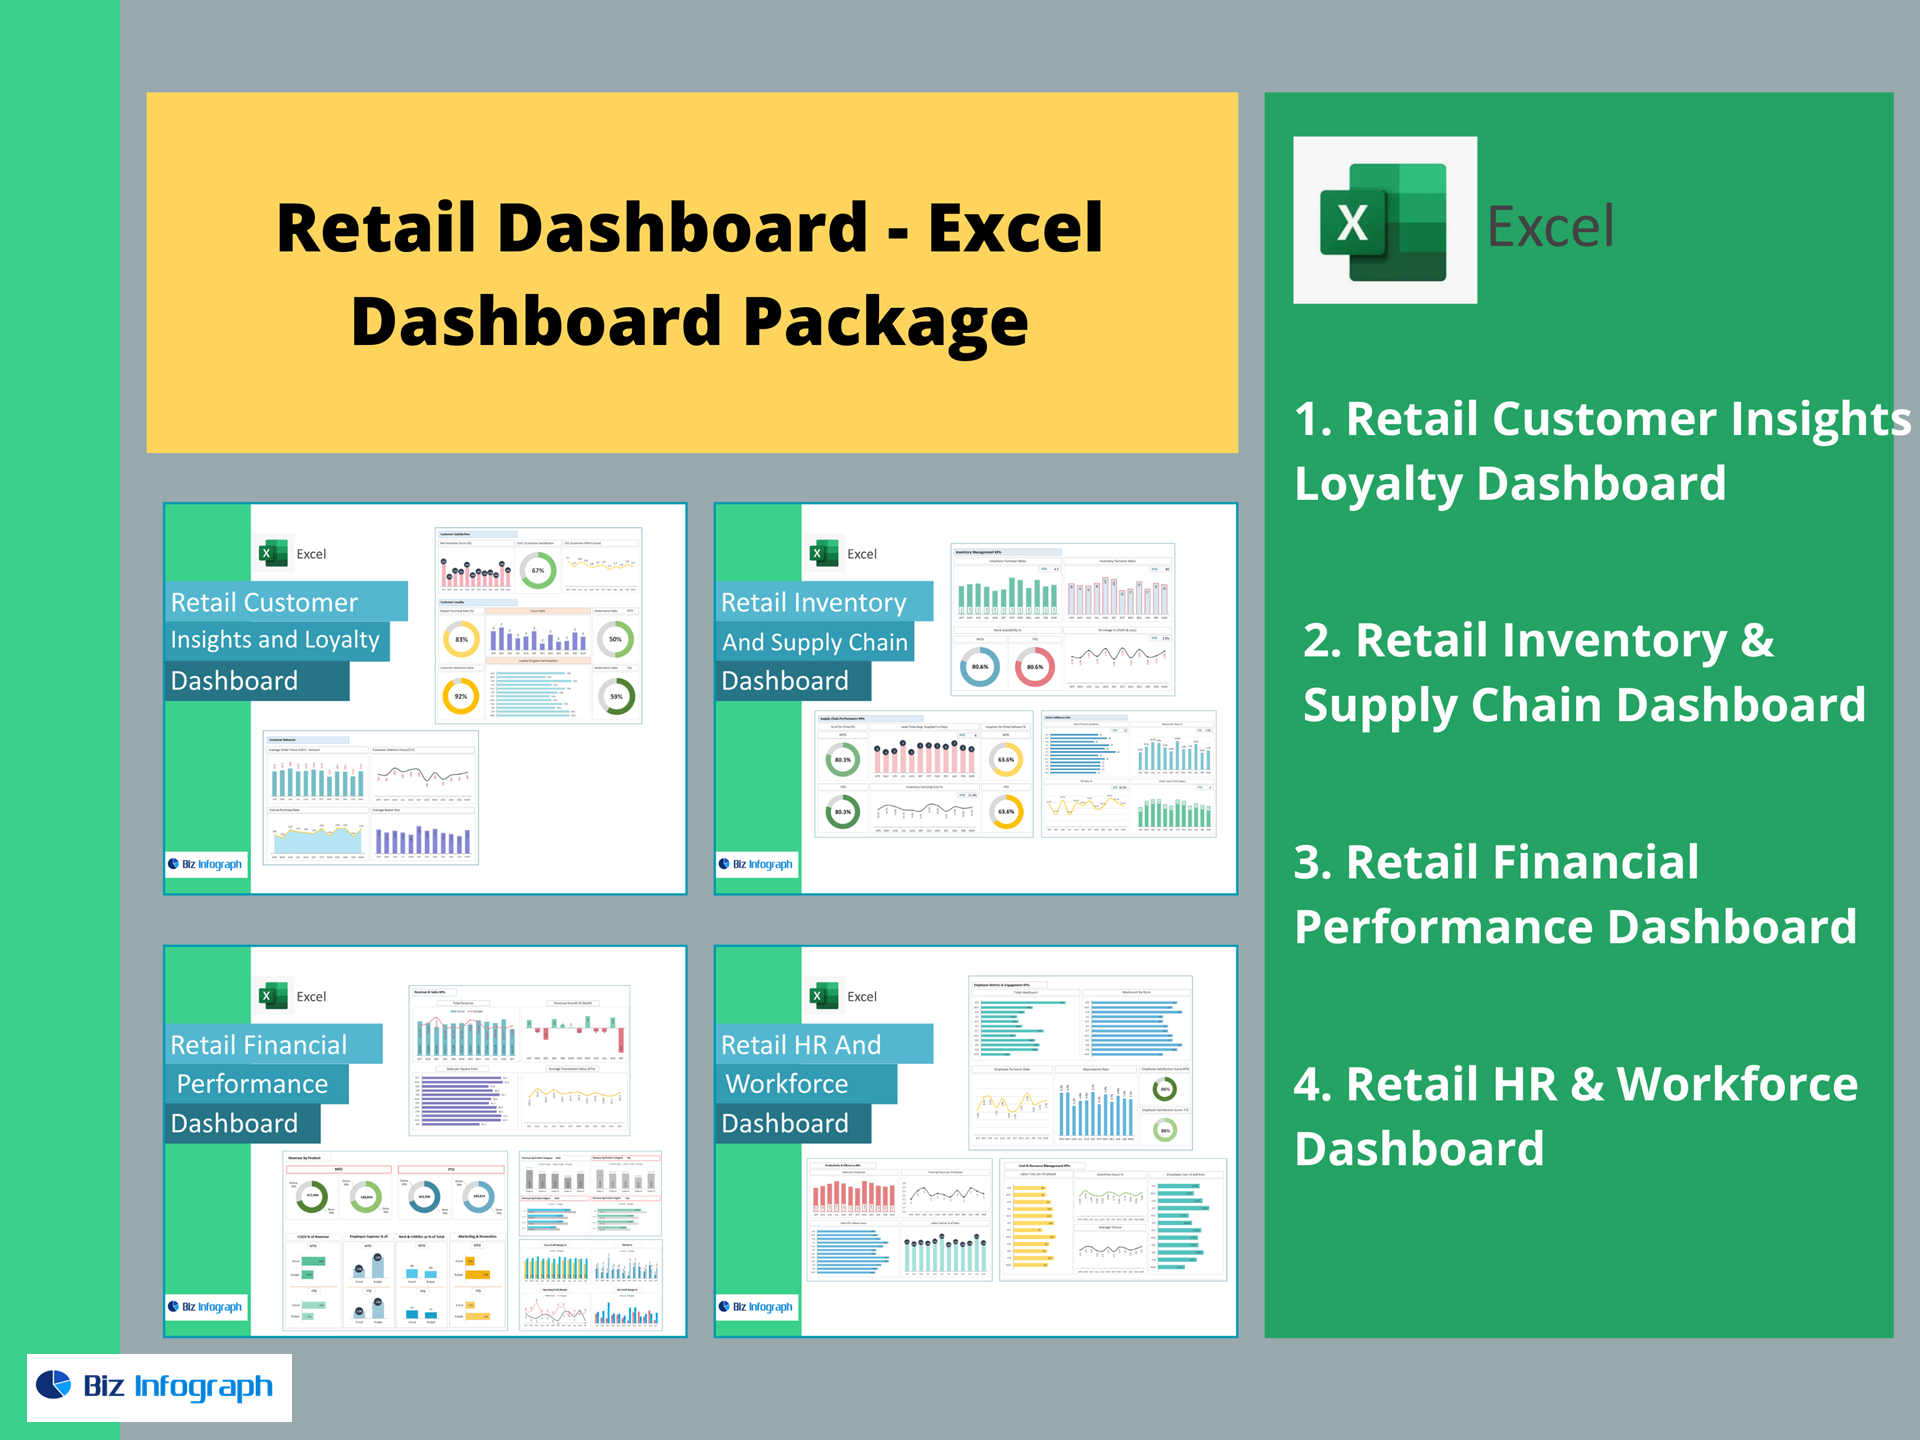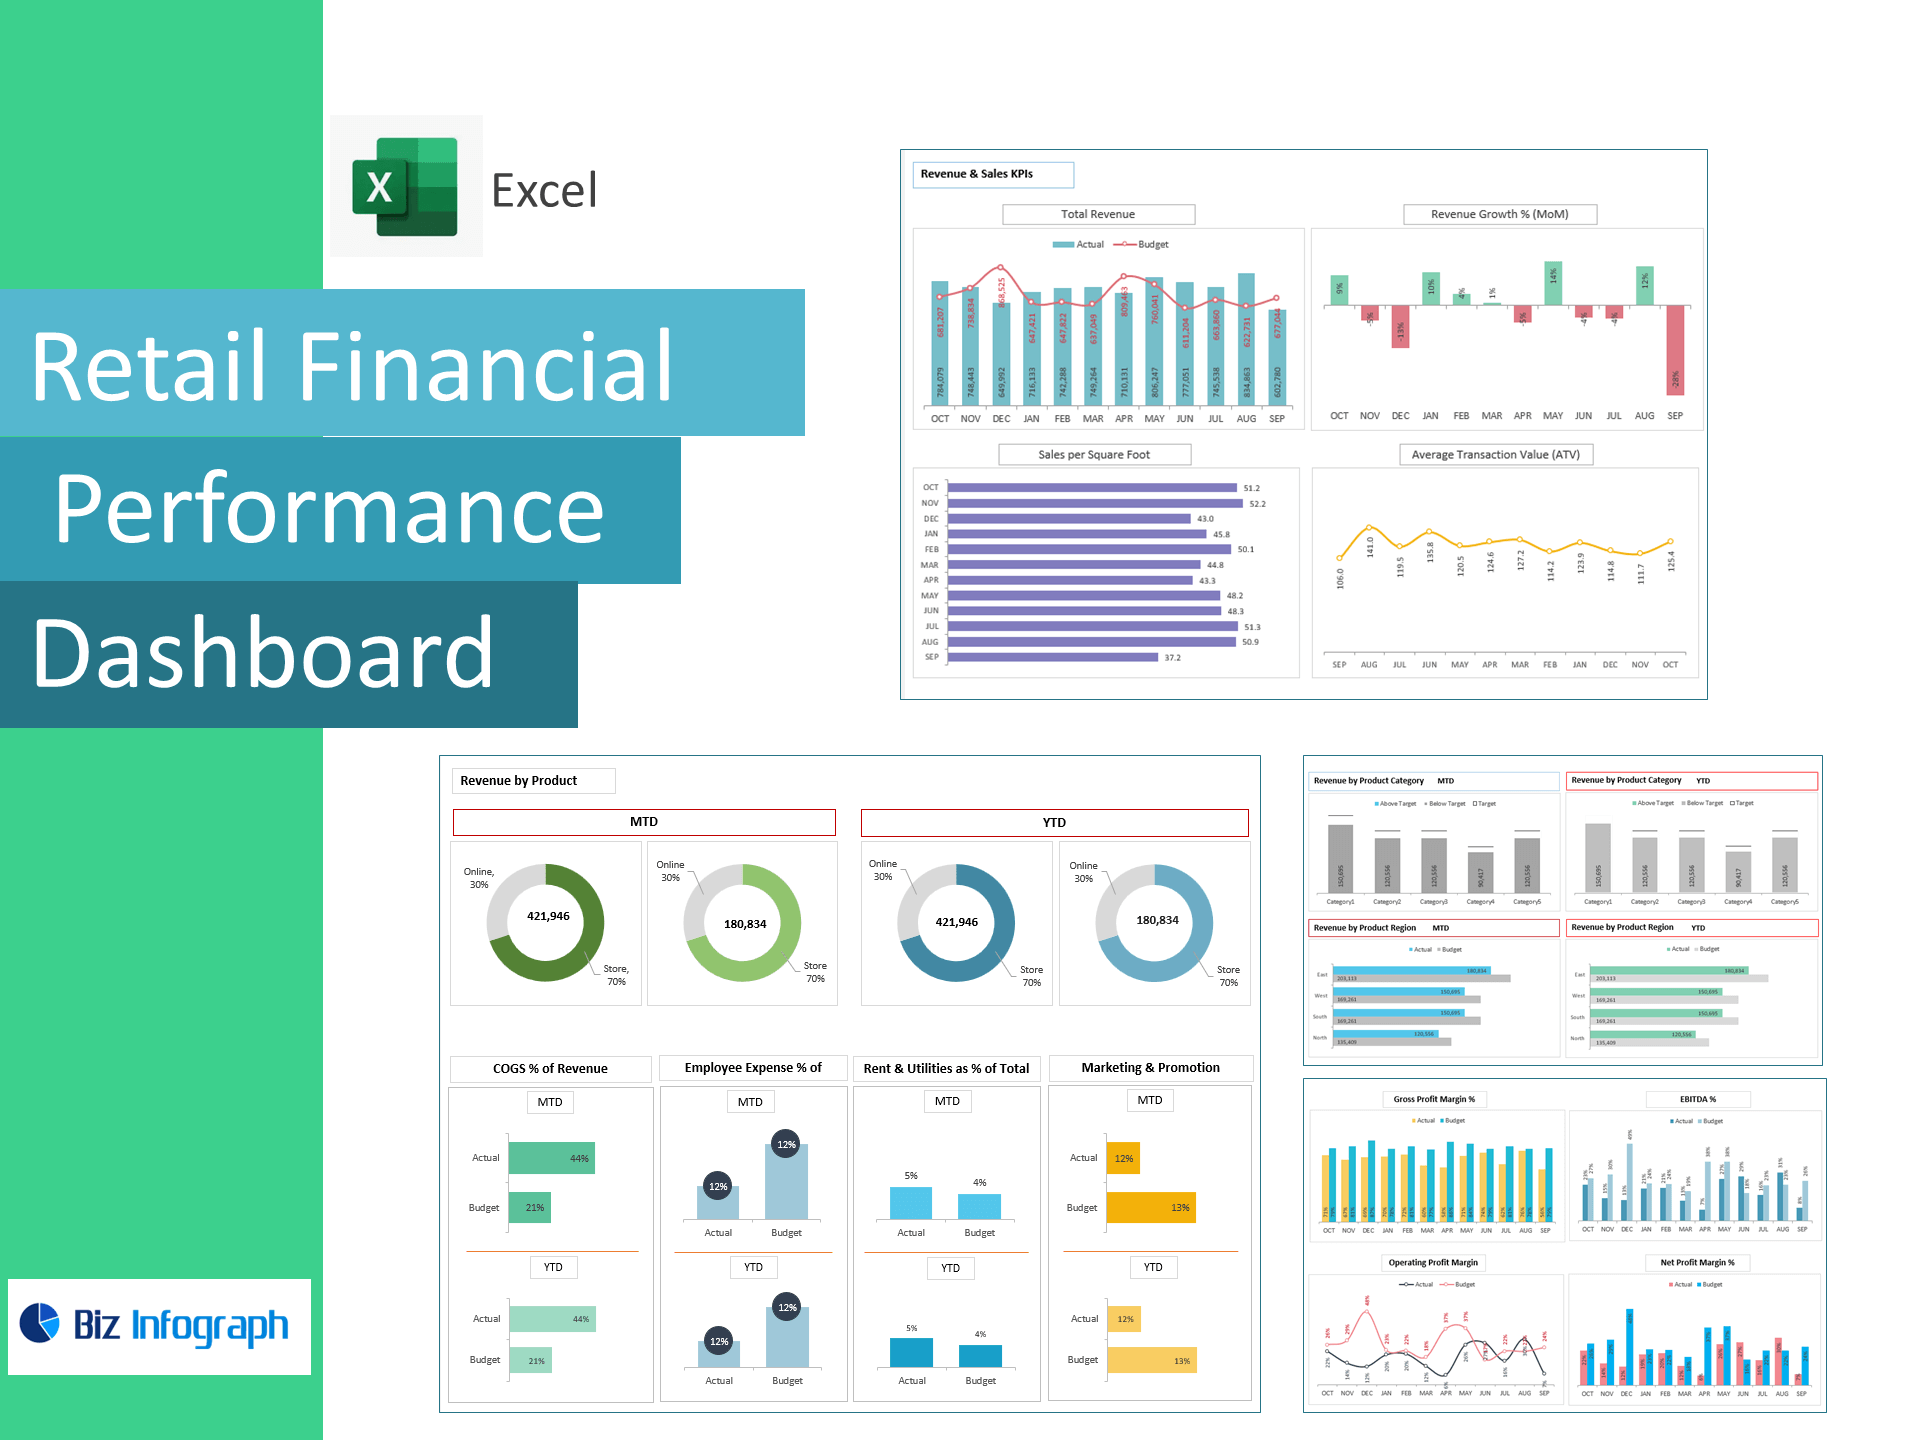
Retail Financial Performance Dashboard — Excel Template
Track profitability with precision—no BI required. This Excel template converts your income statement data into an executive dashboard that spotlights margins, operating costs, and cash?earning power. Monitor COGS %, Gross/Operating/Net Profit Margins, EBITDA %, and variances to Target so you can fix leaks fast and scale what works.
What it does
-
Consolidates revenue and expense lines into a single, board-ready dashboard.
-
Auto-calculates Gross Profit, EBIT, EBITDA, Net Profit and all key percentages.
-
Flags Above Target and Below Target metrics with clear variance visuals.
-
Works for single stores, multi-store retail, and eCommerce.
KPIs & Metrics Covered (ready-made)
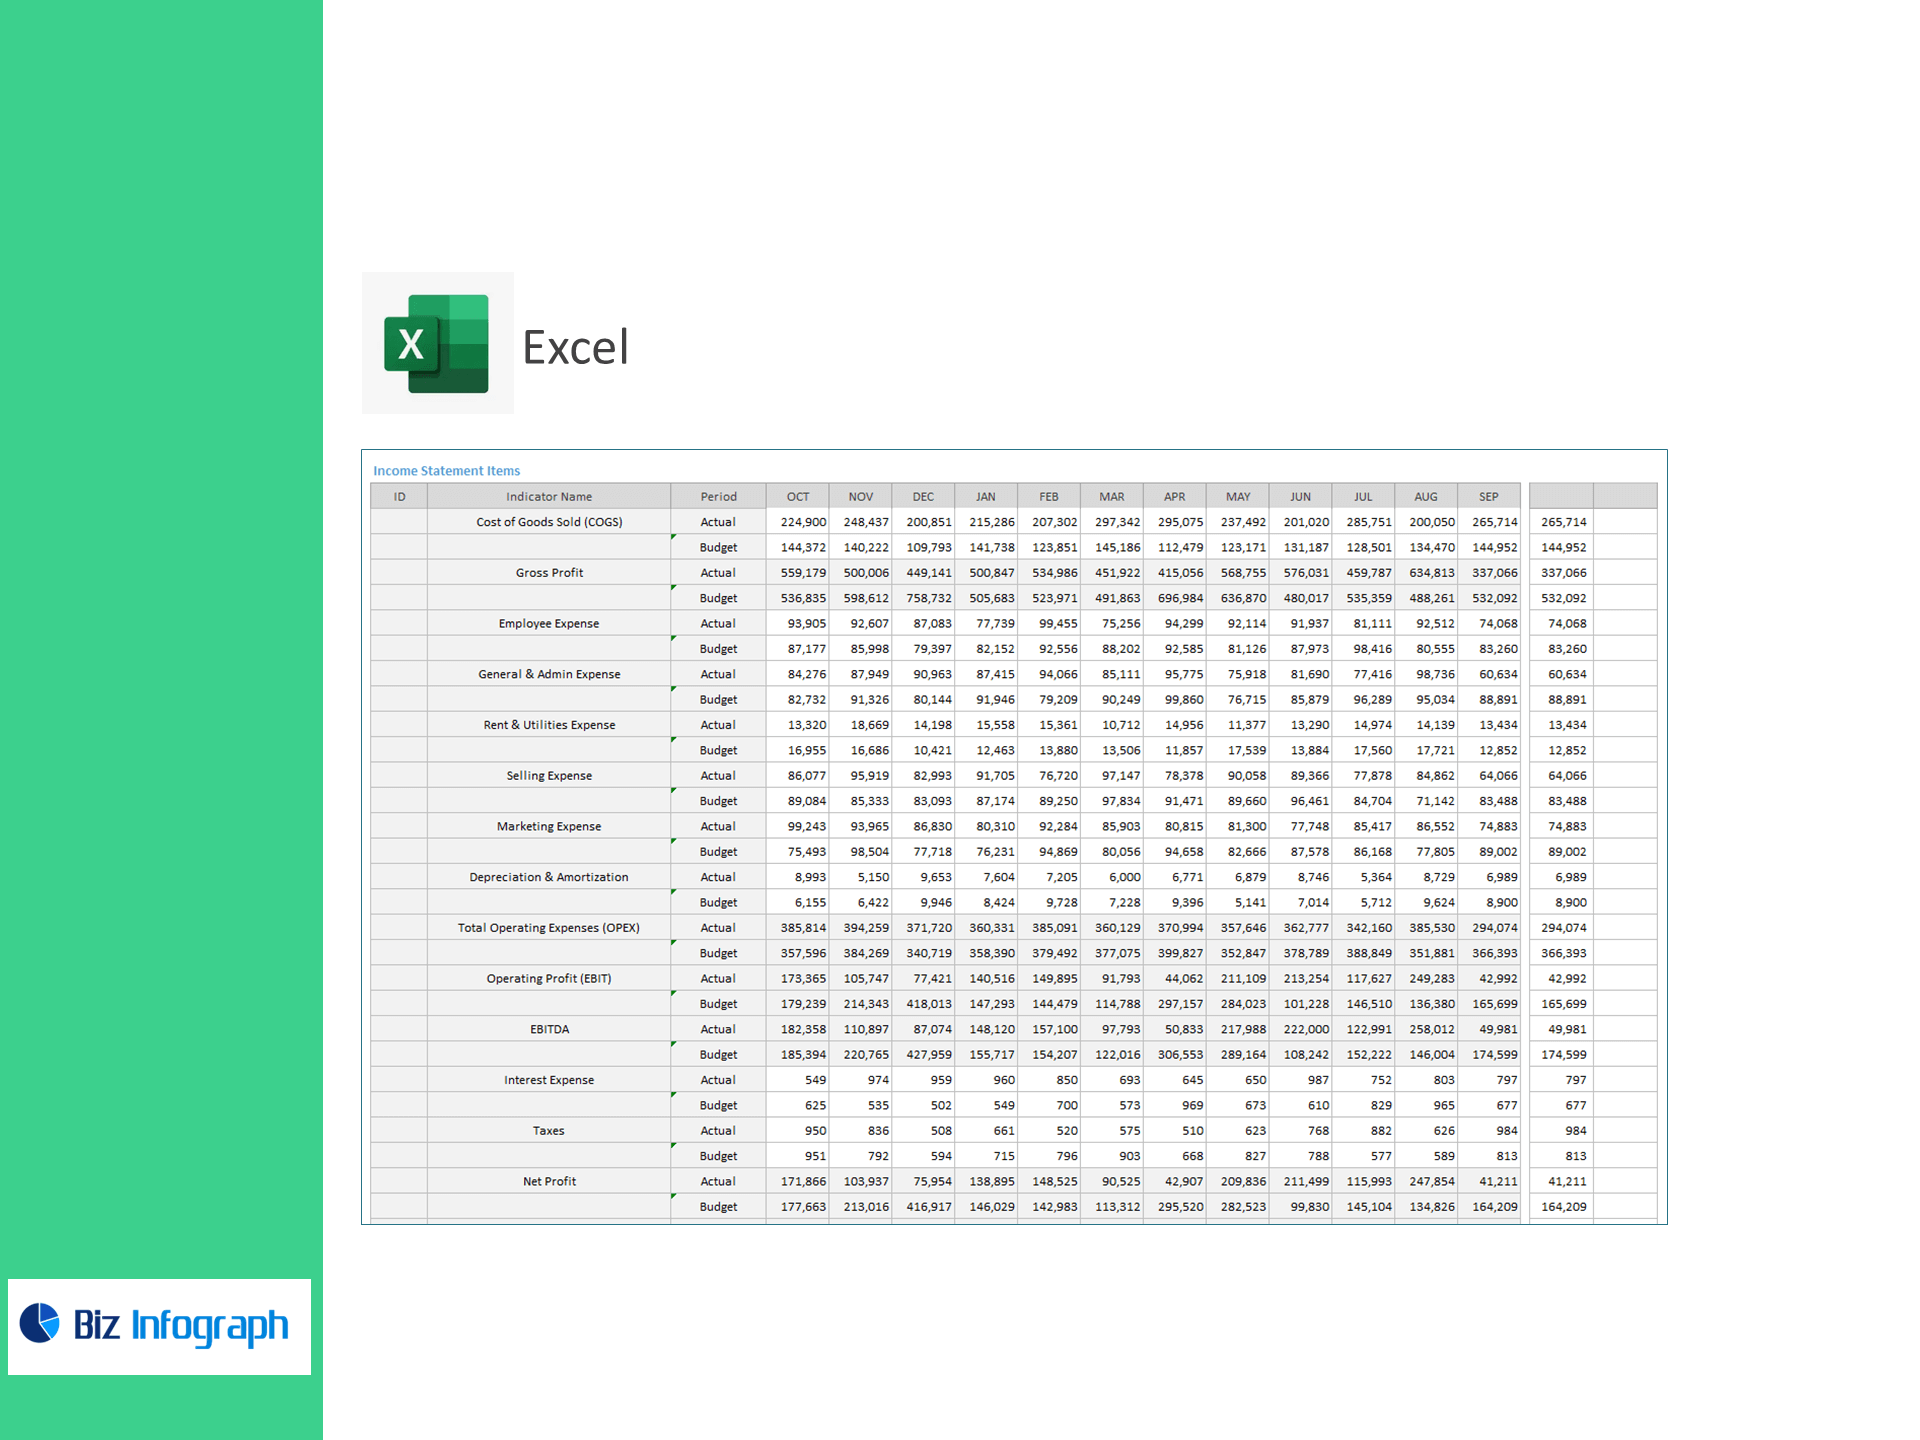
Income Statement Items
-
Revenue (input), Cost of Goods Sold (COGS)
-
Gross Profit
-
Employee Expense, General & Admin Expense, Rent & Utilities, Selling Expense, Marketing Expense, Depreciation & Amortization
-
Total Operating Expenses (OPEX)
-
Operating Profit (EBIT), EBITDA, Interest Expense, Taxes, Net Profit
Profitability KPIs (auto-calculated)
-
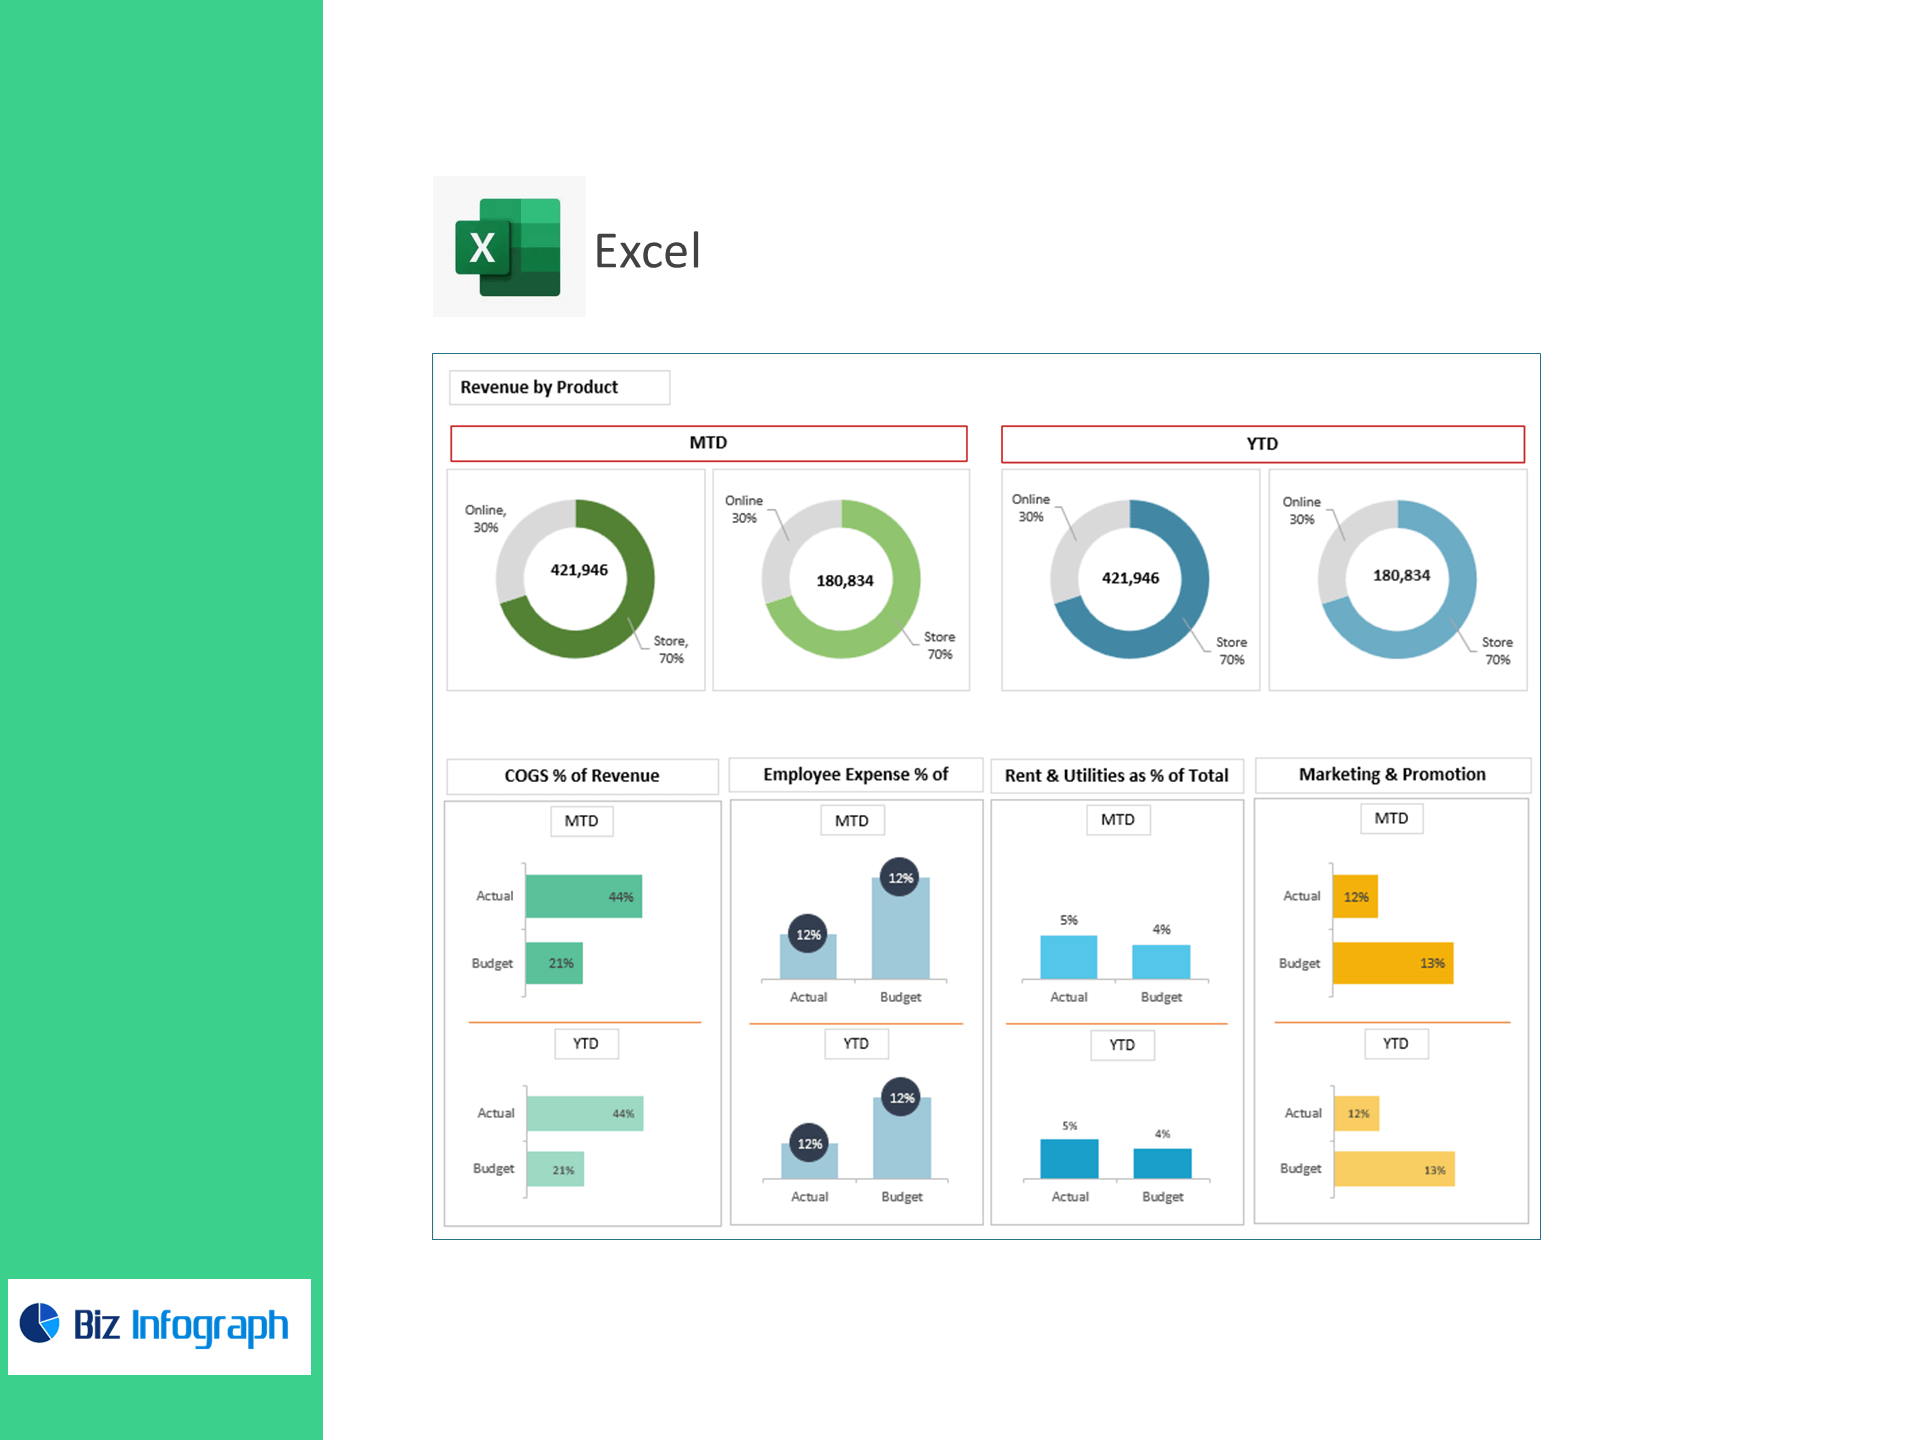
COGS % of Revenue
-
Employee Expense % of Revenue
-
Rent & Utilities % of Total Costs
-
Marketing & Promotion % of Revenue
-
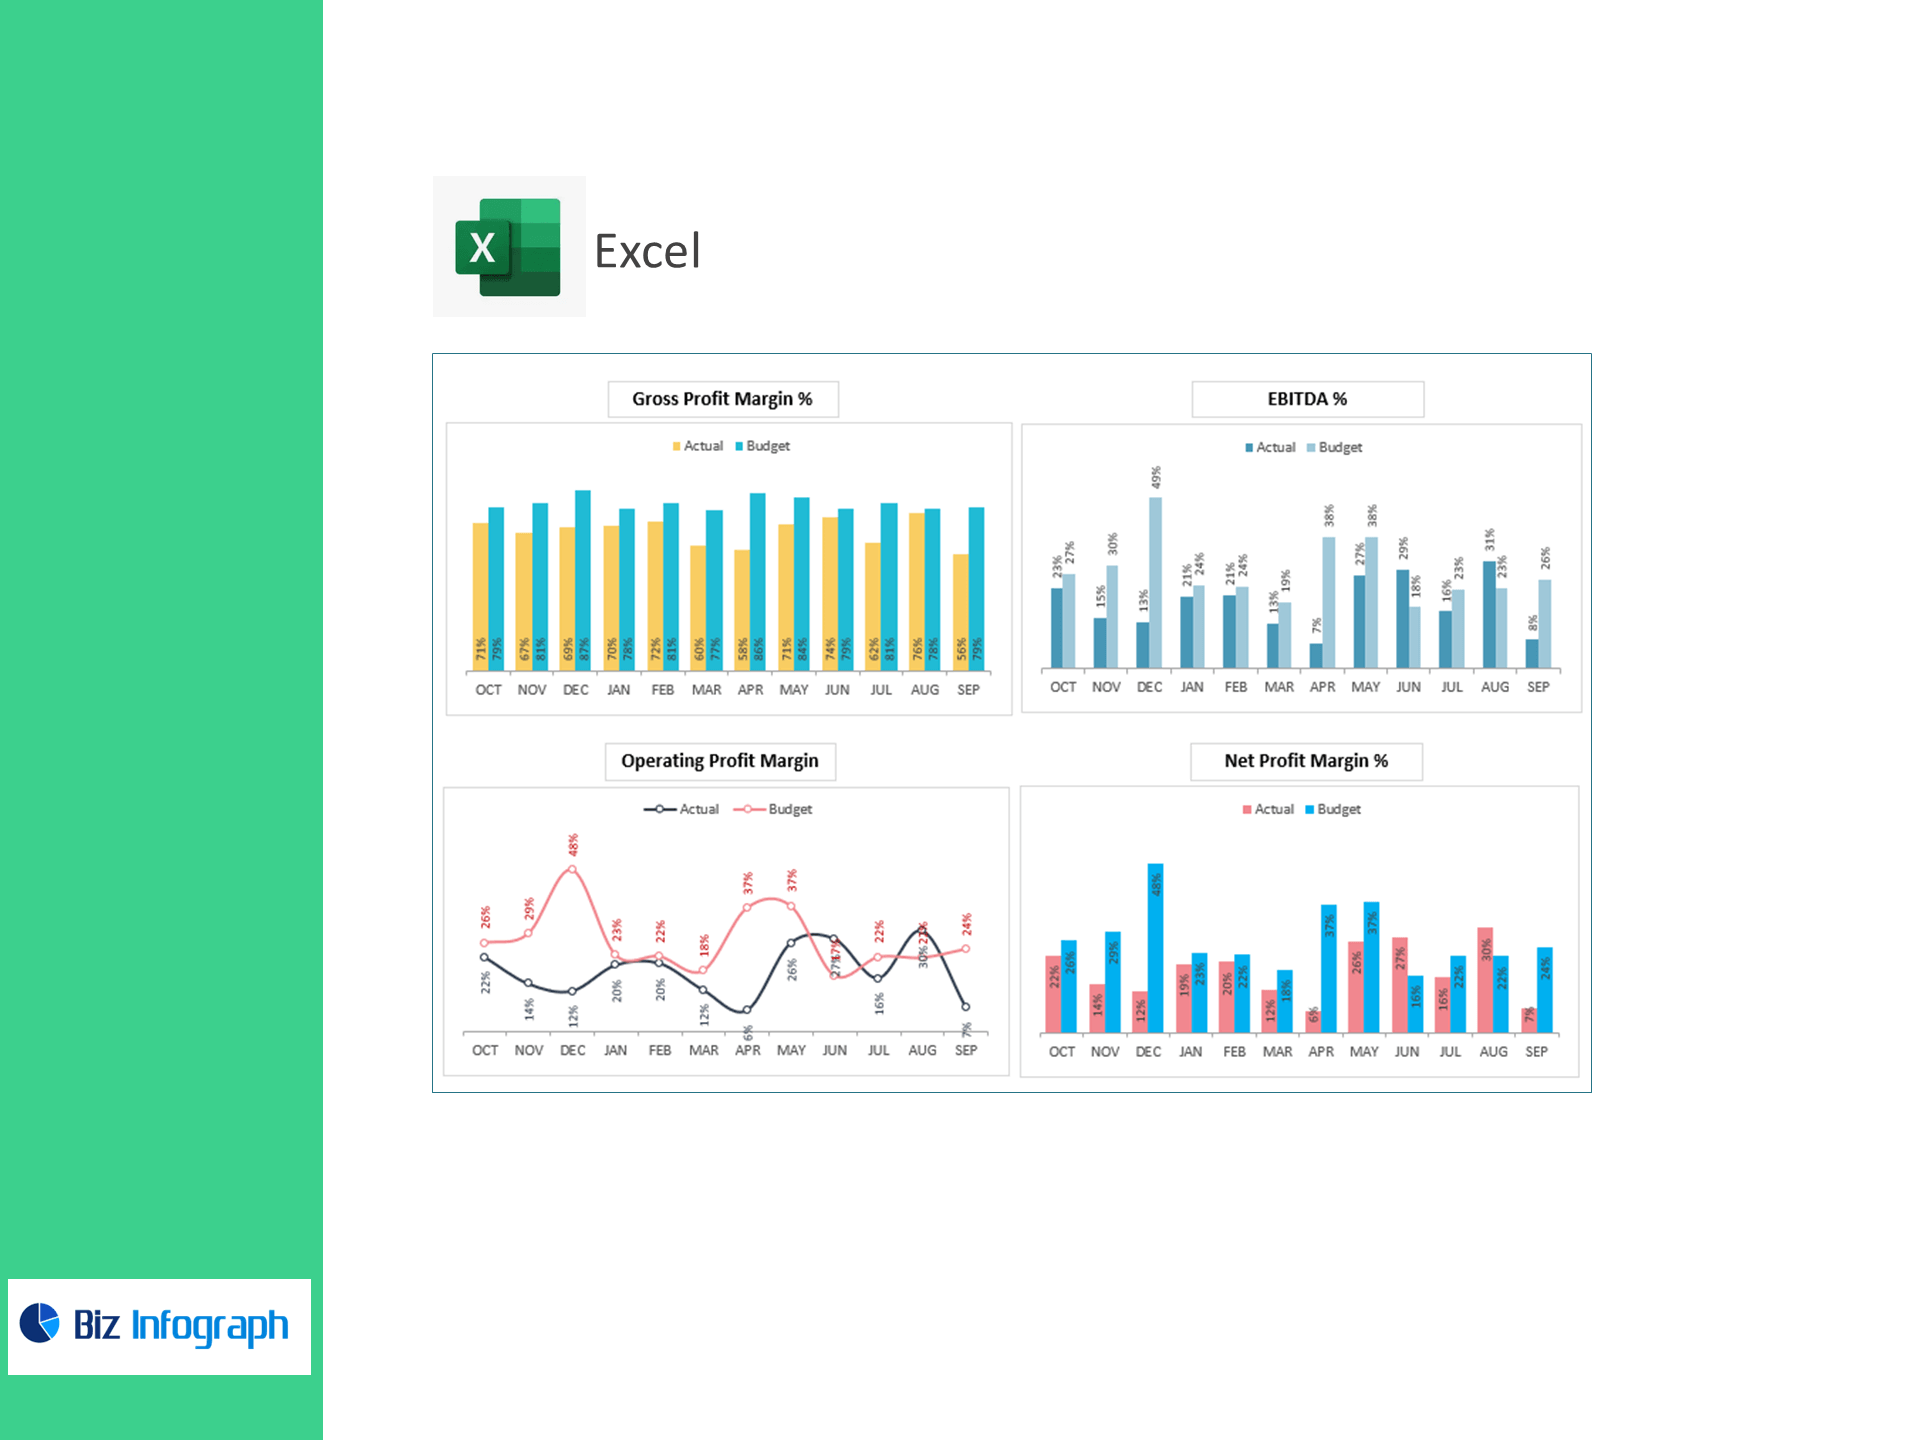
Gross Profit Margin %
-
Operating Profit Margin % (EBIT Margin)
-
EBITDA %
-
Net Profit Margin %
Performance Management
-
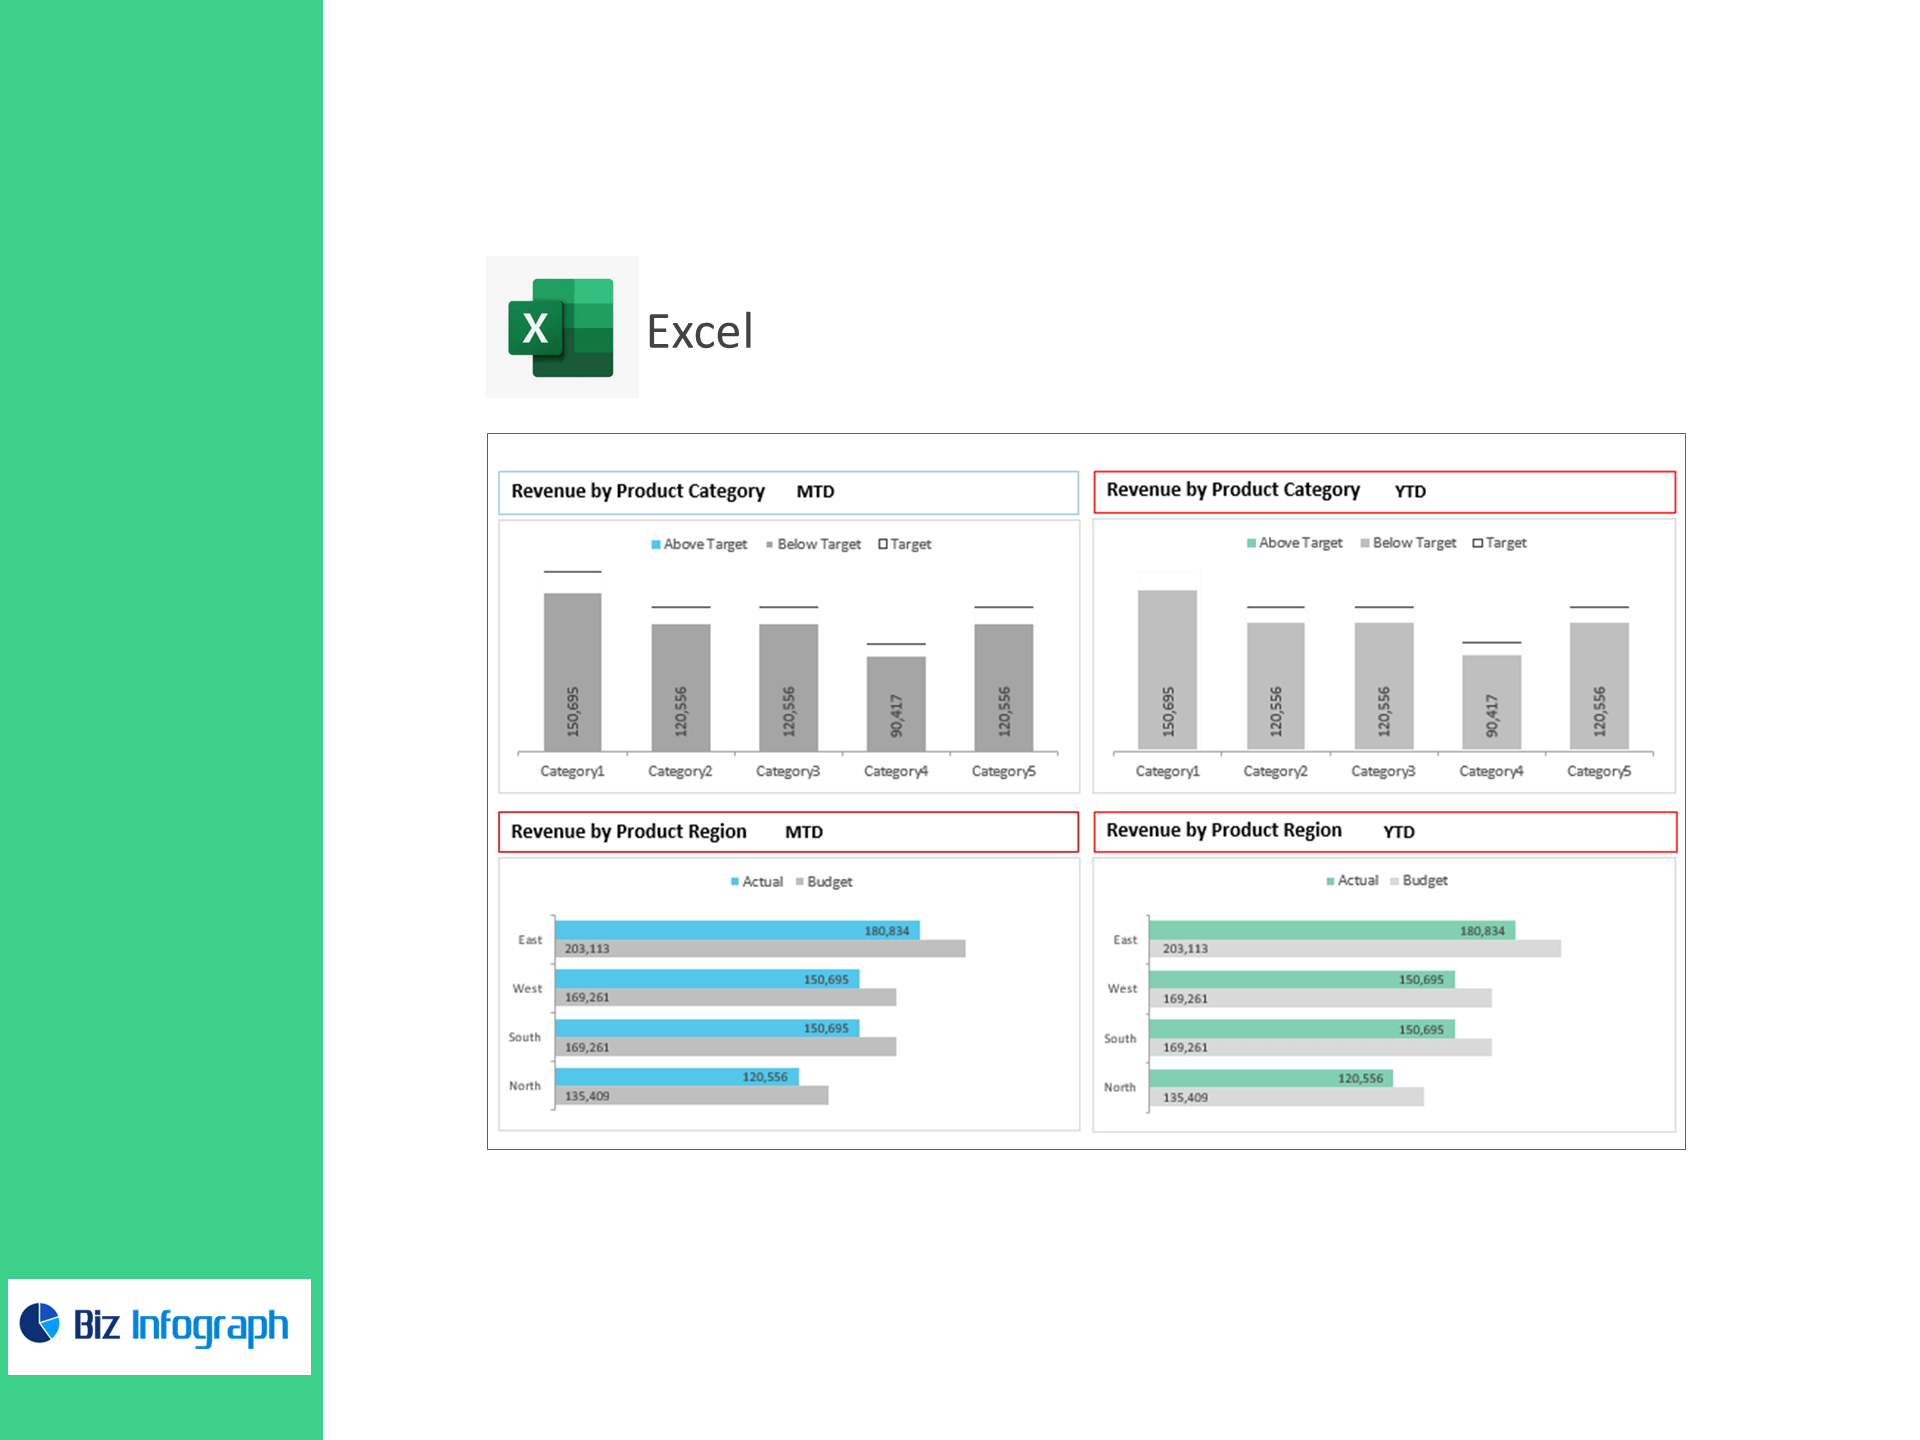
Target entry for each KPI
-
Above Target / Below Target status with variance bars and color cues
Inside the workbook
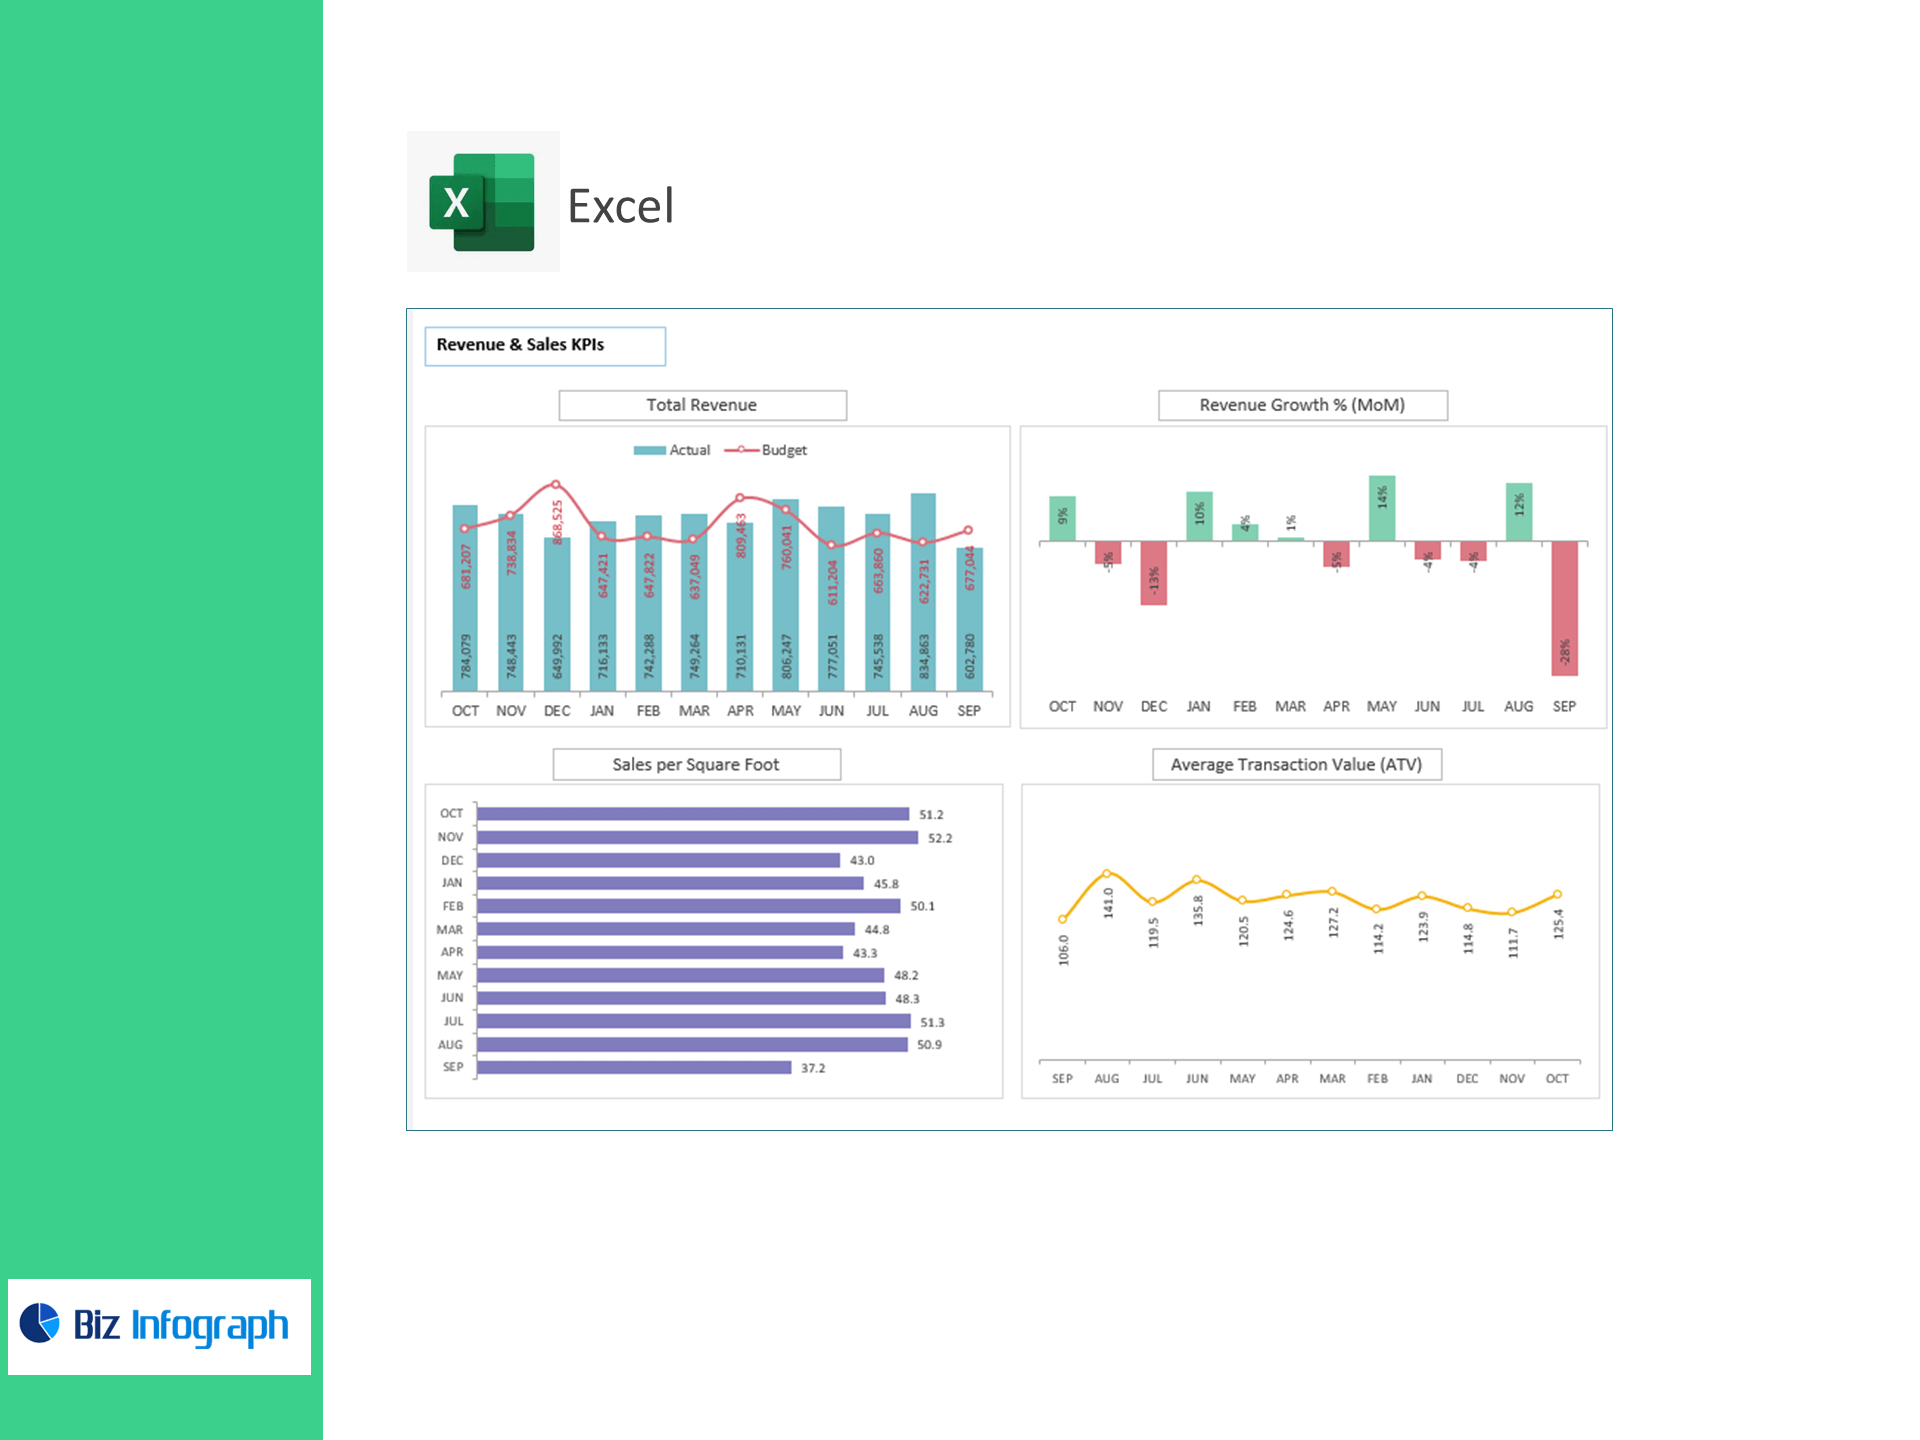
-
Executive Dashboard: High-level tiles for revenue, GP, EBIT, EBITDA, Net Profit, plus margin trends and target gaps.
-
Cost Structure View: COGS, payroll, rent & utilities, marketing, and G&A as % of revenue or total costs.
-
OPEX Tracker: Month-over-month changes and year-to-date rollups.
-
Targets & Assumptions: Set KPI targets once; the dashboard marks over/under performance automatically.
-
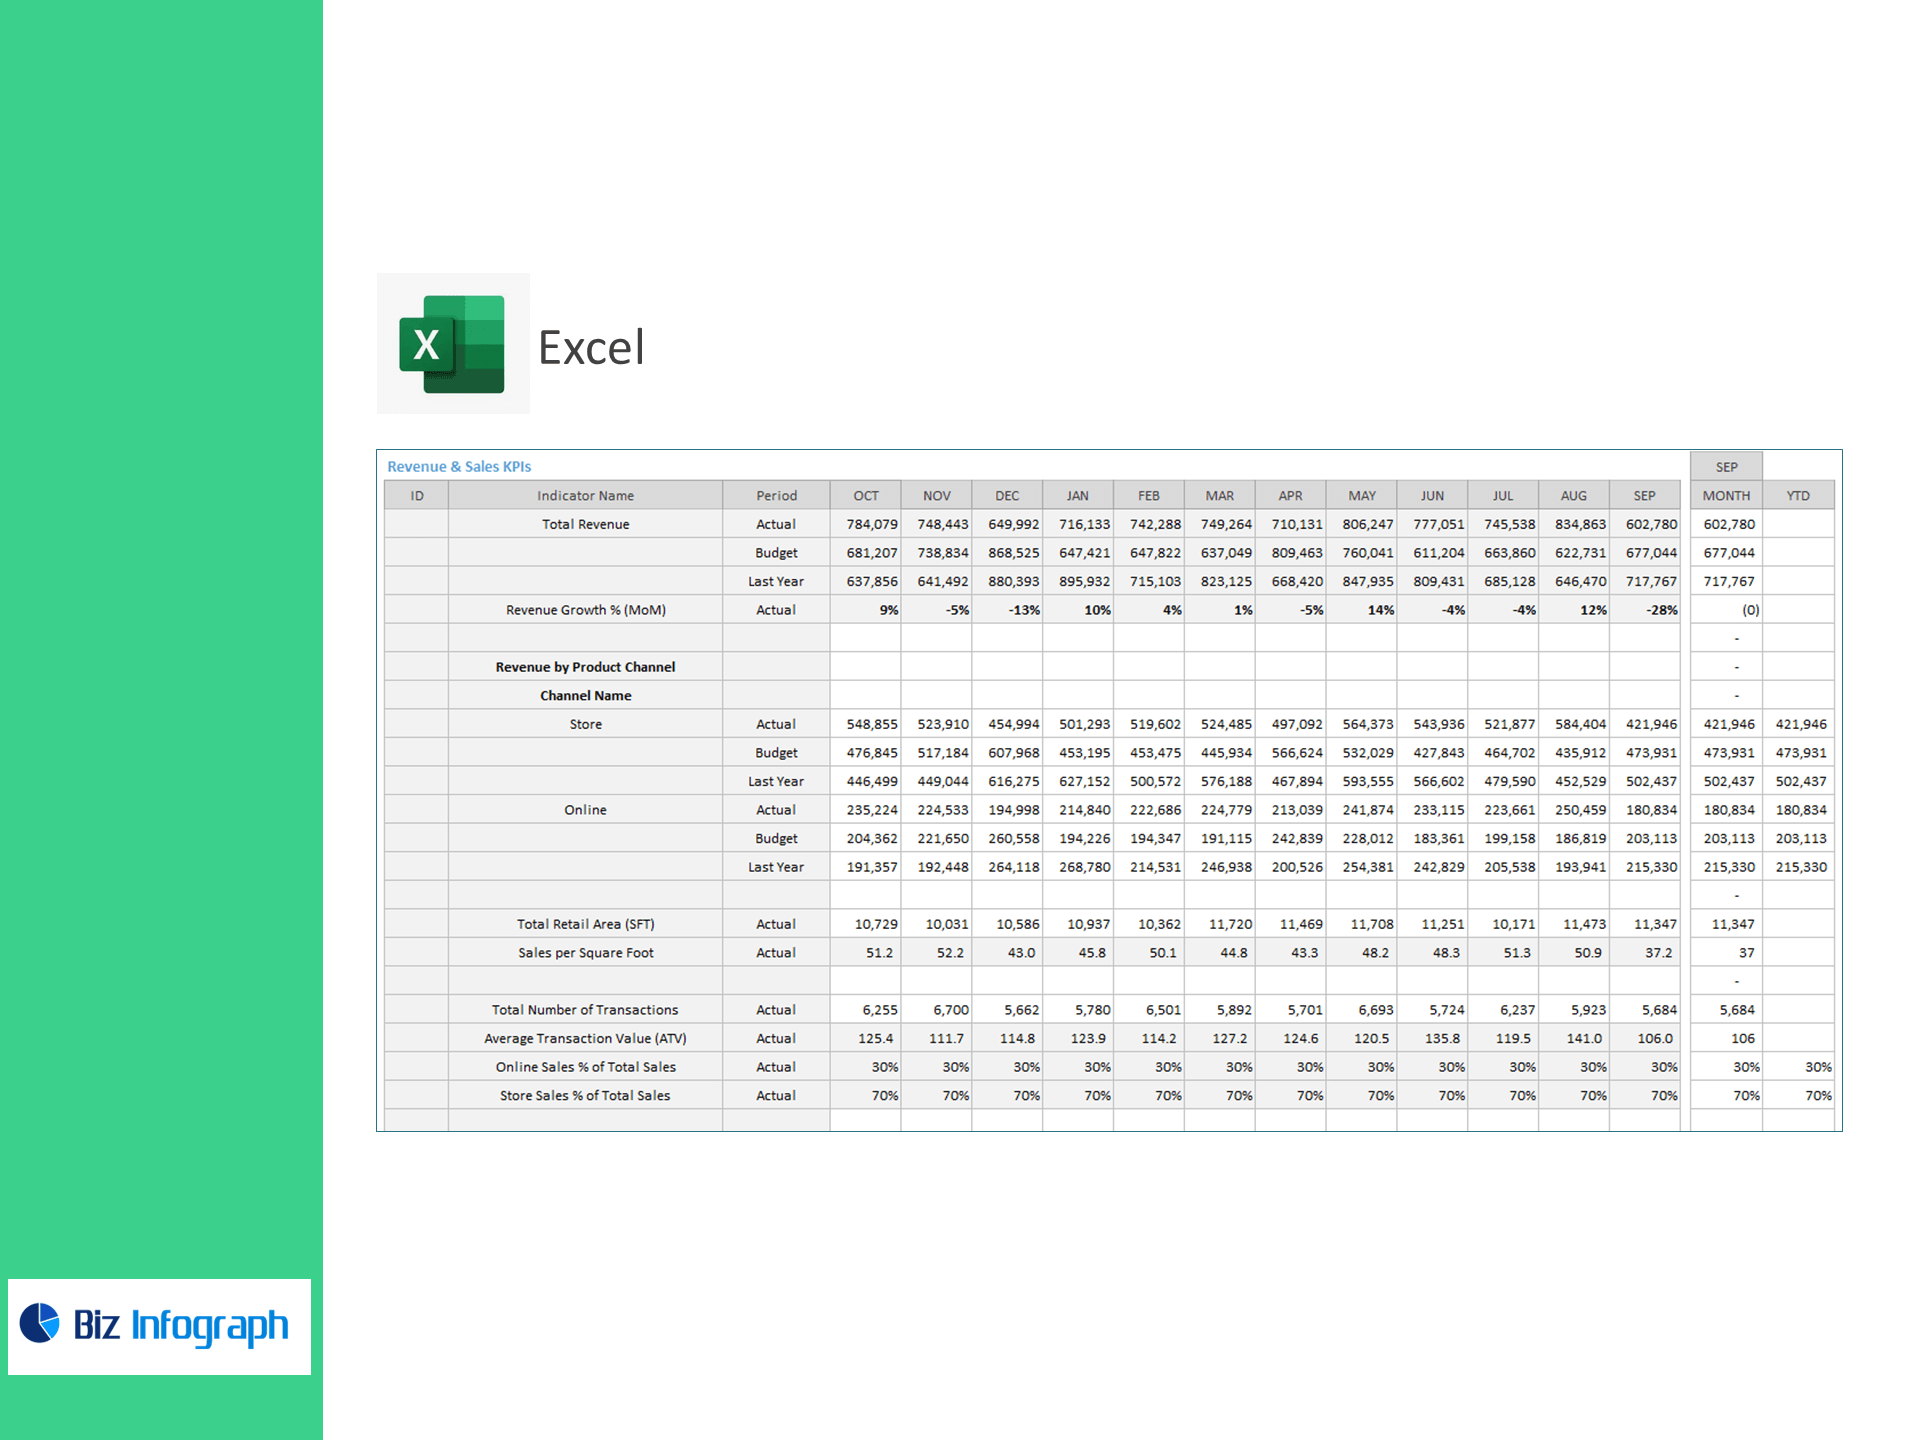
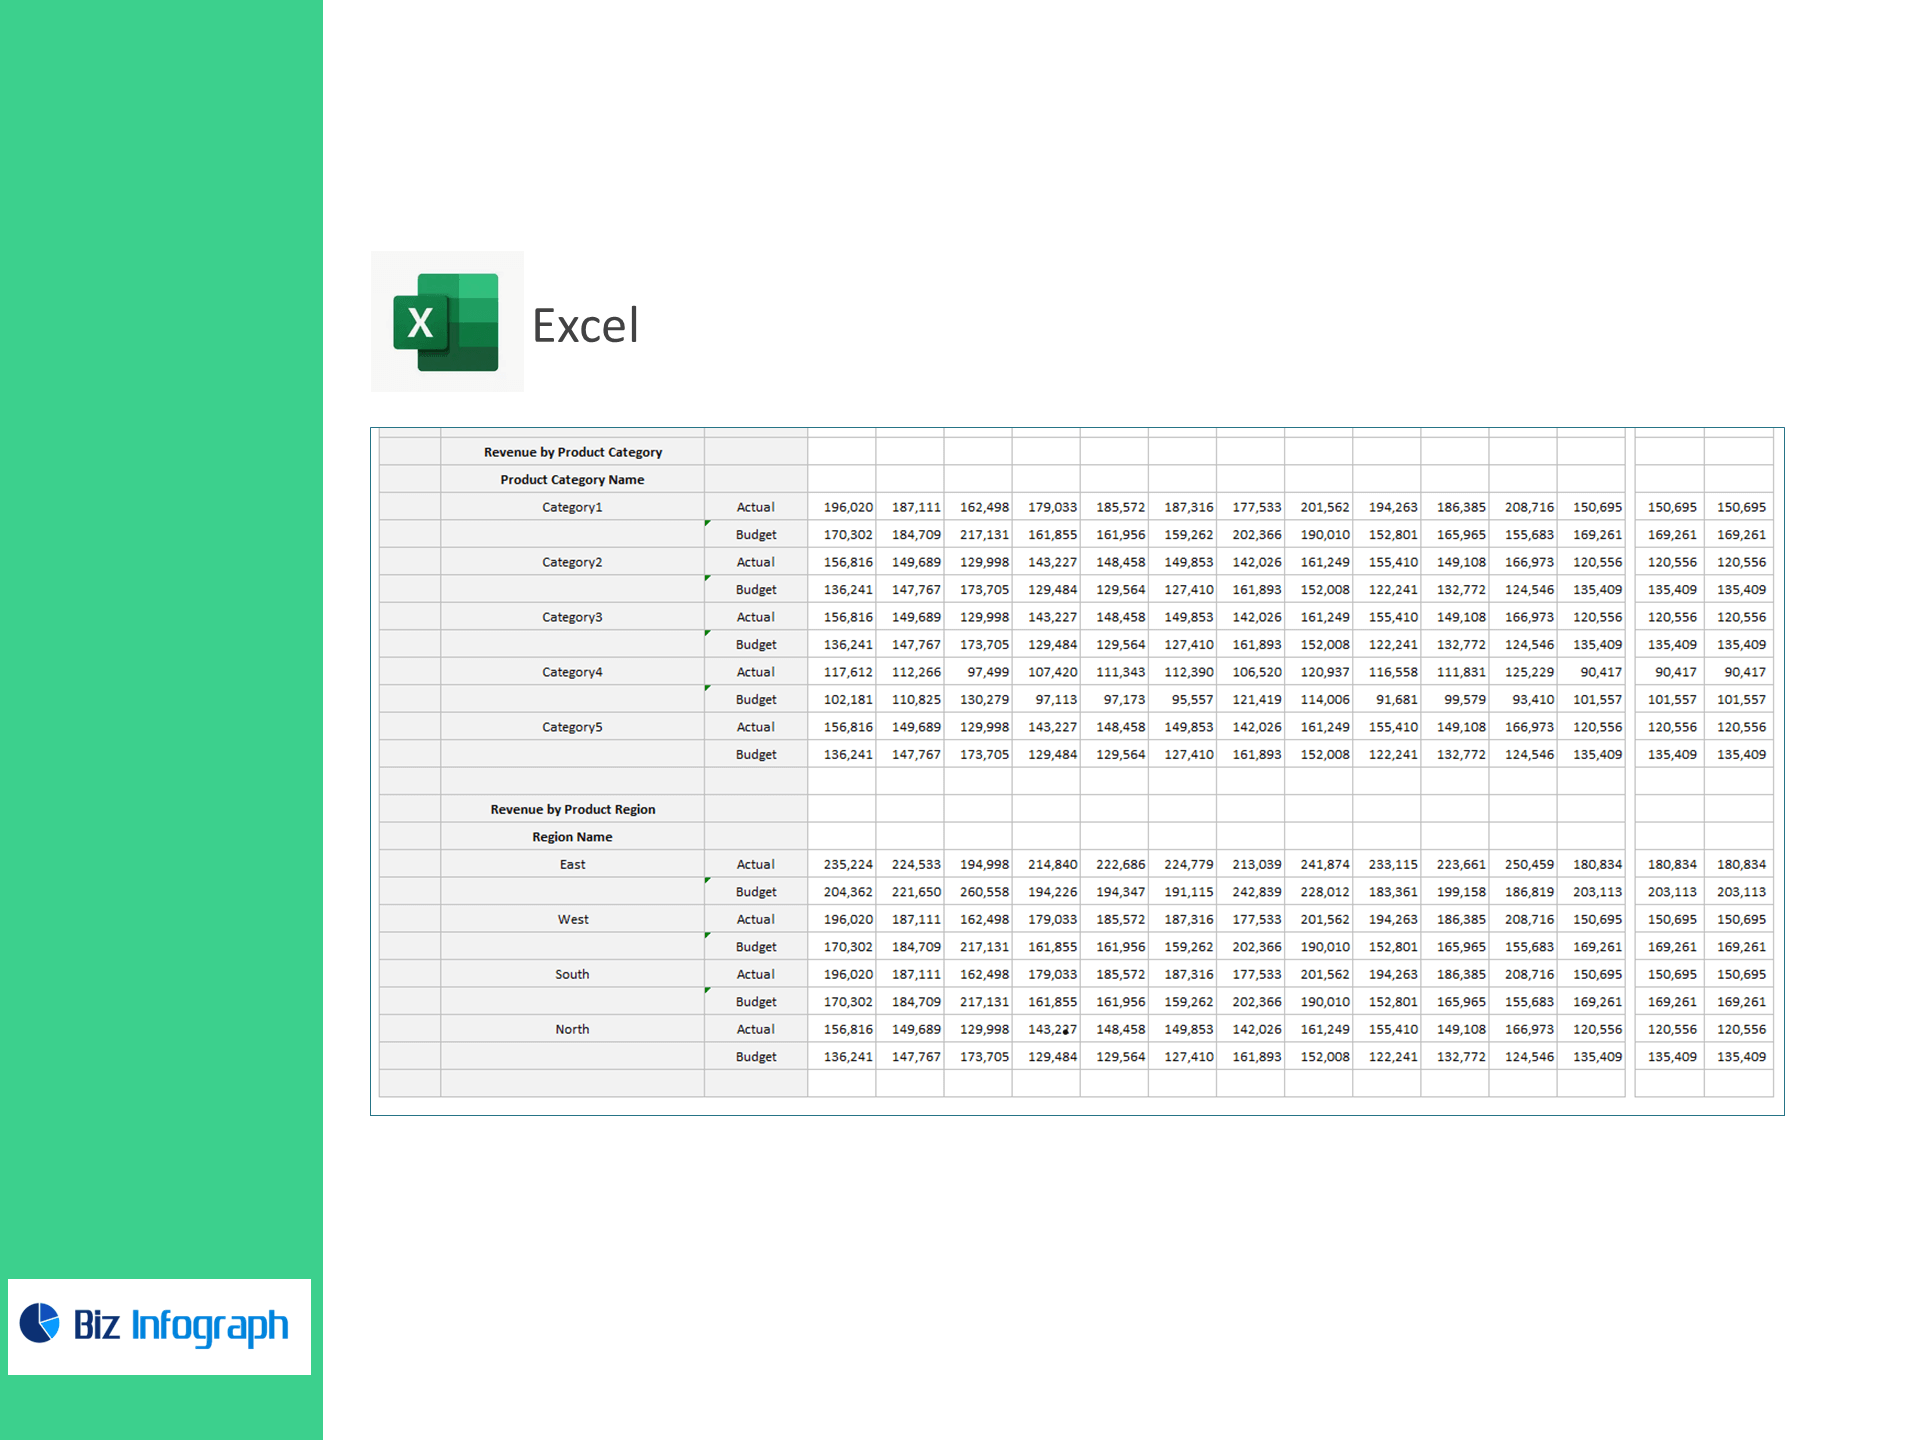
Data Sheets: Clean, import-ready tables for monthly income statement lines.
How it works
-
Paste your monthly income statement (or map your CSV) into the provided tables.
-
Set targets for margins and cost ratios.
-
Review instant visuals to identify savings, pricing opportunities, and scale levers.
Who it’s for
Retail owners, finance managers, FP&A teams, and operators who want accurate, fast profitability analysis in Excel without building a model from scratch.
Benefits
-
Protect margins: Keep COGS and payroll in check with live %-of-revenue tracking.
-
Control OPEX: Spot overspend in rent, marketing, and G&A before it hits cash flow.
-
Investor-ready: Present EBIT, EBITDA, and Net Profit with clear variance to target.
-
Decide faster: One source of truth for store and eCommerce performance.
For ready-to-use Dashboard Templates: