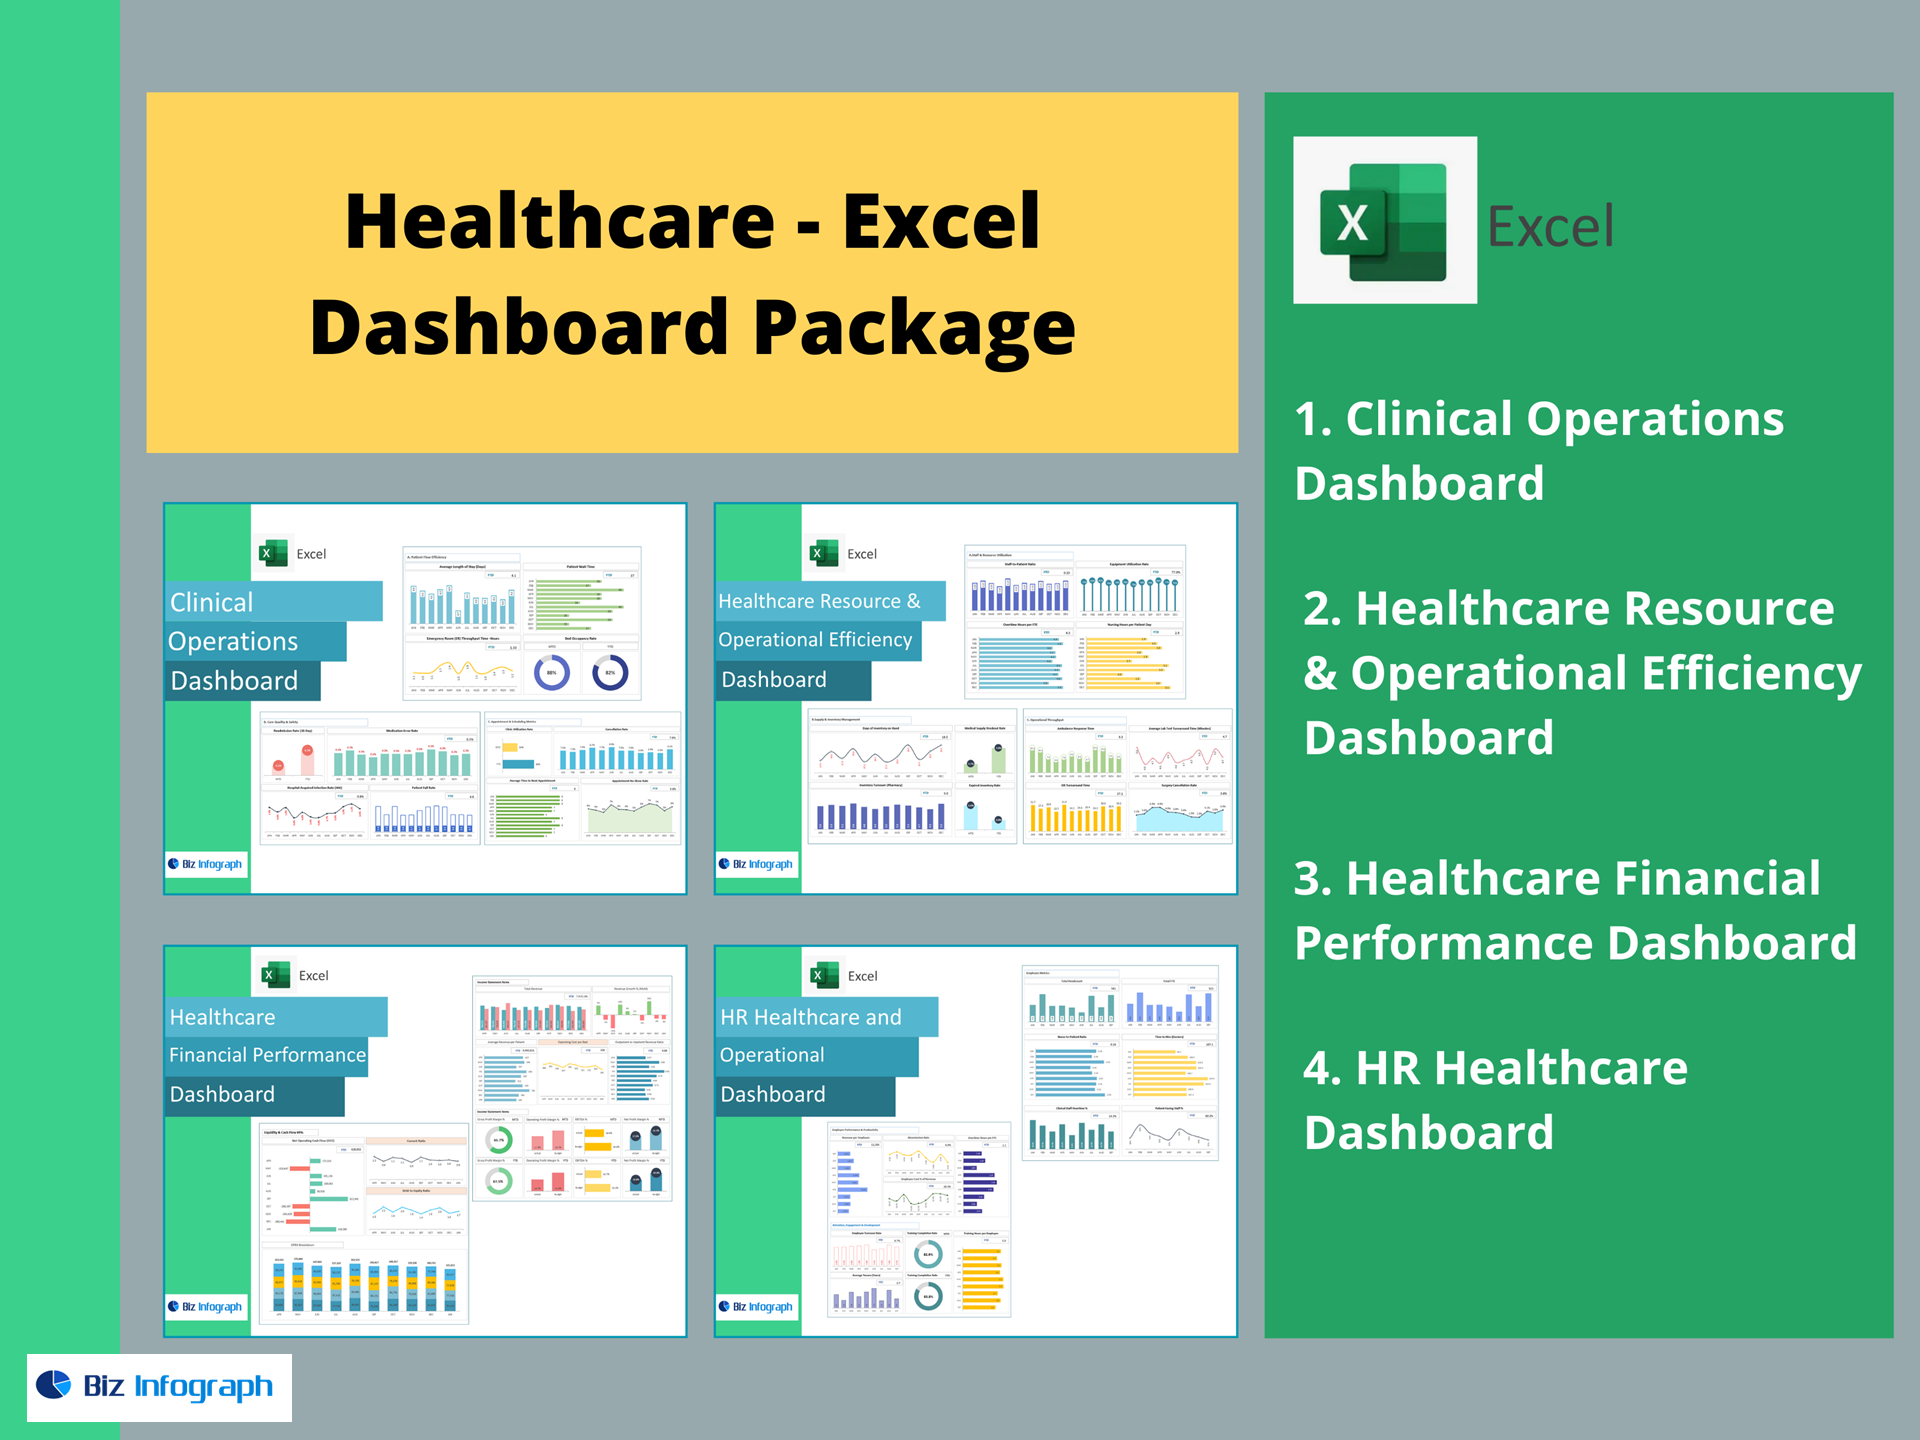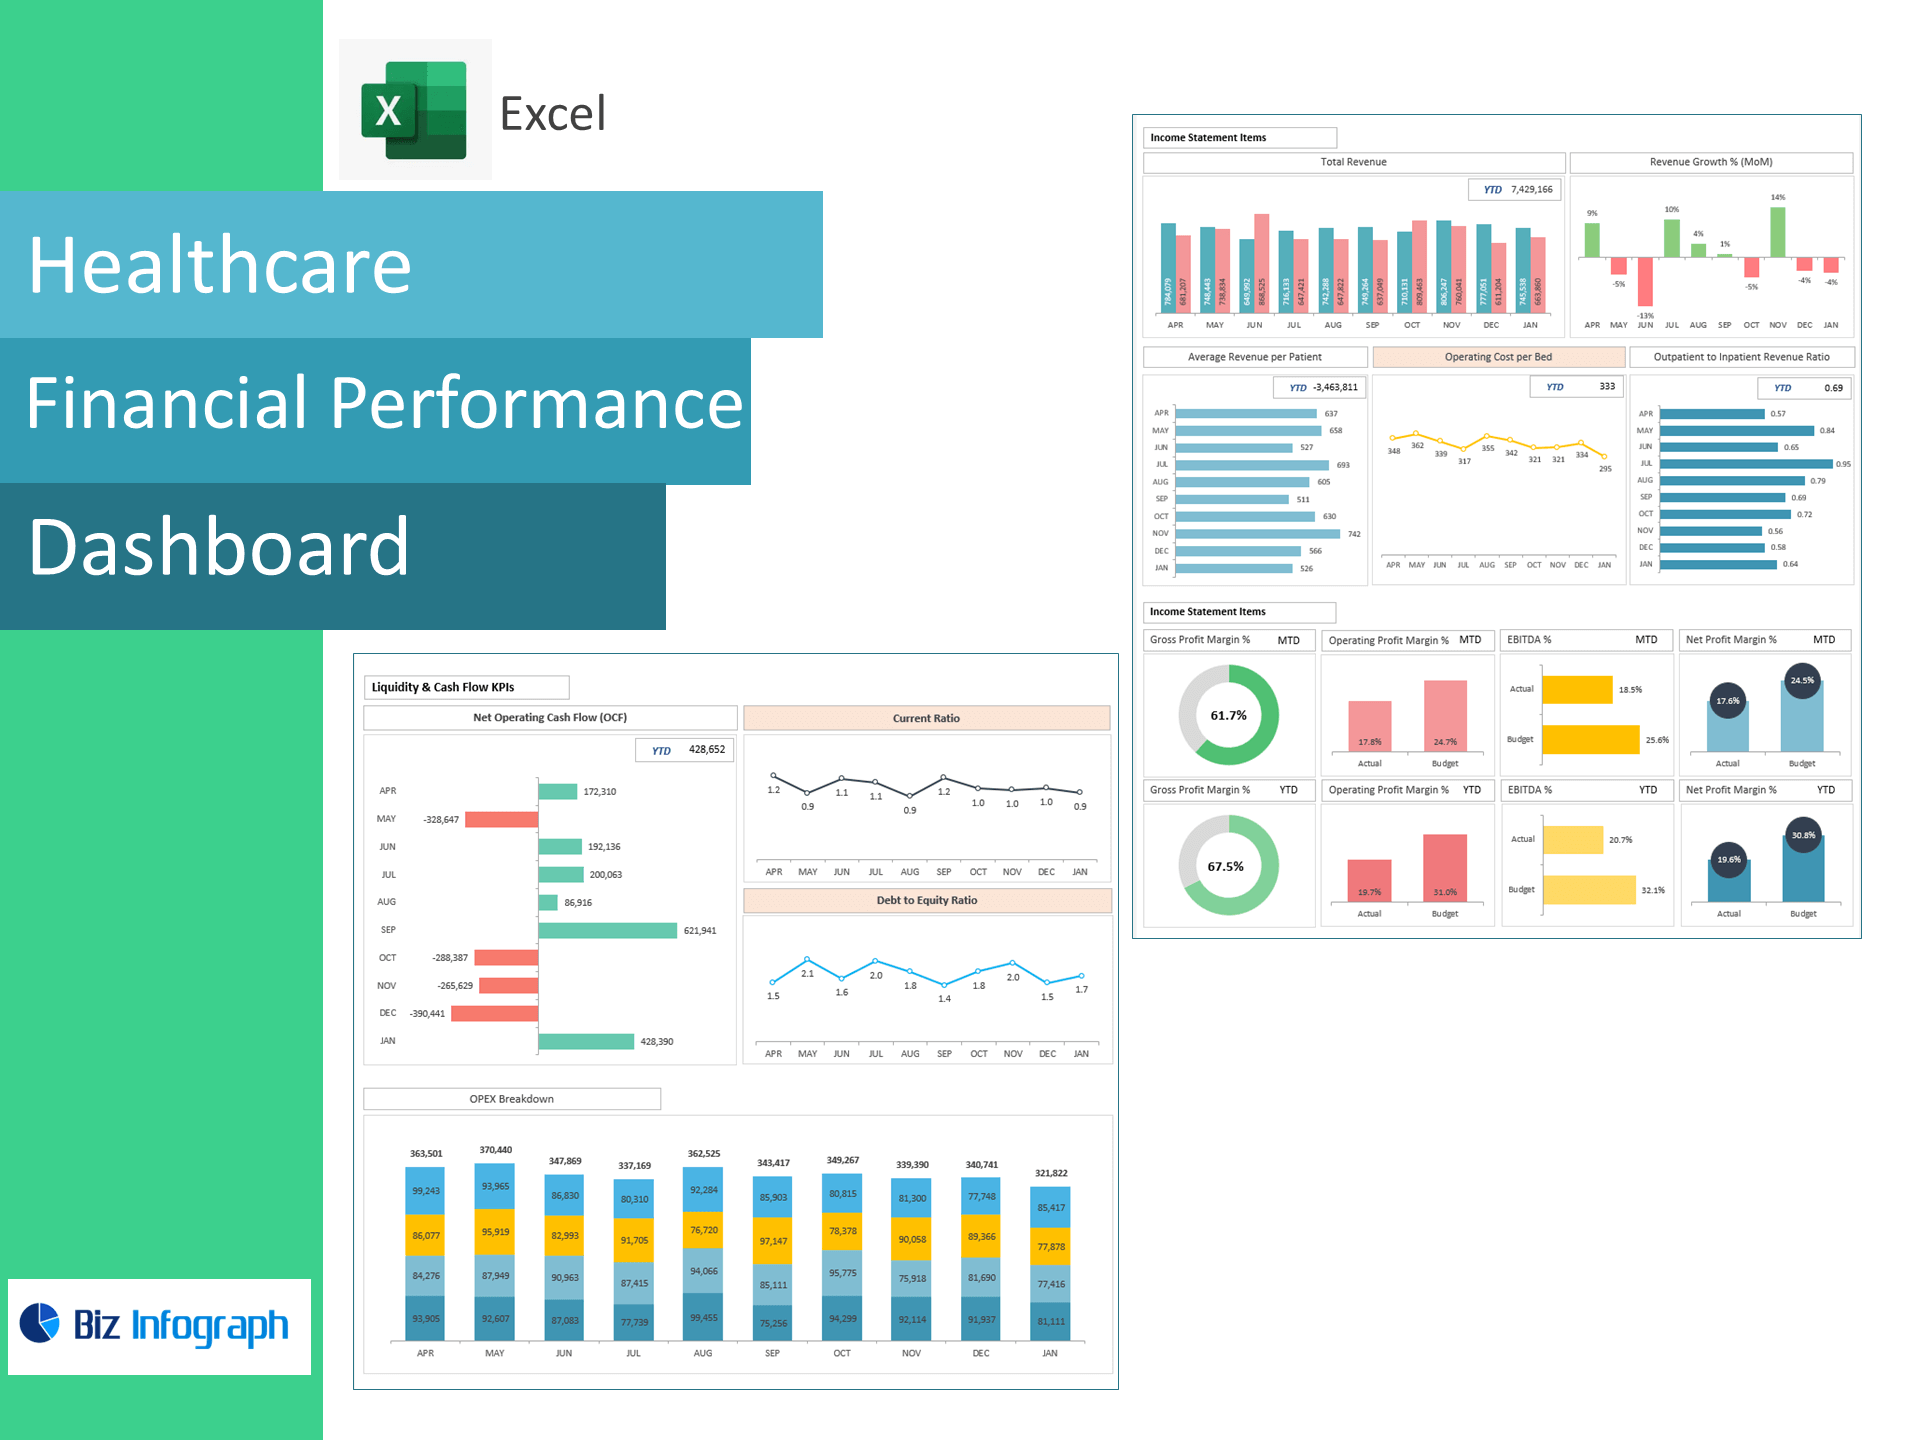
Healthcare Financial Performance Dashboard — Excel Template
Track margins, cash flow, and unit economics—directly in Excel. Built for hospitals, clinics, and health systems, this template converts monthly financials into a board-ready dashboard showing Revenue Growth, GP/EBIT/EBITDA/Net Profit, OCF, Current Ratio, Debt-to-Equity, Avg. Revenue per Patient, Operating Cost per Bed, and Outpatient:Inpatient revenue mix—so finance and operations can protect cash and improve returns.
Why providers choose this template
-
Finance + ops in one view: Income statement, liquidity, and care delivery economics consolidated.
-
Actionable margin control: Spot OPEX creep and see its impact on EBIT/EBITDA and Net Profit.
-
Service-line clarity: Compare outpatient vs inpatient revenue and unit costs to guide strategy.
-
Excel-native: Paste data and go—no add-ins or BI setup.
KPIs included (ready-made formulas)
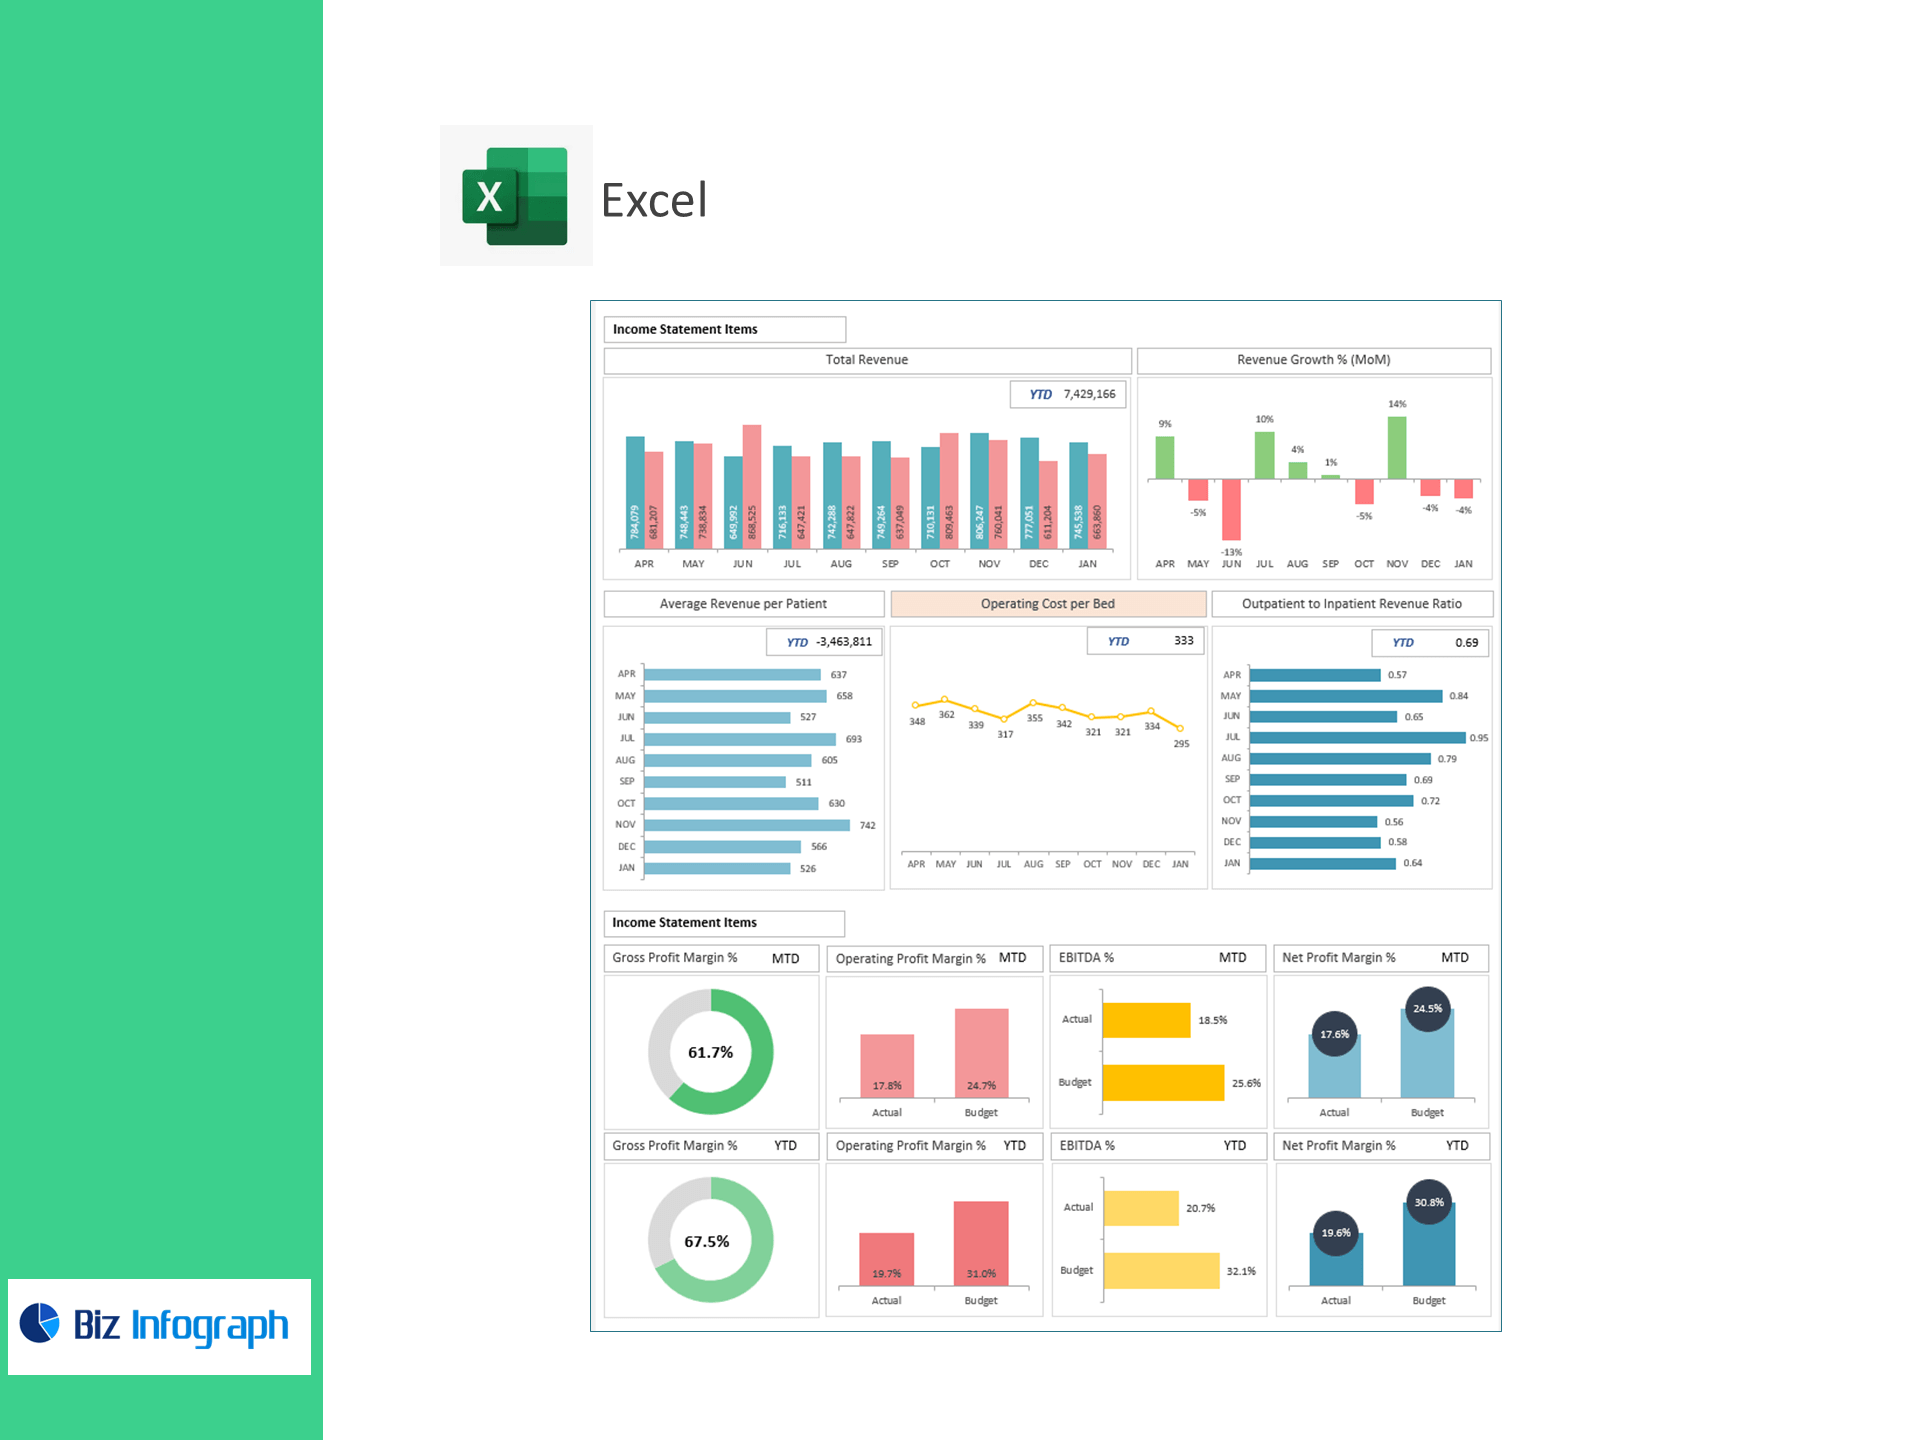
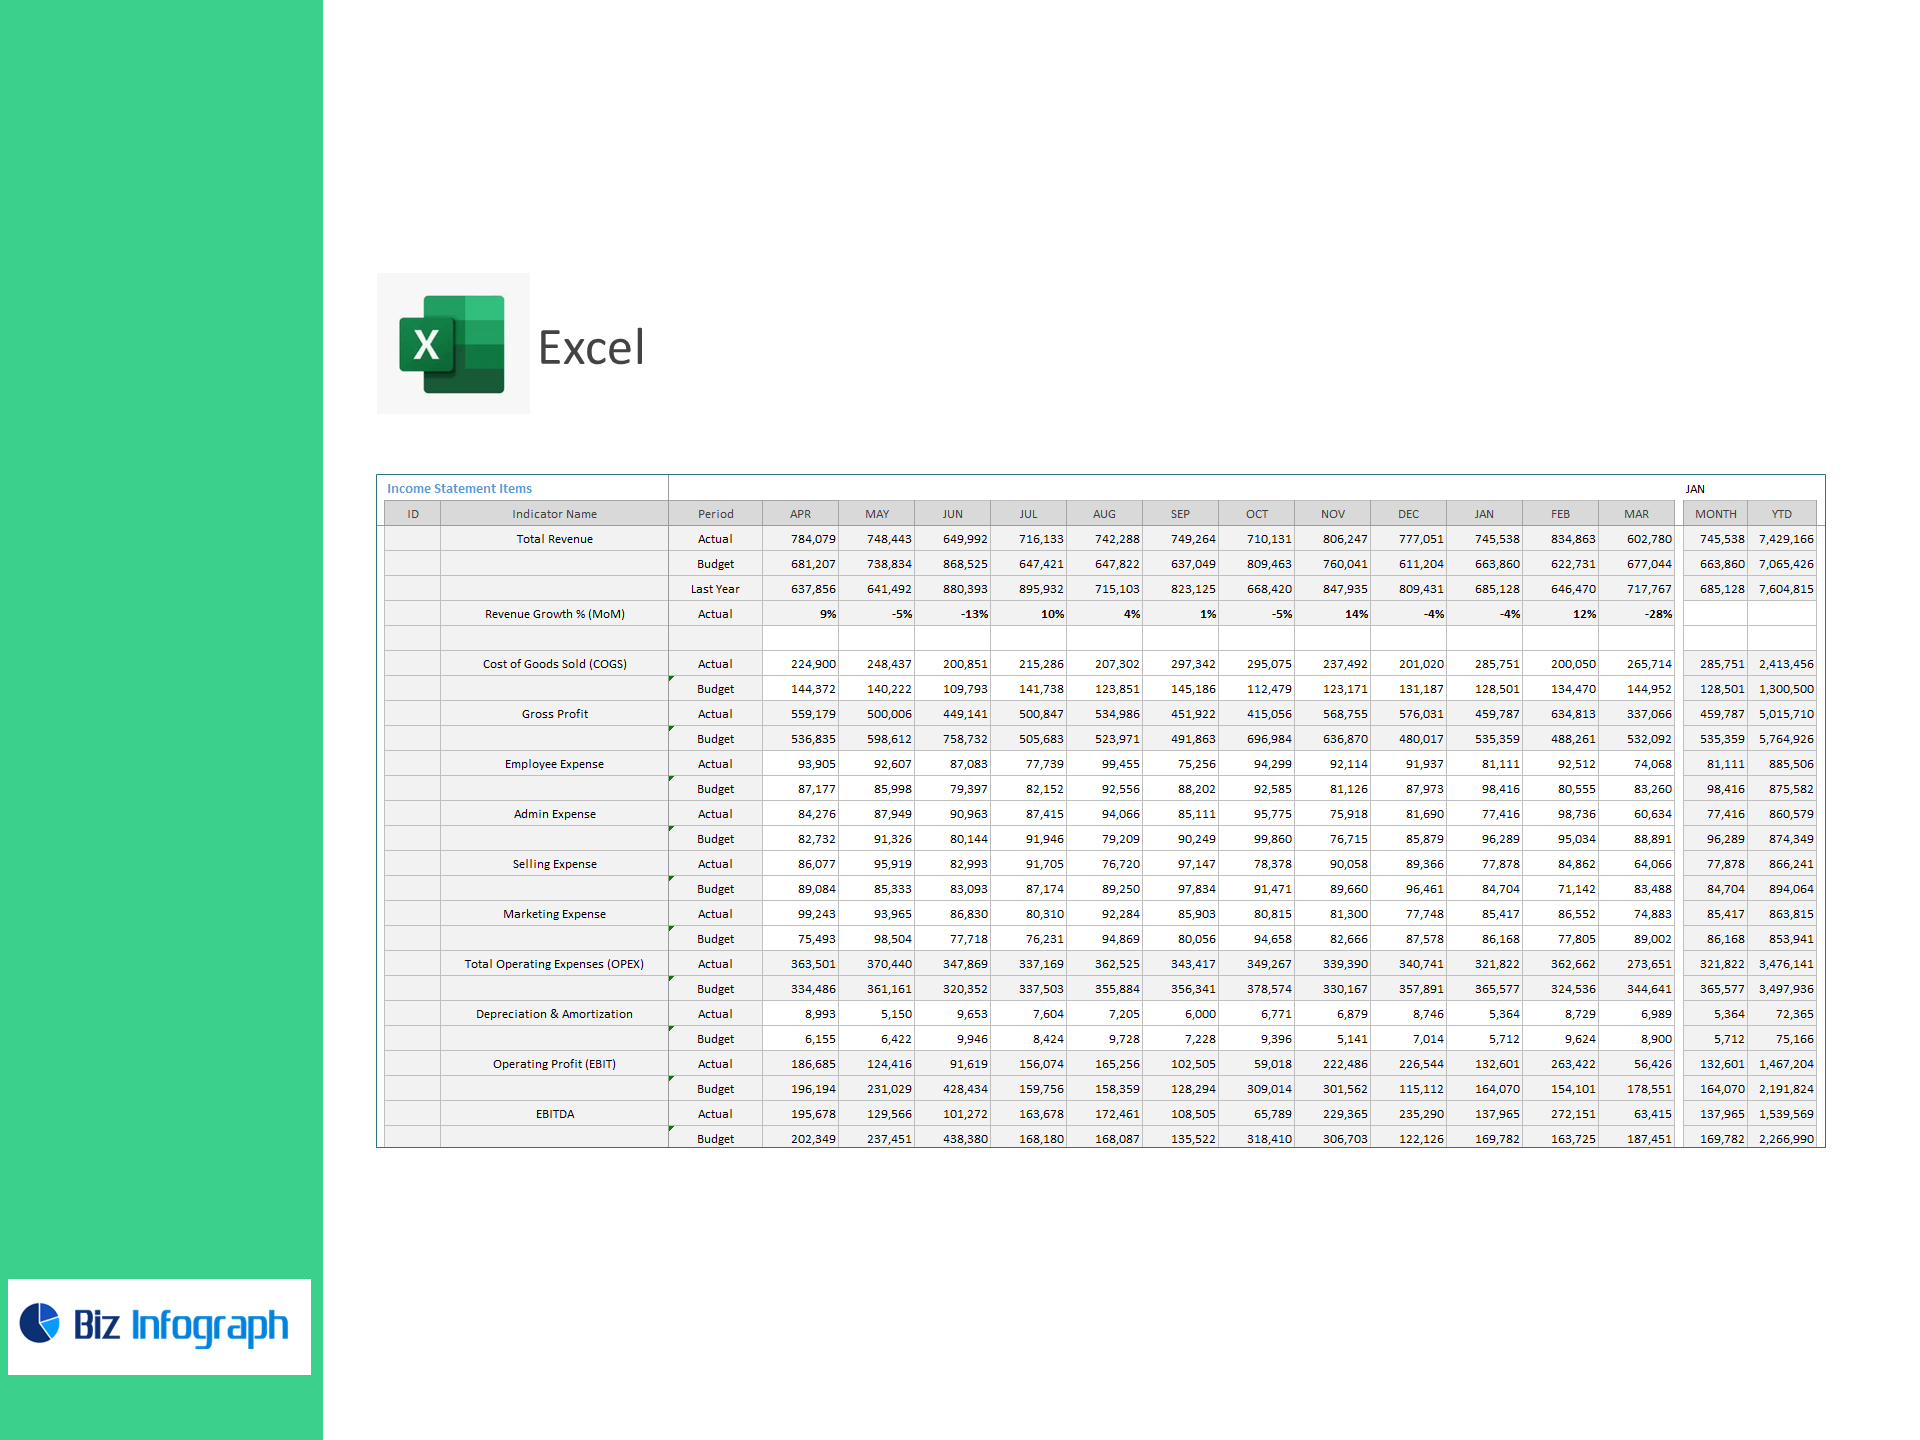
Income Statement
-
Total Revenue, Revenue Growth % (MoM)
-
COGS, Gross Profit
-
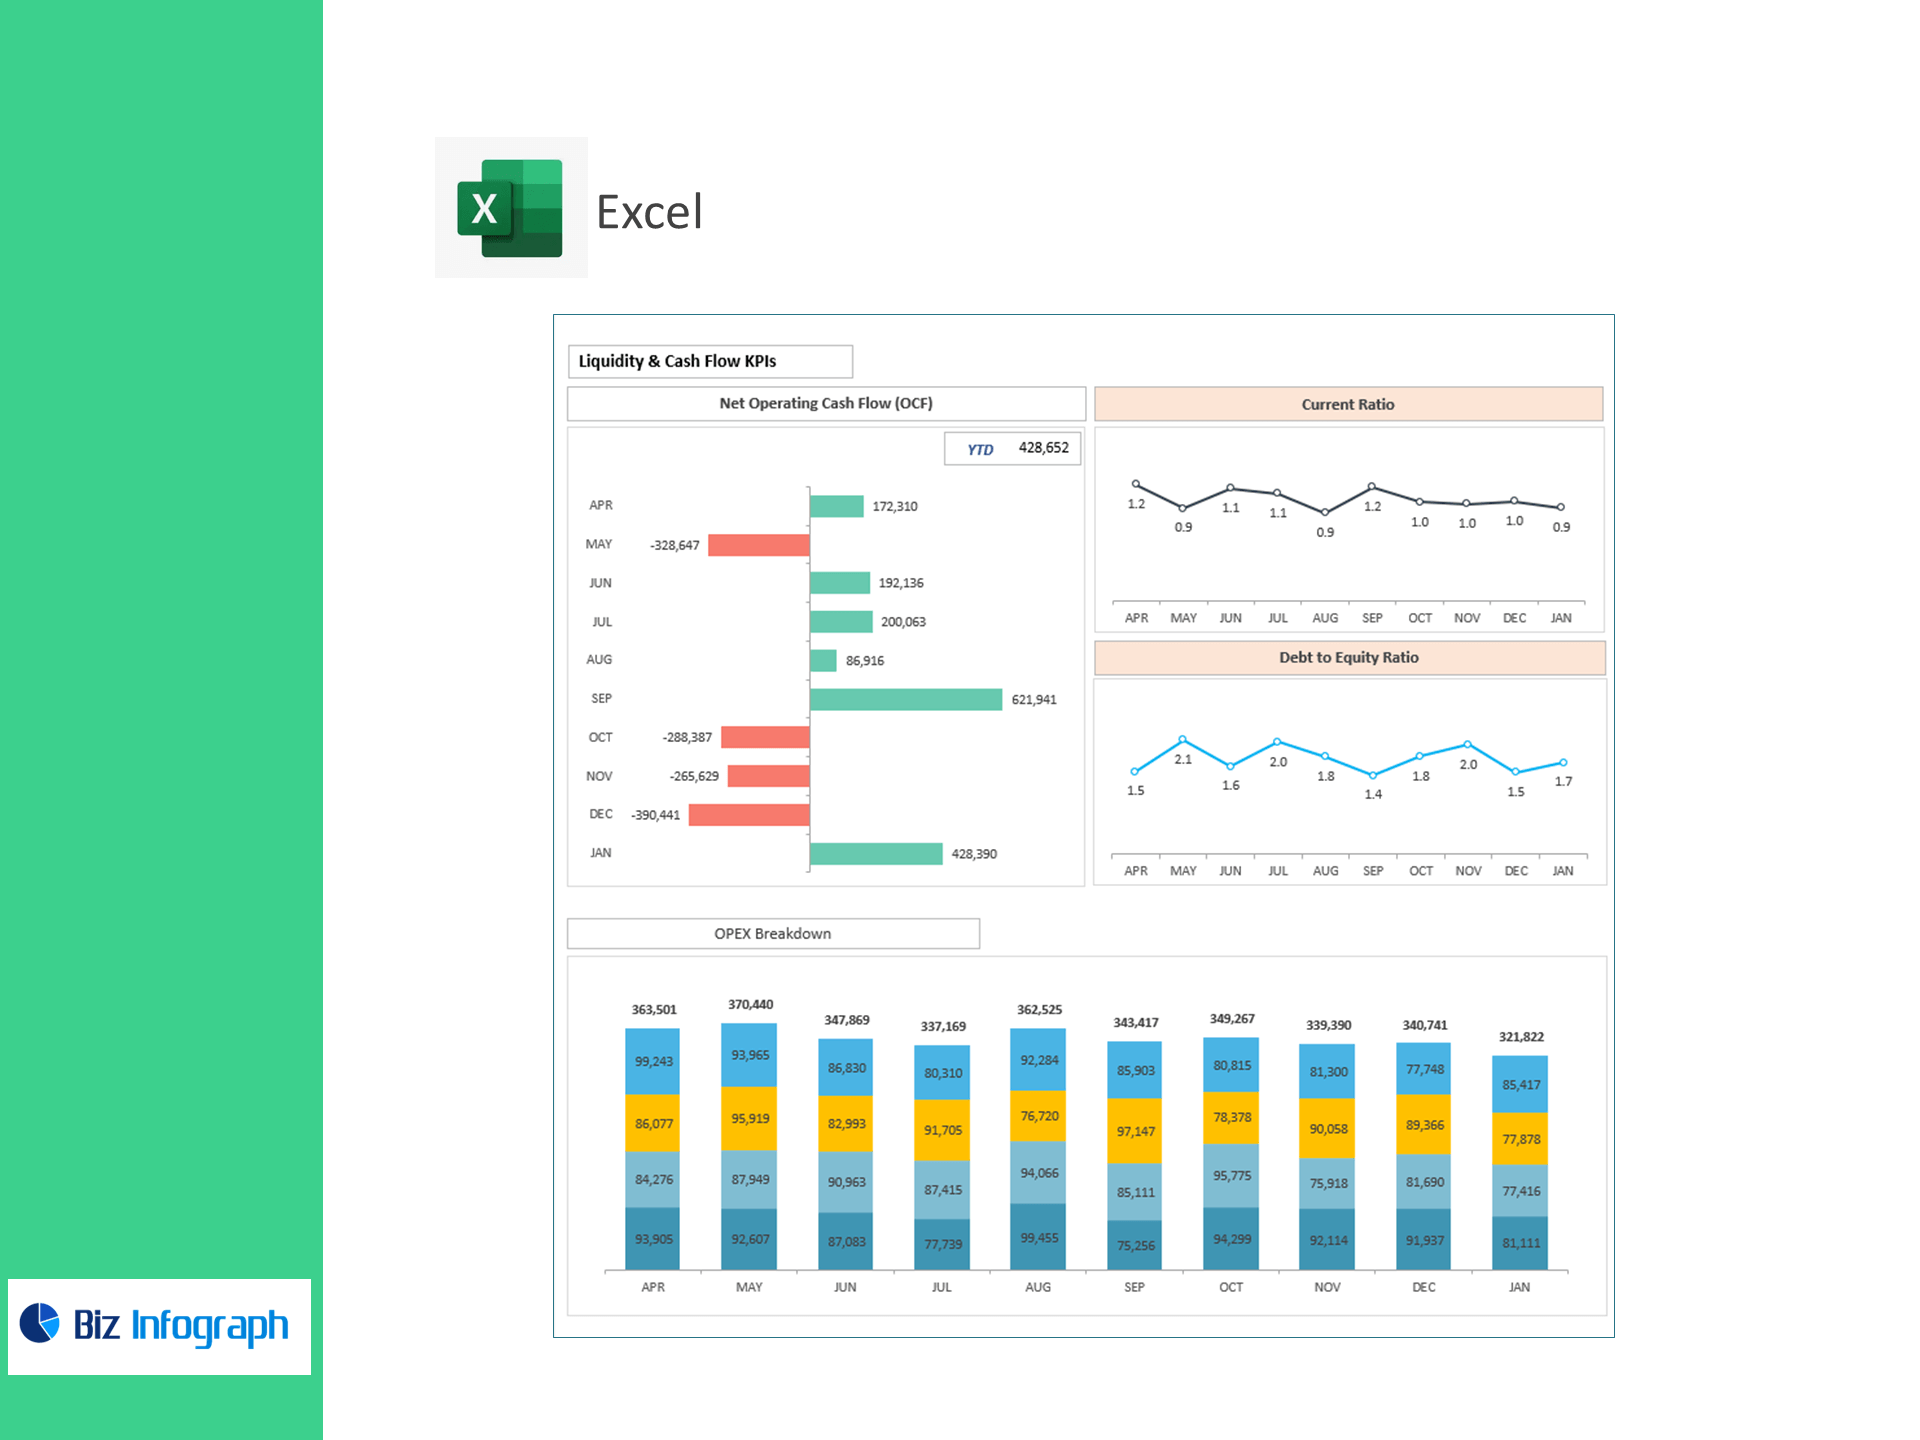
Employee, Admin, Selling, Marketing Expense → Total OPEX with OPEX Breakdown
-
Depreciation & Amortization
-
Operating Profit (EBIT), EBITDA, Interest, Other Inc/(Exp), Taxes, Net Profit
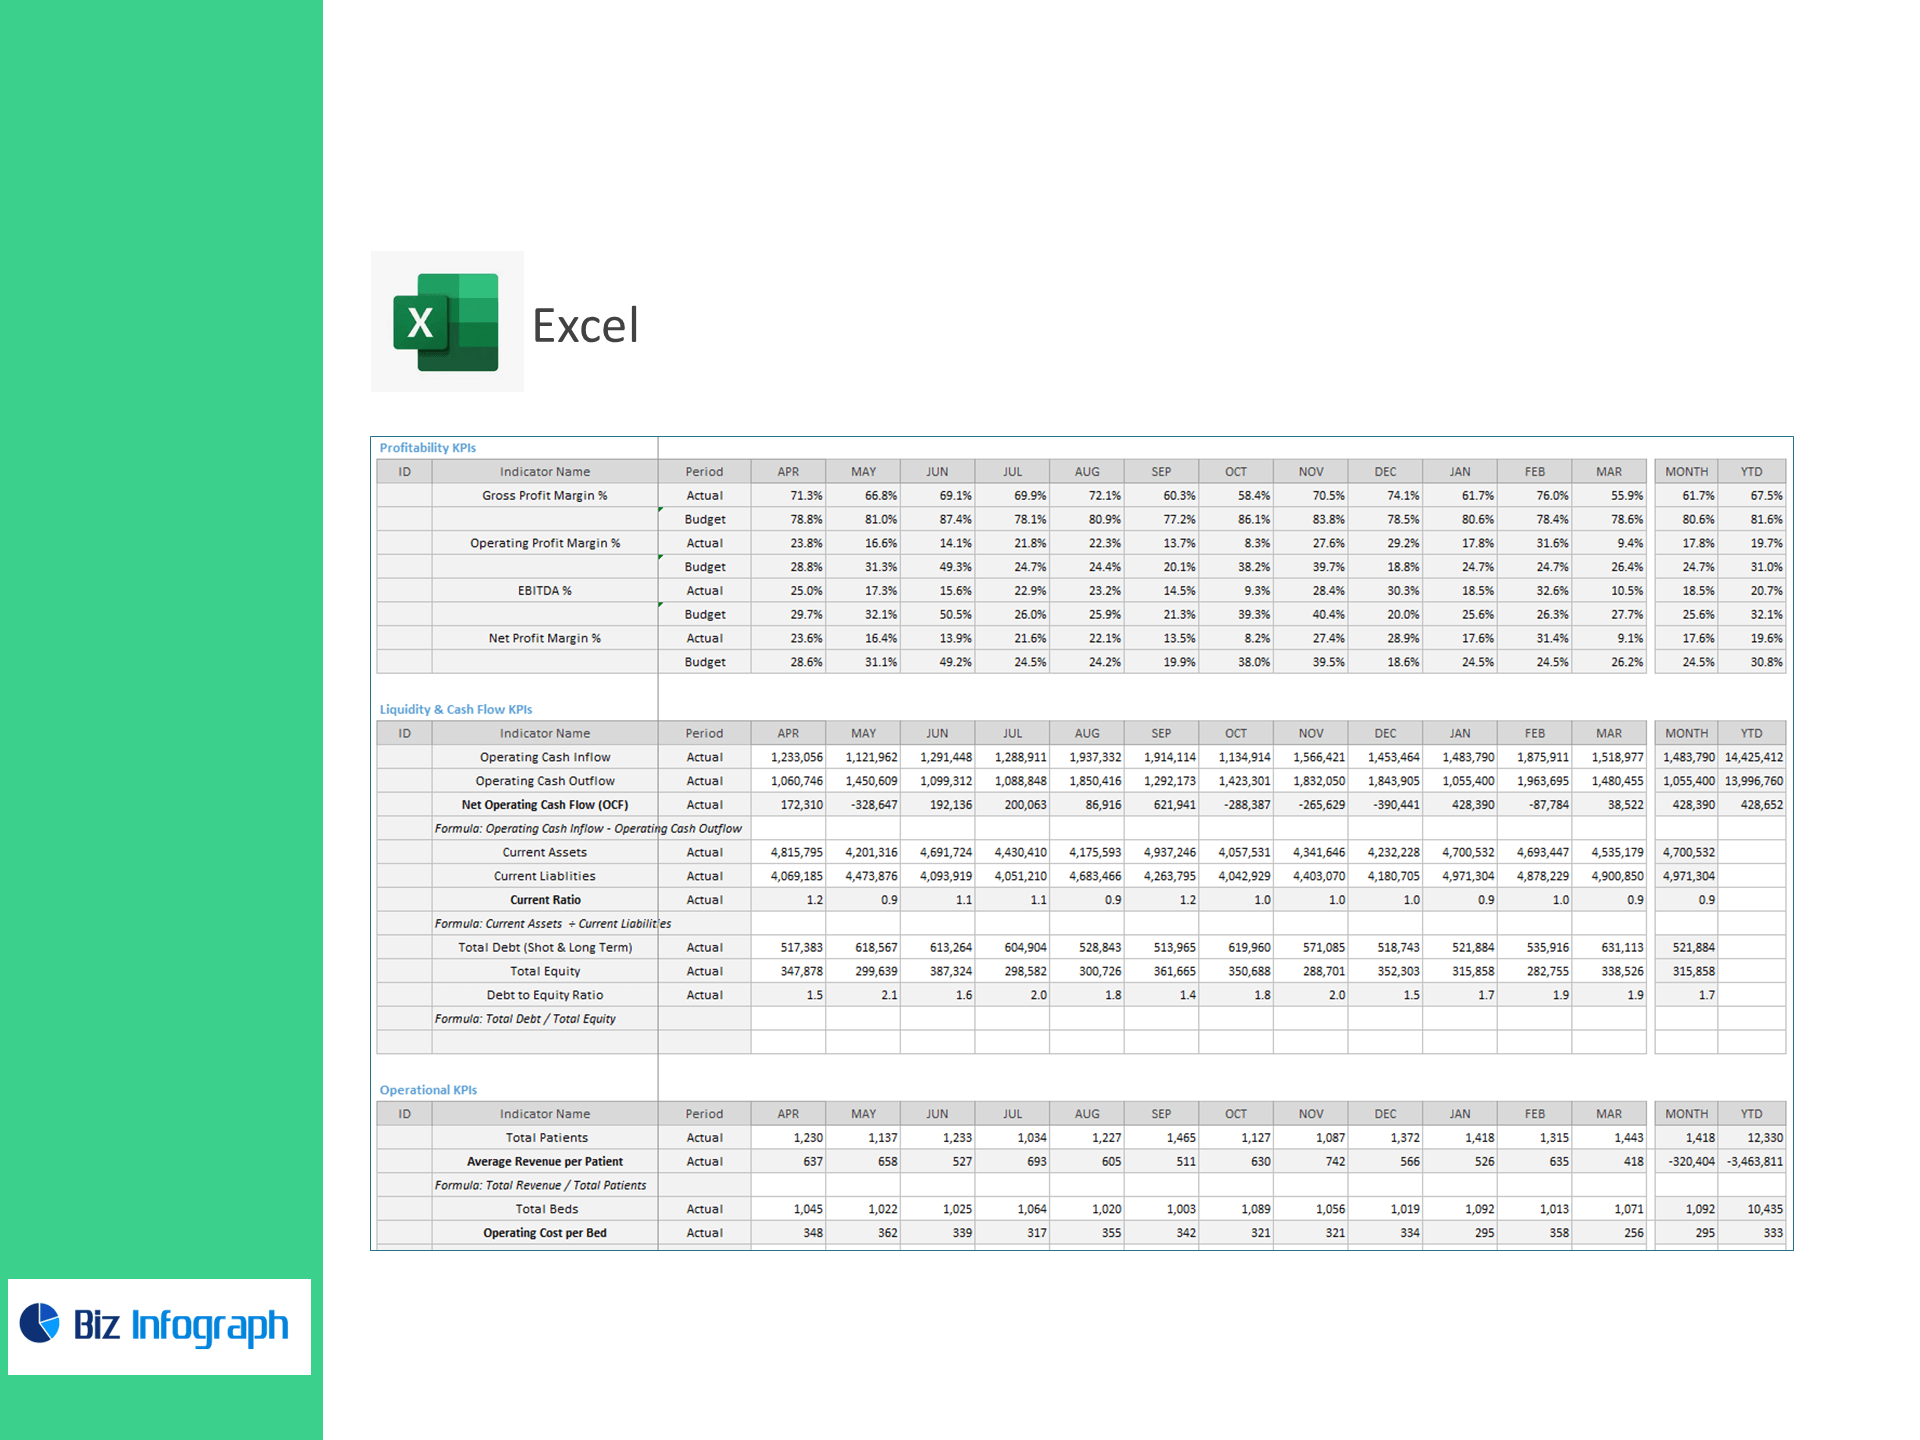
Profitability
-
Gross Profit Margin %
-
Operating Profit Margin % (EBIT Margin)
-
EBITDA %
-
Net Profit Margin %
Liquidity & Cash Flow
-
Operating Cash Inflow/Outflow → Net Operating Cash Flow (OCF) = Inflow − Outflow
-
Current Assets, Current Liabilities → Current Ratio = CA ÷ CL
-
Total Debt, Total Equity → Debt-to-Equity = Debt ÷ Equity
Operational (Healthcare)
-
Average Revenue per Patient = Total Revenue ÷ Total Patients
-
Operating Cost per Bed = Total Operating Costs ÷ Total Beds
-
Outpatient to Inpatient Revenue Ratio = Outpatient Revenue ÷ Inpatient Revenue
What’s inside
-
Executive Dashboard: Tiles for Revenue Growth, GP/EBIT/EBITDA/Net Profit, OCF, Current Ratio, D/E, Avg. Rev/Patient, Cost/Bed, and OP:IP mix—with trend & variance to target.
-
OPEX Analyzer: Drill into payroll, admin, selling, and marketing to control spend.
-
Cash & Leverage Panel: Liquidity and balance-sheet health at a glance.
-
Service-Line View: Compare outpatient vs inpatient economics and contribution.
-
Targets & Assumptions: Enter KPI targets; automatic Above/Below Target highlighting.
-
Clean Data Sheets: Import-ready tables for IS, Cash Flow, Balance Sheet, Patients/Beds, and Service-line revenue.
How it works
-
Paste monthly actuals (or CSV exports) into the provided tables.
-
Set margin, liquidity, and unit-economics targets.
-
Review visuals to optimize OPEX, pricing, and service-line mix.
Benefits
-
Protect margins & cash: Monitor EBITDA %, OCF, and cost drivers.
-
Strengthen balance sheet: Track Current Ratio and Debt-to-Equity.
-
Improve unit economics: Raise Avg. Revenue per Patient and manage Cost per Bed.
-
Decide faster: Board-ready visuals with clear definitions and formulas.
For ready-to-use Dashboard Templates: