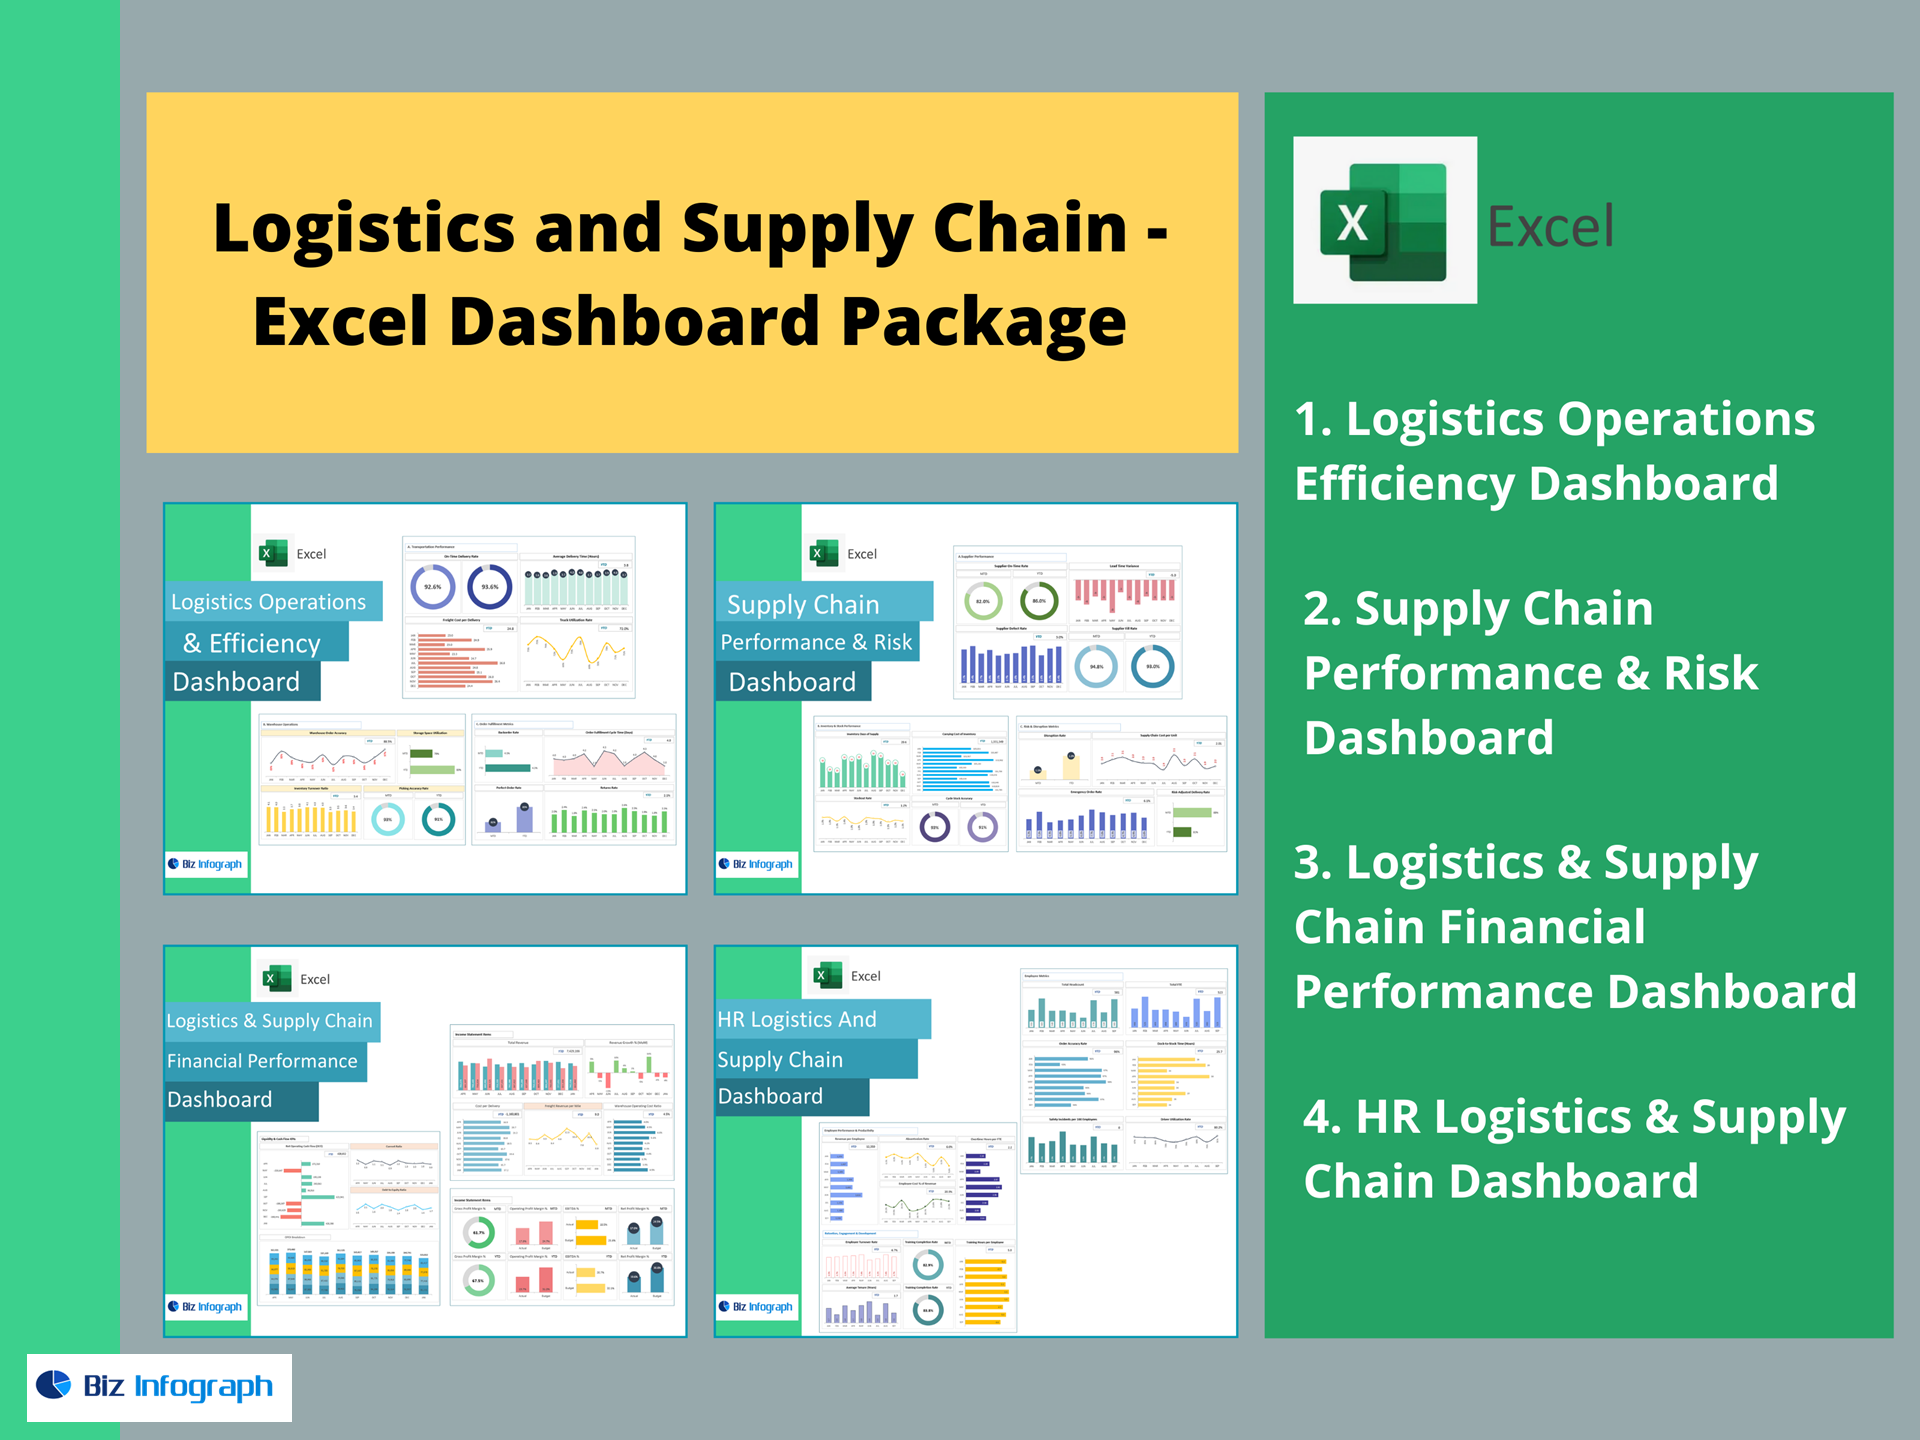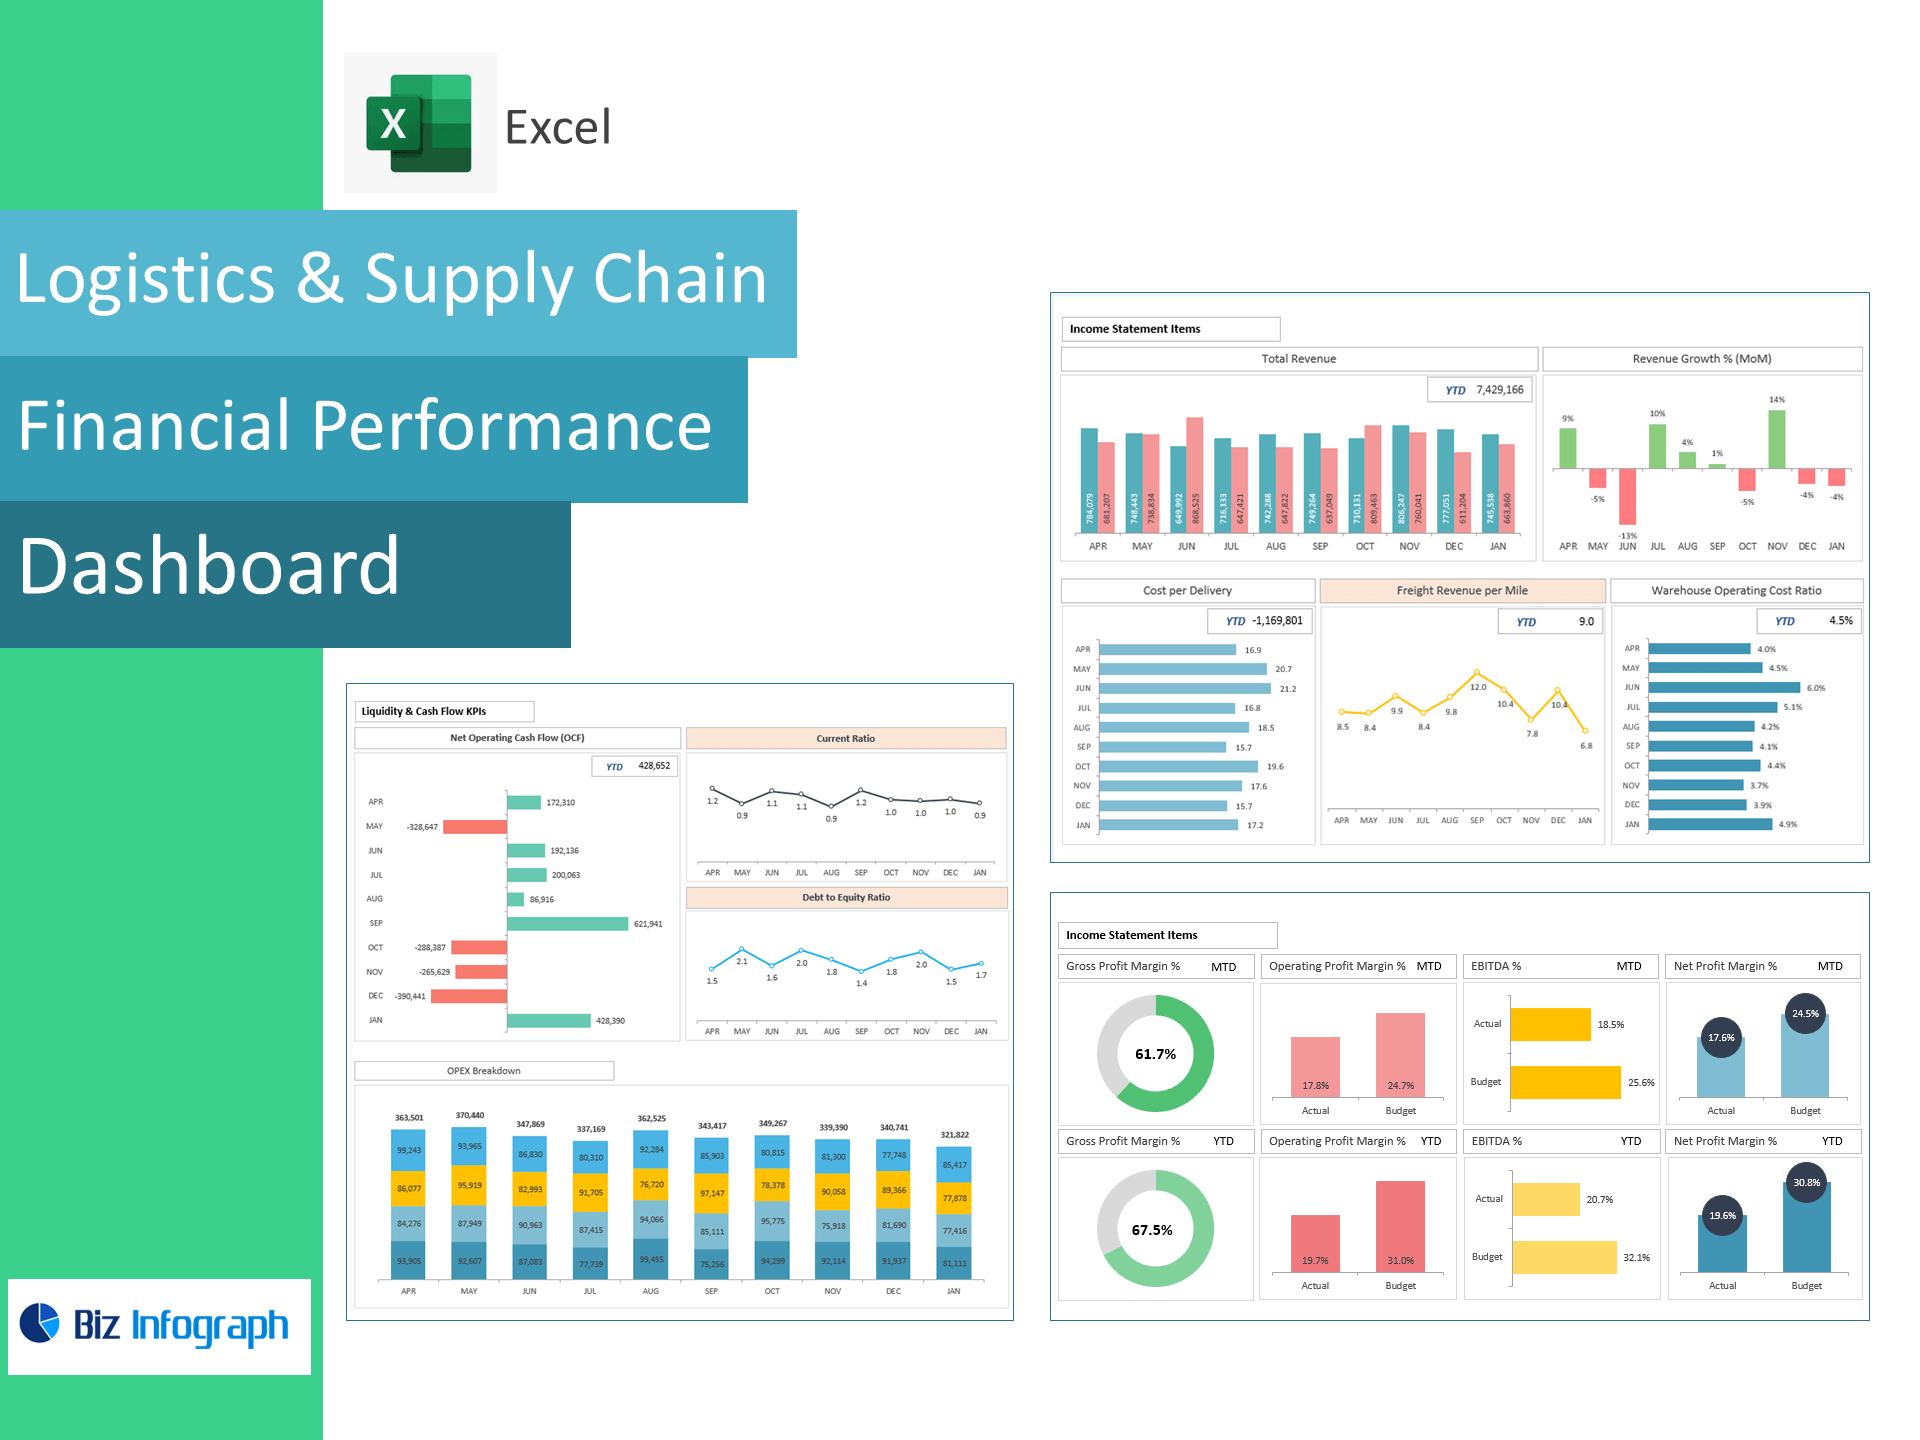
Logistics & Supply Chain Financial Performance Dashboard (Excel Template)
The Logistics & Supply Chain Financial Performance Dashboard in Excel is a powerful financial analysis tool designed for logistics companies, freight forwarders, warehousing providers, and supply chain operators. This ready-to-use dashboard transforms raw financial and operational data into actionable insights, helping managers track profitability, liquidity, and operational efficiency in one integrated Excel report.
Key Features
-
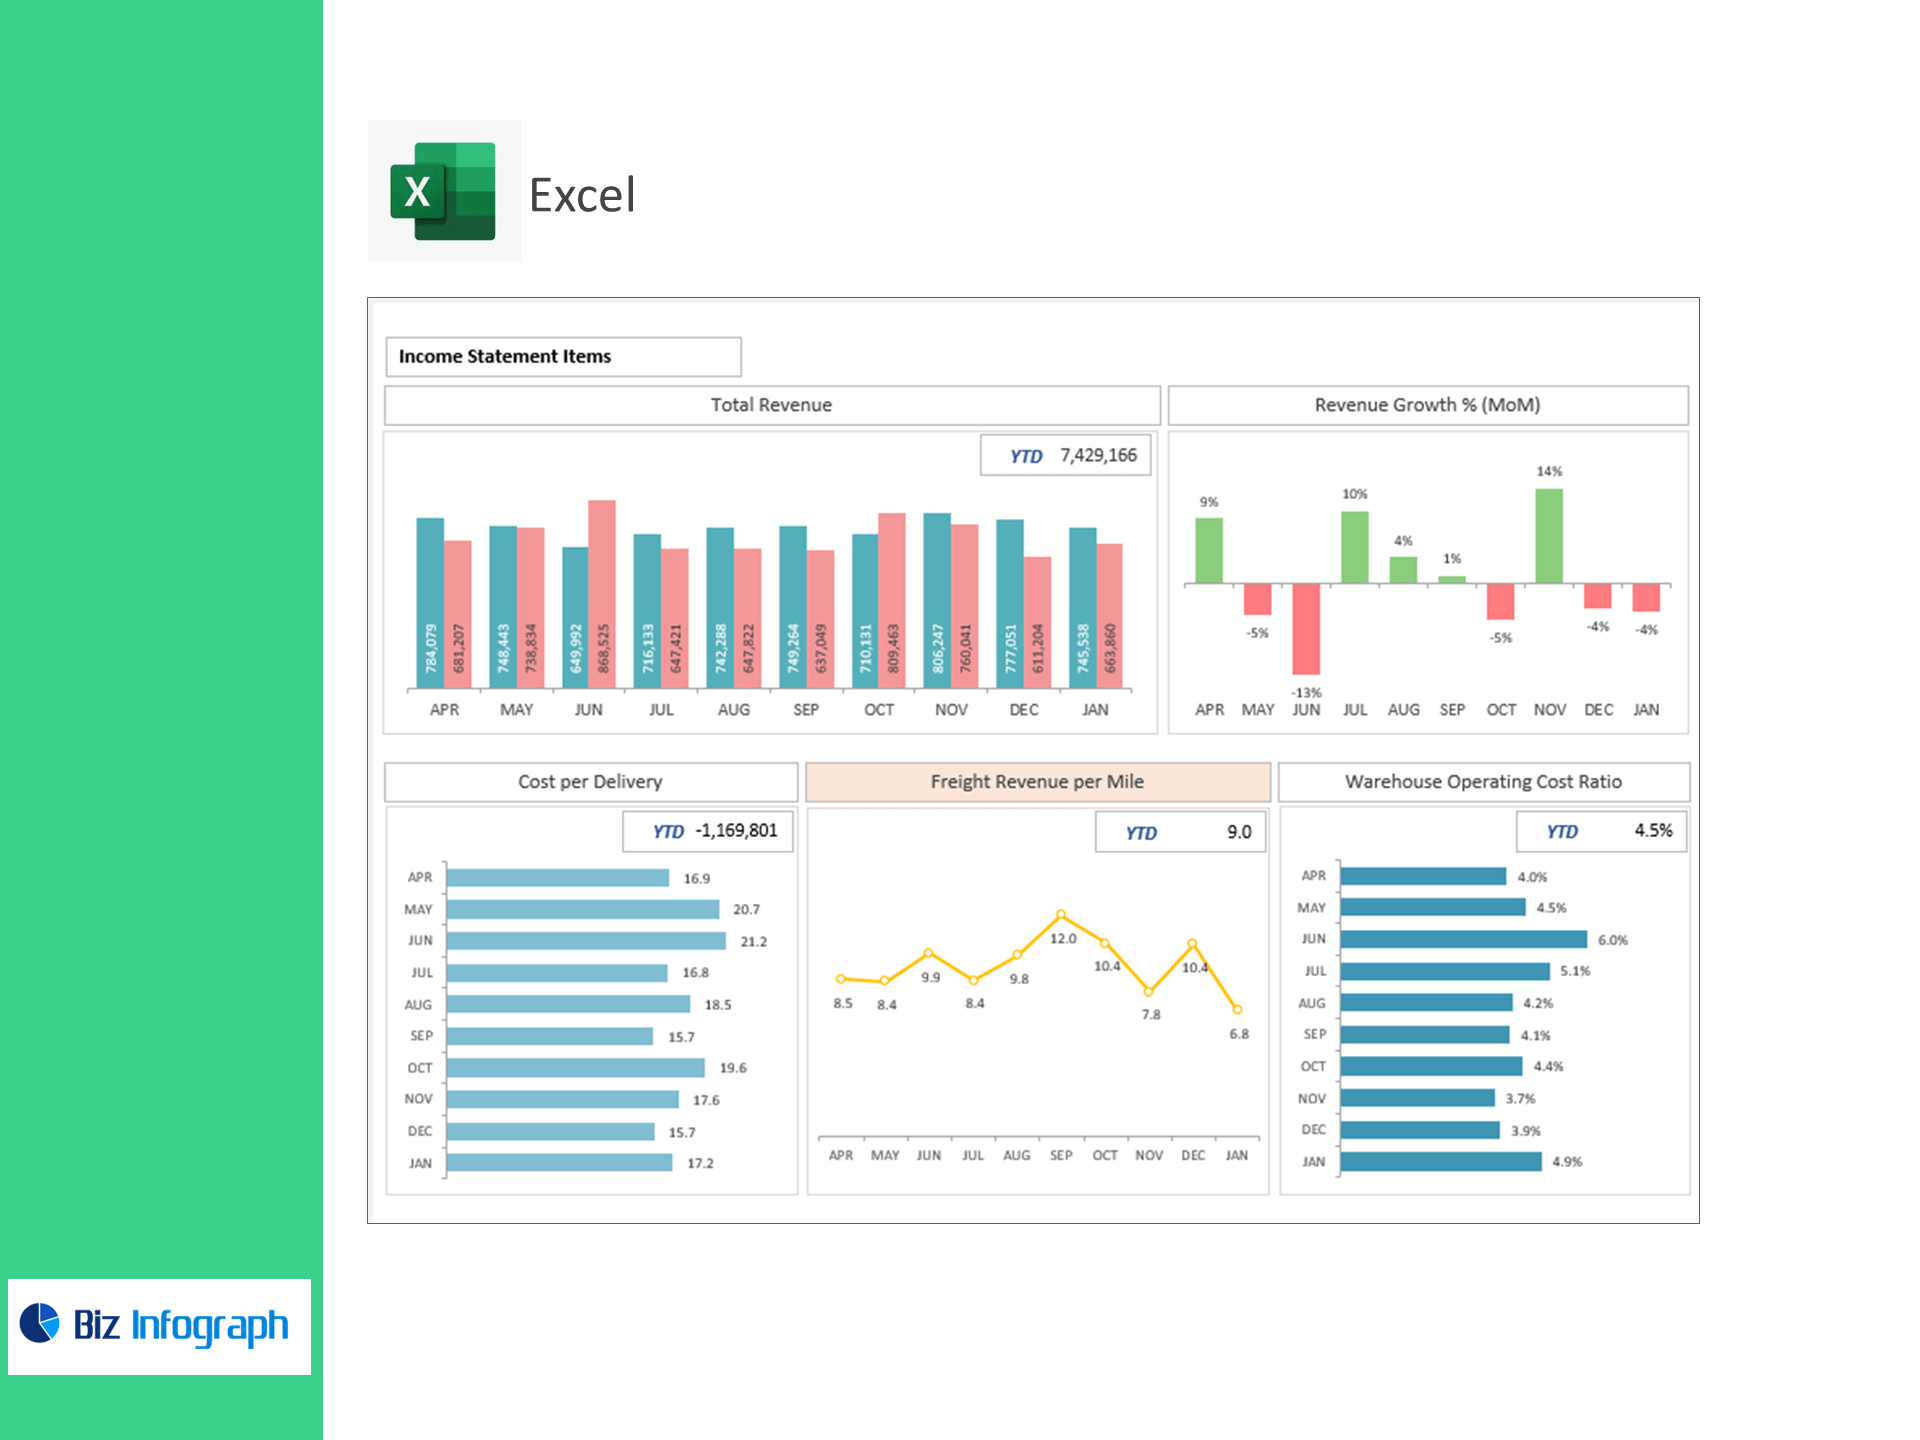
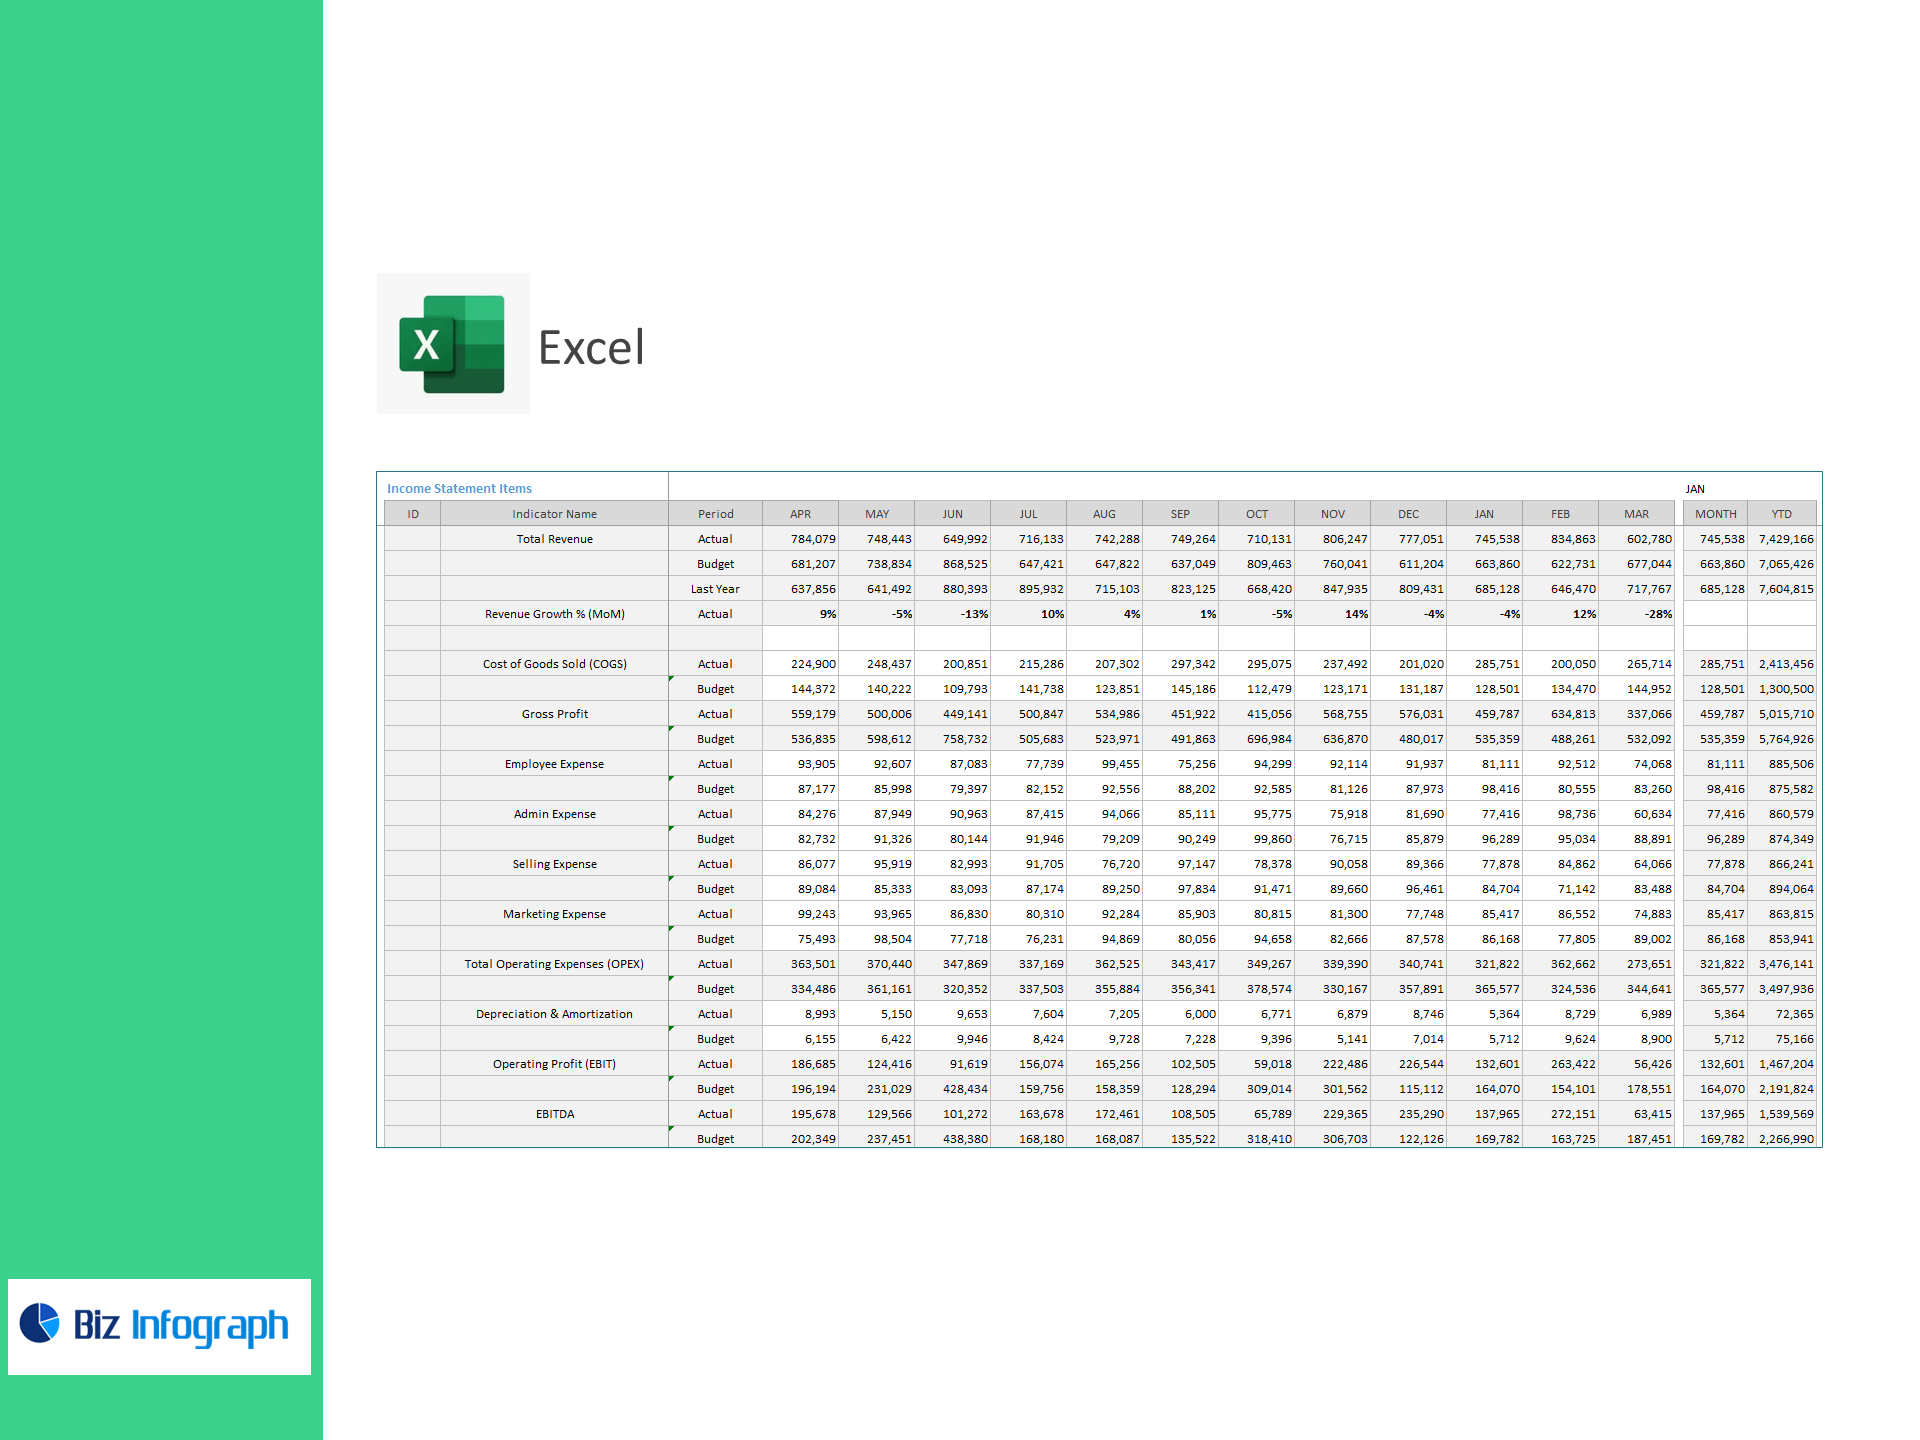
Comprehensive Financial Overview – Includes full Income Statement KPIs such as Total Revenue, Cost of Goods Sold (COGS), Gross Profit, Operating Profit (EBIT), EBITDA, and Net Profit.
-
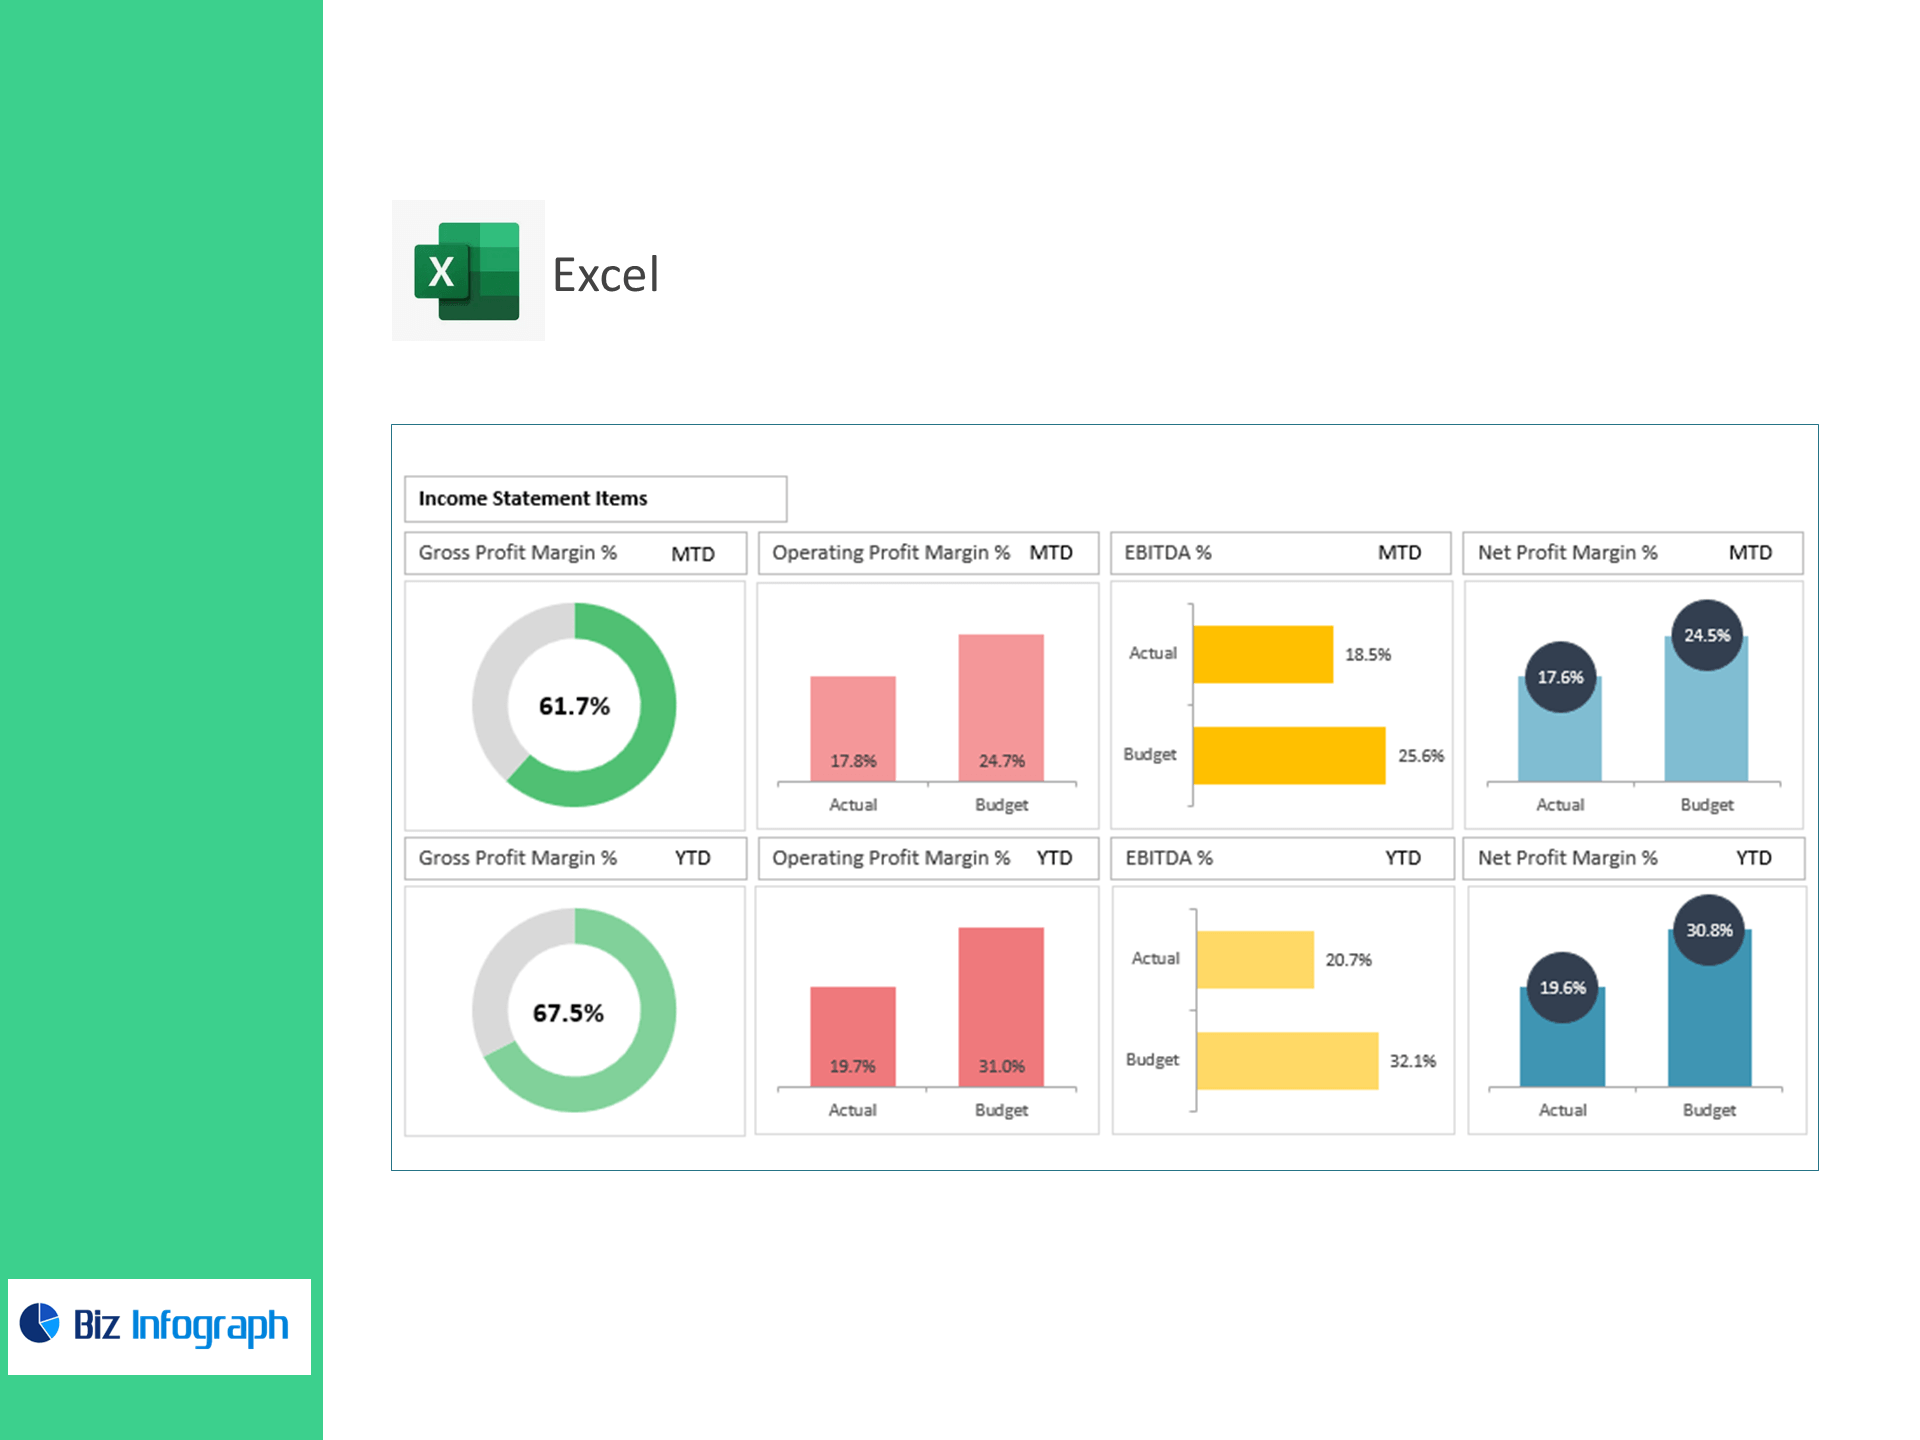
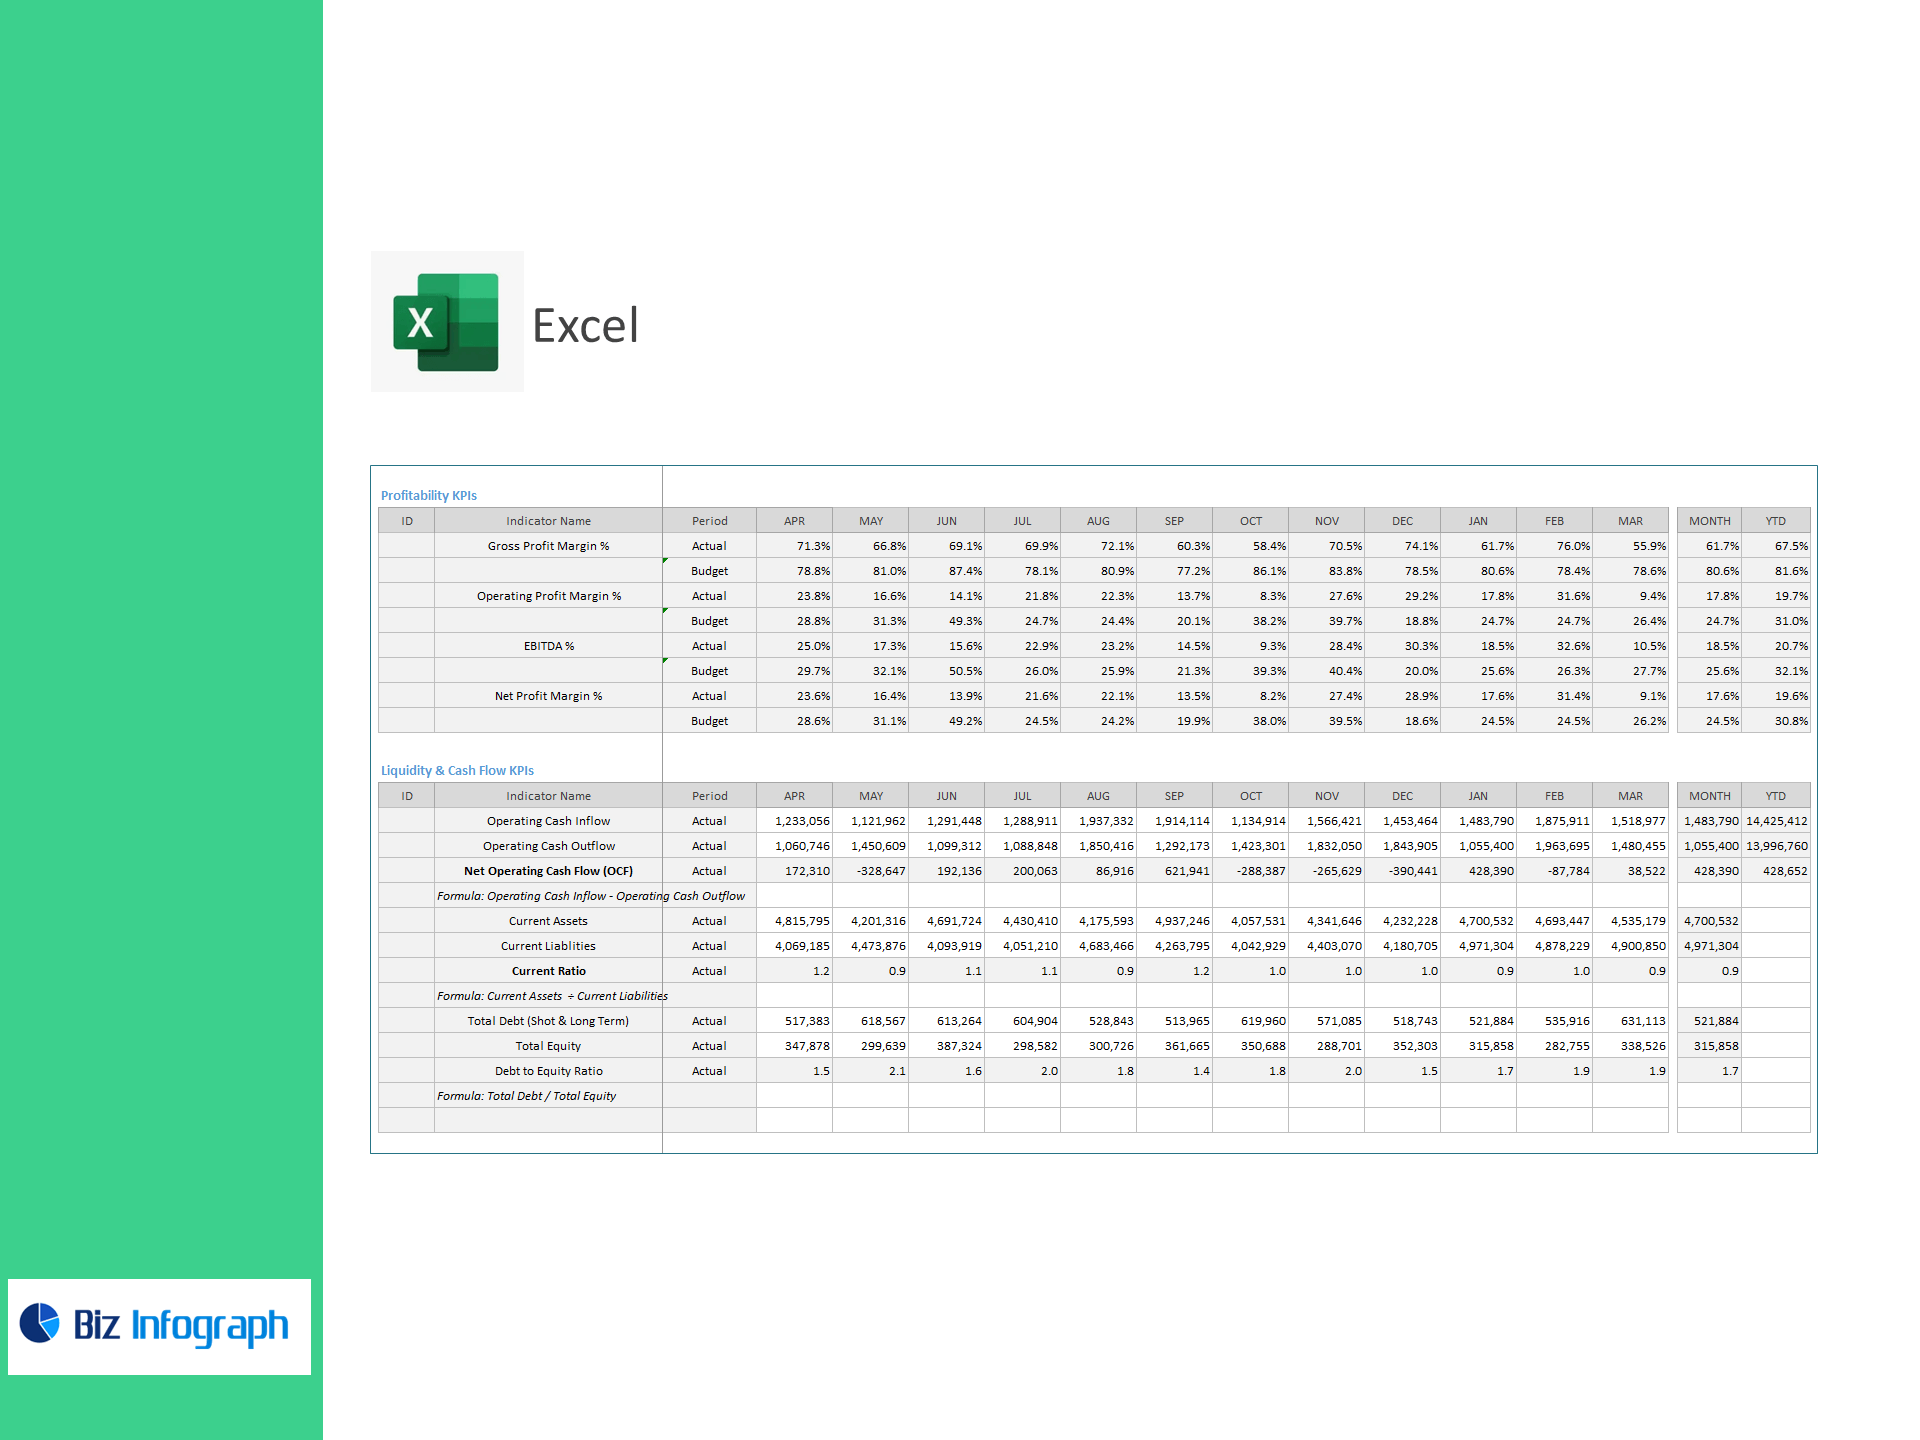
Profitability Metrics – Measure margins like Gross Profit Margin %, Operating Profit Margin %, EBITDA %, and Net Profit Margin % to evaluate cost control and pricing effectiveness.
-
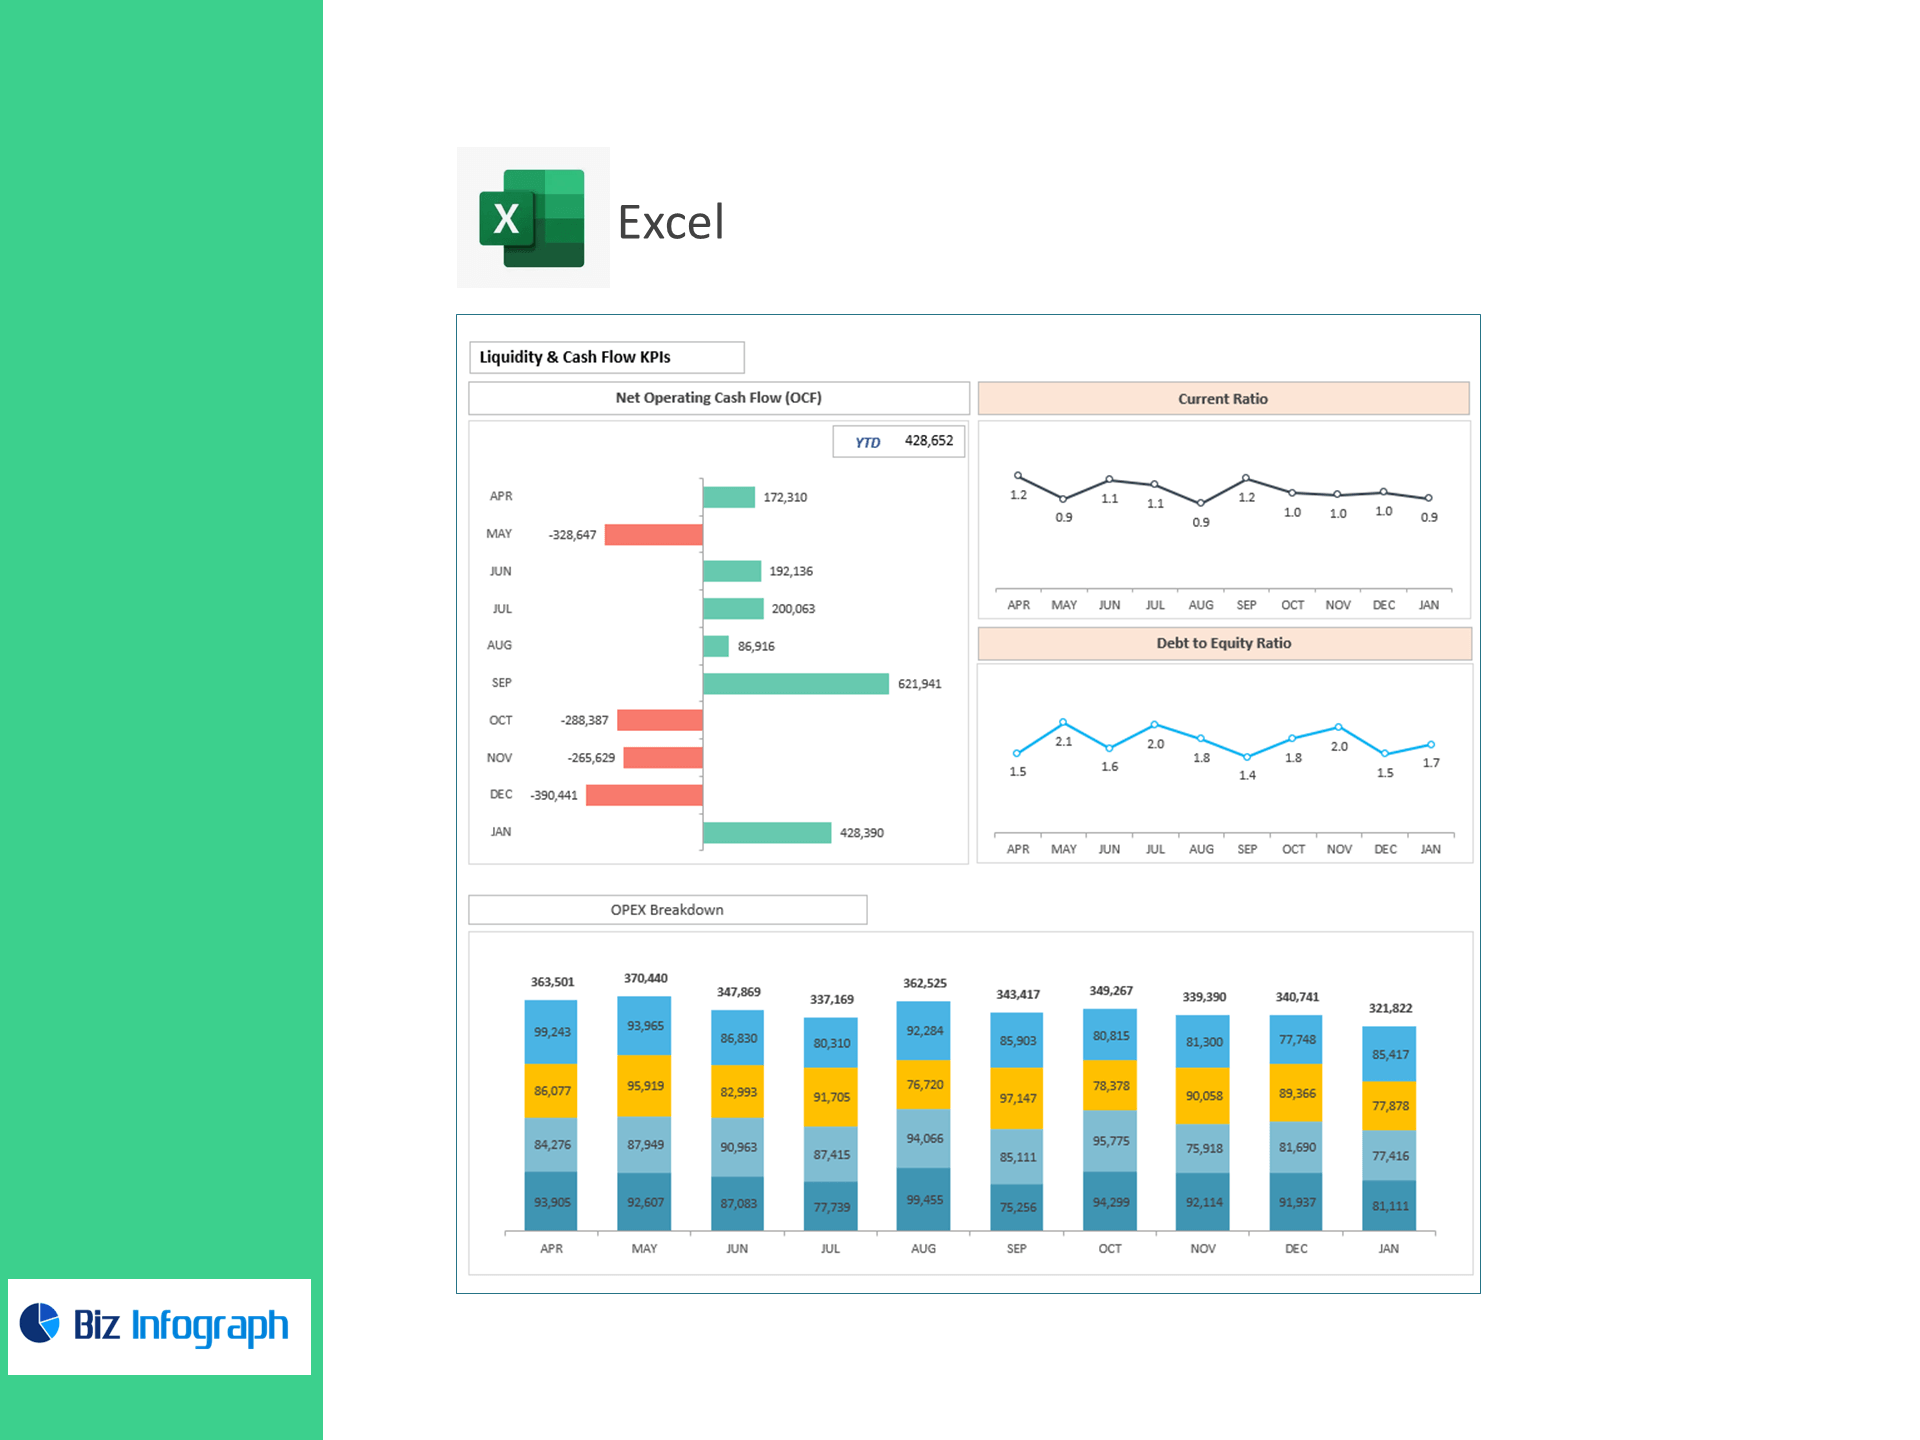
Liquidity & Cash Flow Analysis – Track Operating Cash Flow, Current Ratio, and Debt-to-Equity Ratio to ensure sustainable financial health and strong working capital management.
-
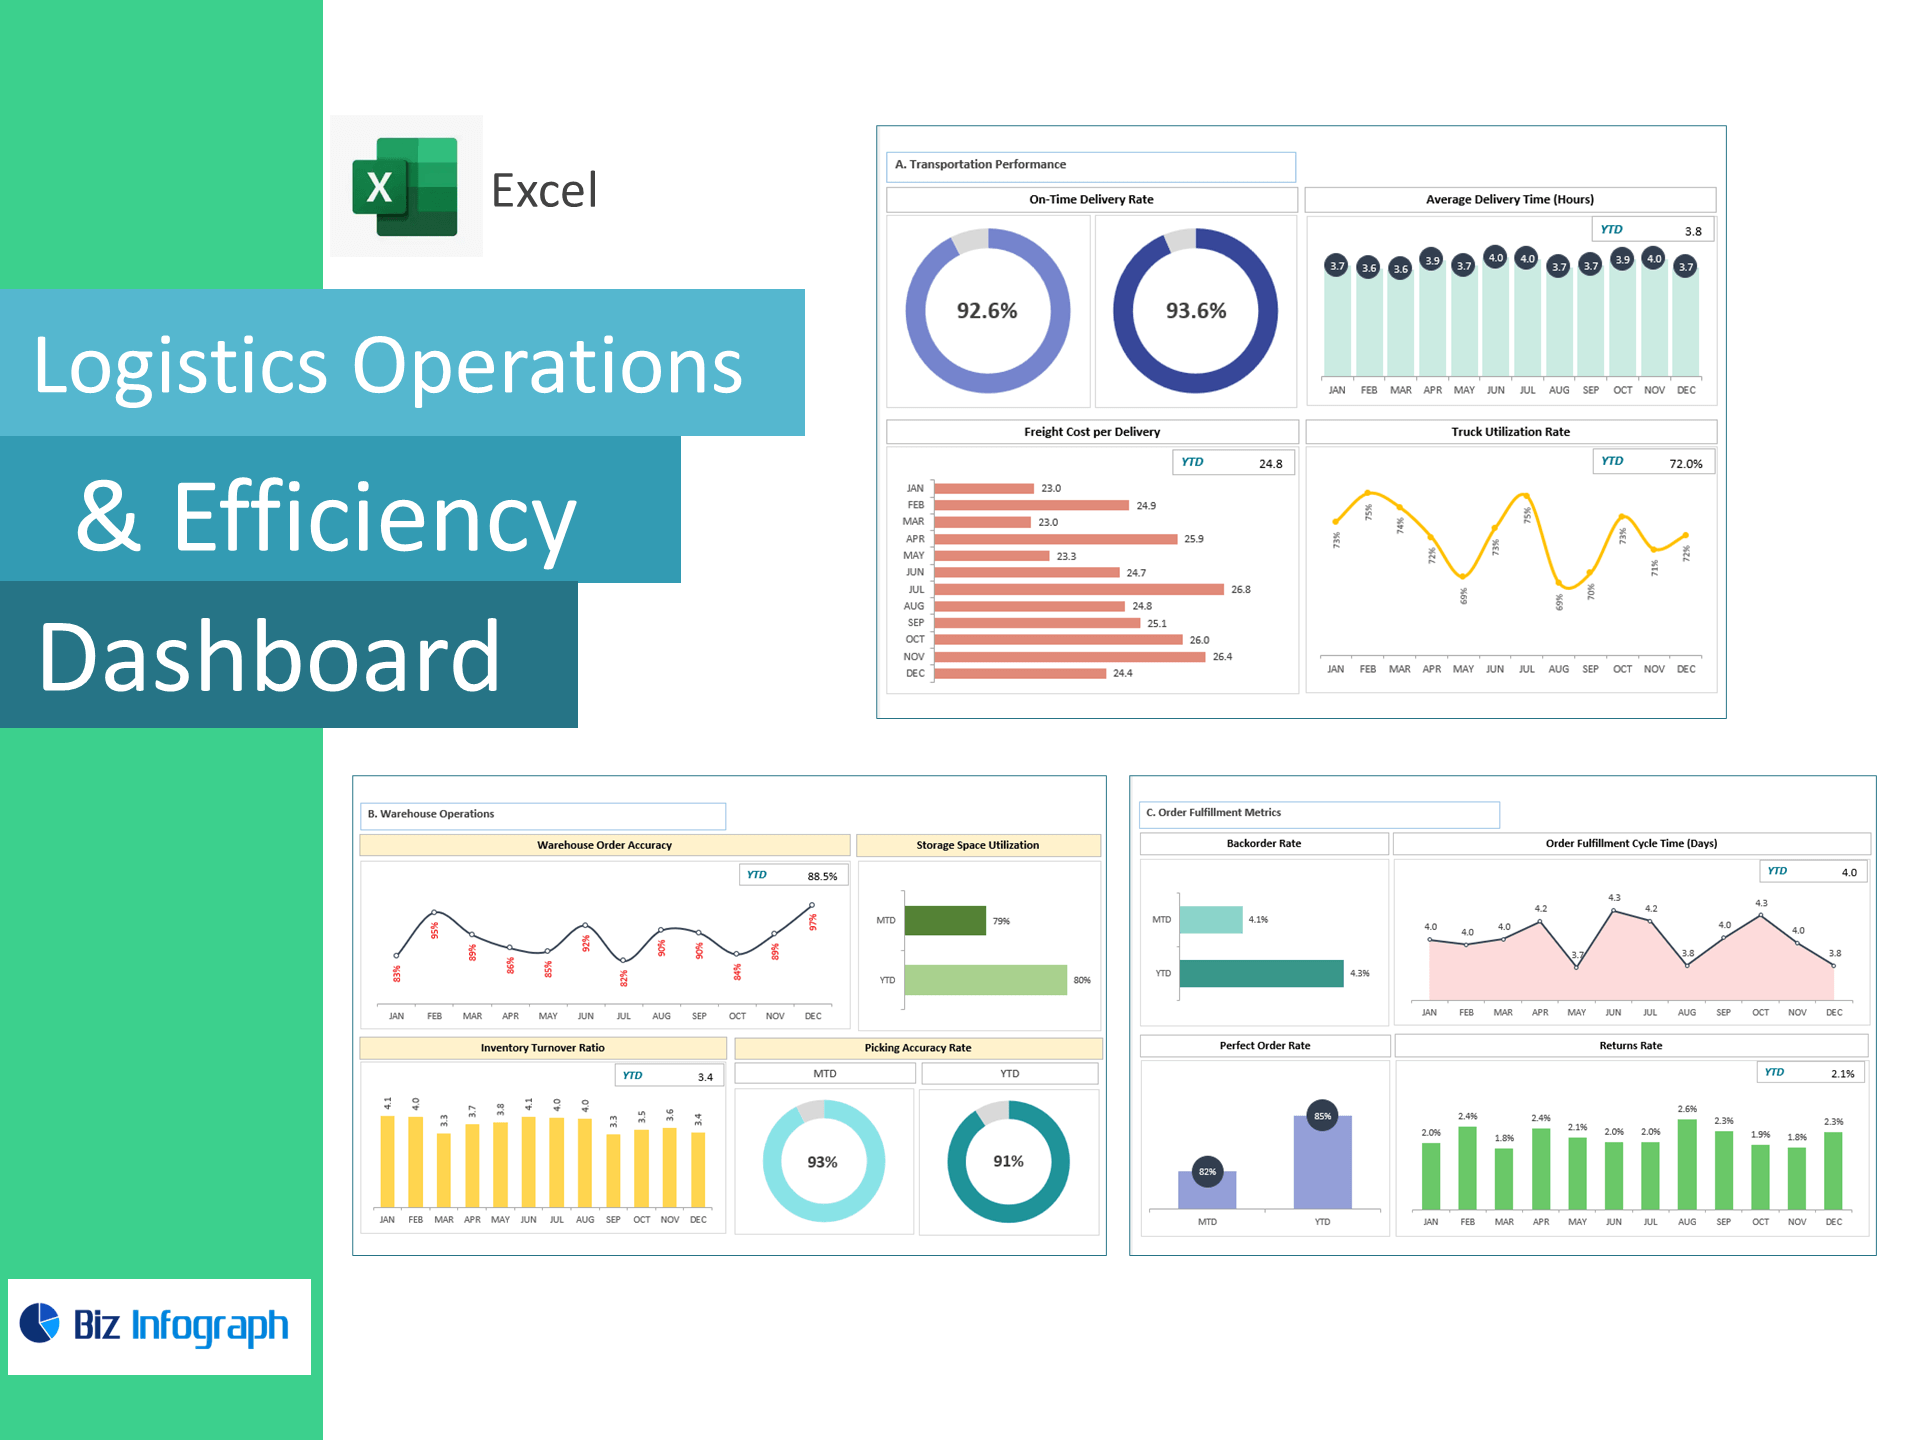
Operational Efficiency KPIs – Monitor logistics performance with metrics such as Cost per Delivery, Freight Revenue per Mile, and Warehouse Operating Cost Ratio to optimize delivery costs and warehouse utilization.
-
Automated Formulas & Visual Dashboards – Pre-built Excel formulas like Cost per Delivery = Total Delivery Cost ÷ Number of Deliveries and Current Ratio = Current Assets ÷ Current Liabilities calculate instantly and populate dynamic visual charts.
-
OPEX Breakdown – Analyze Employee, Admin, Selling, and Marketing Expenses to identify major cost drivers and improve profitability.
Why Logistics & Supply Chain Financial Performance Dashboard Matters
This Excel template allows logistics finance teams to:
-
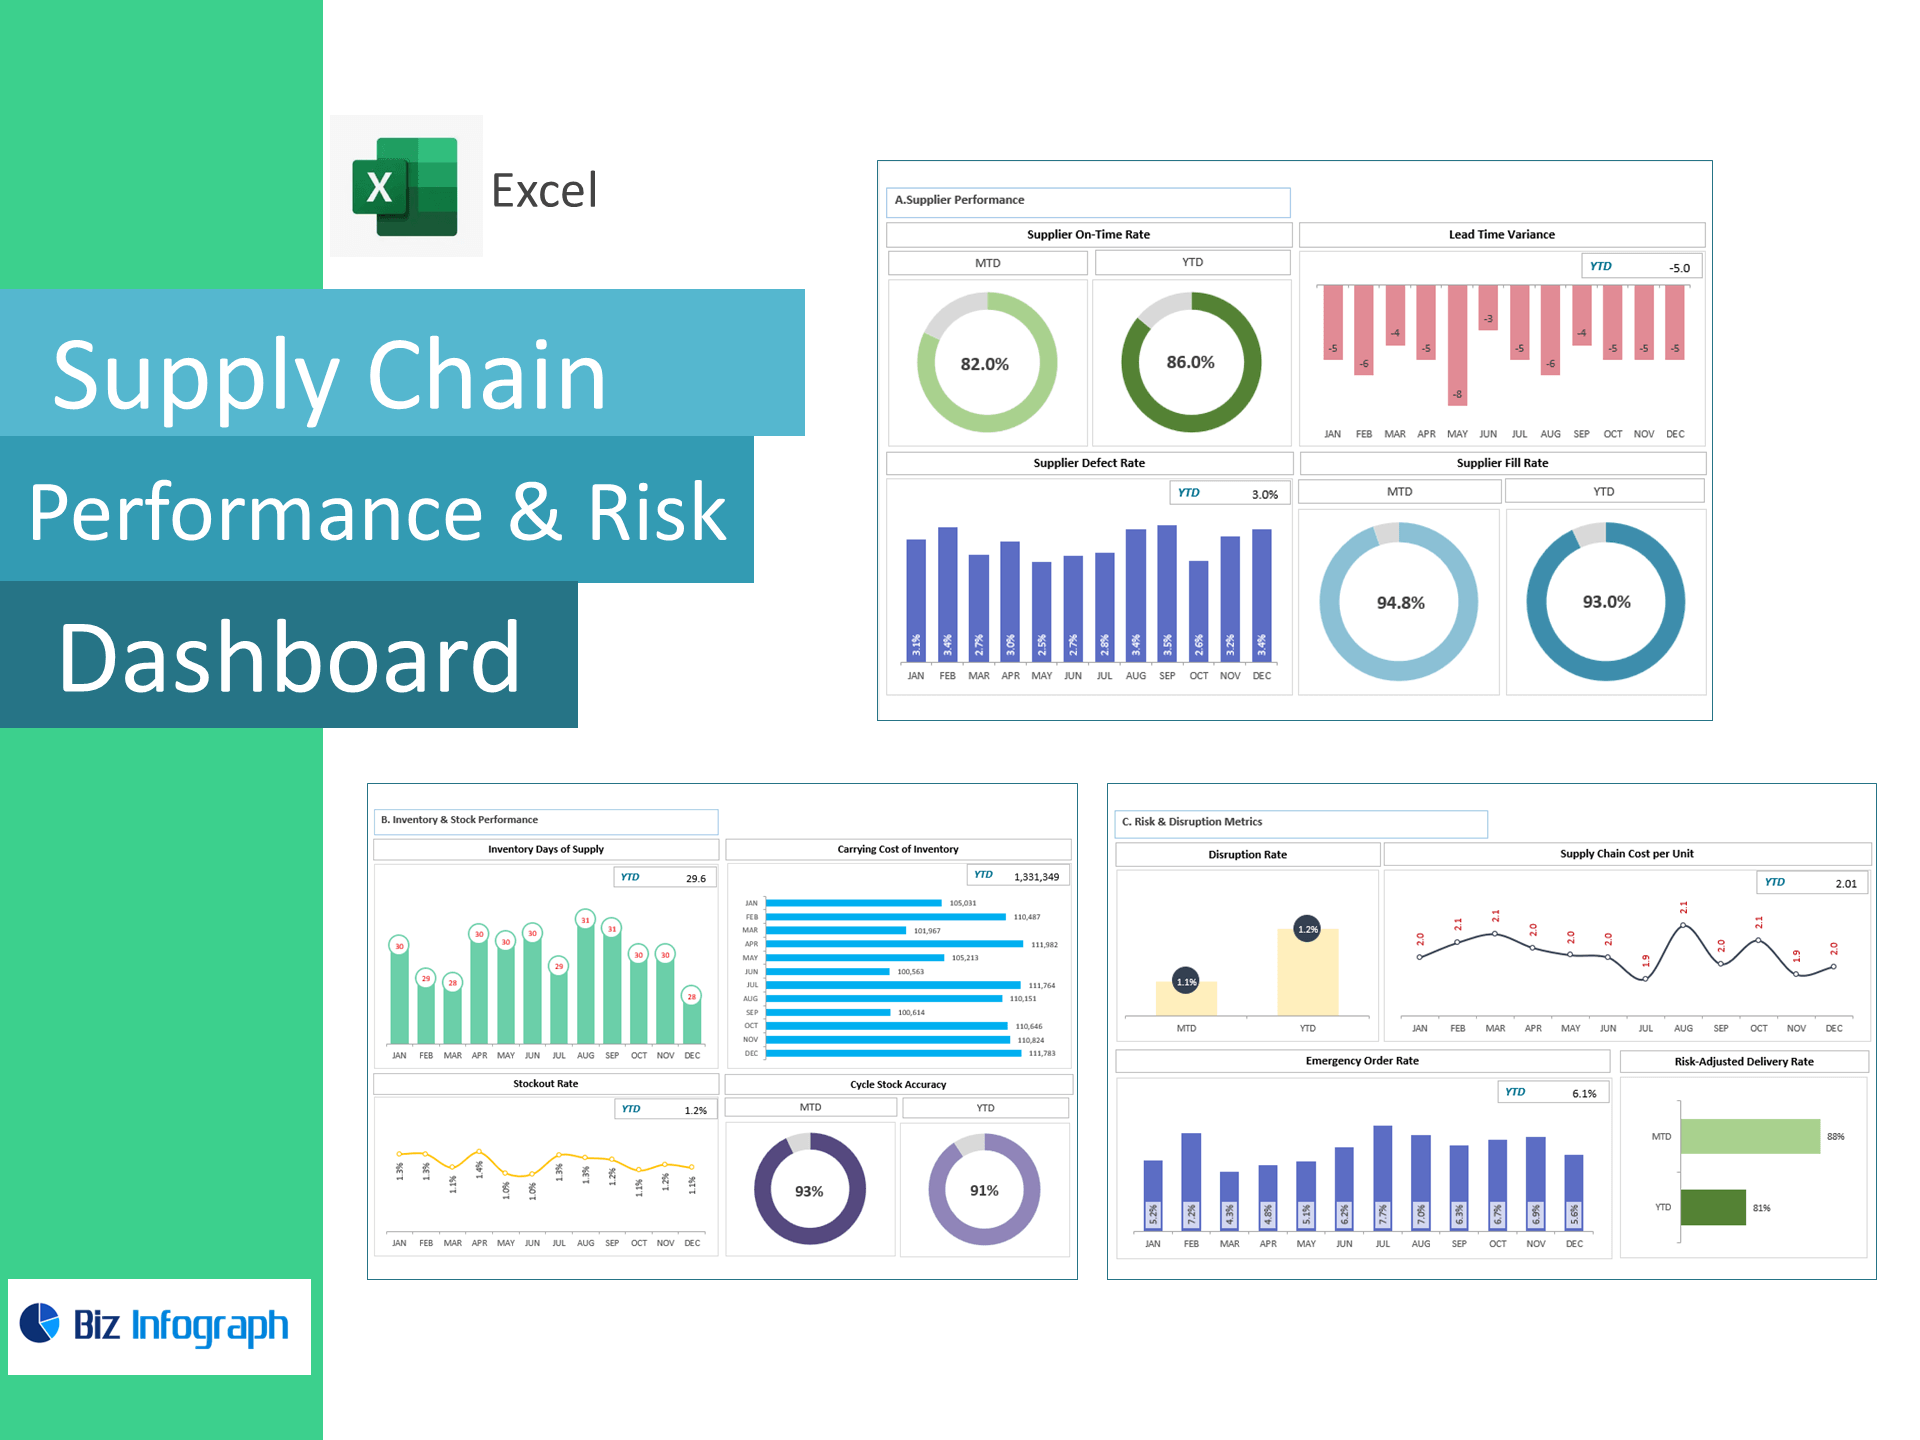
Compare revenue growth trends (MoM) and operating efficiency across regions or business units.
-
Detect profit leakage by analyzing cost structure and EBITDA contribution.
-
Strengthen cash flow planning using real-time liquidity metrics.
-
Enhance decision-making through visualized KPIs linking operations and finance.
Ideal For
-
Freight and transport companies
-
Warehouse and distribution centers
-
Third-party logistics (3PL) providers
-
Supply chain finance teams
Deliverables
- Fully-editable Excel dashboard
- Pre-defined KPI formulas & charts
- Automated Income and OPEX summary
- Monthly trend visualization