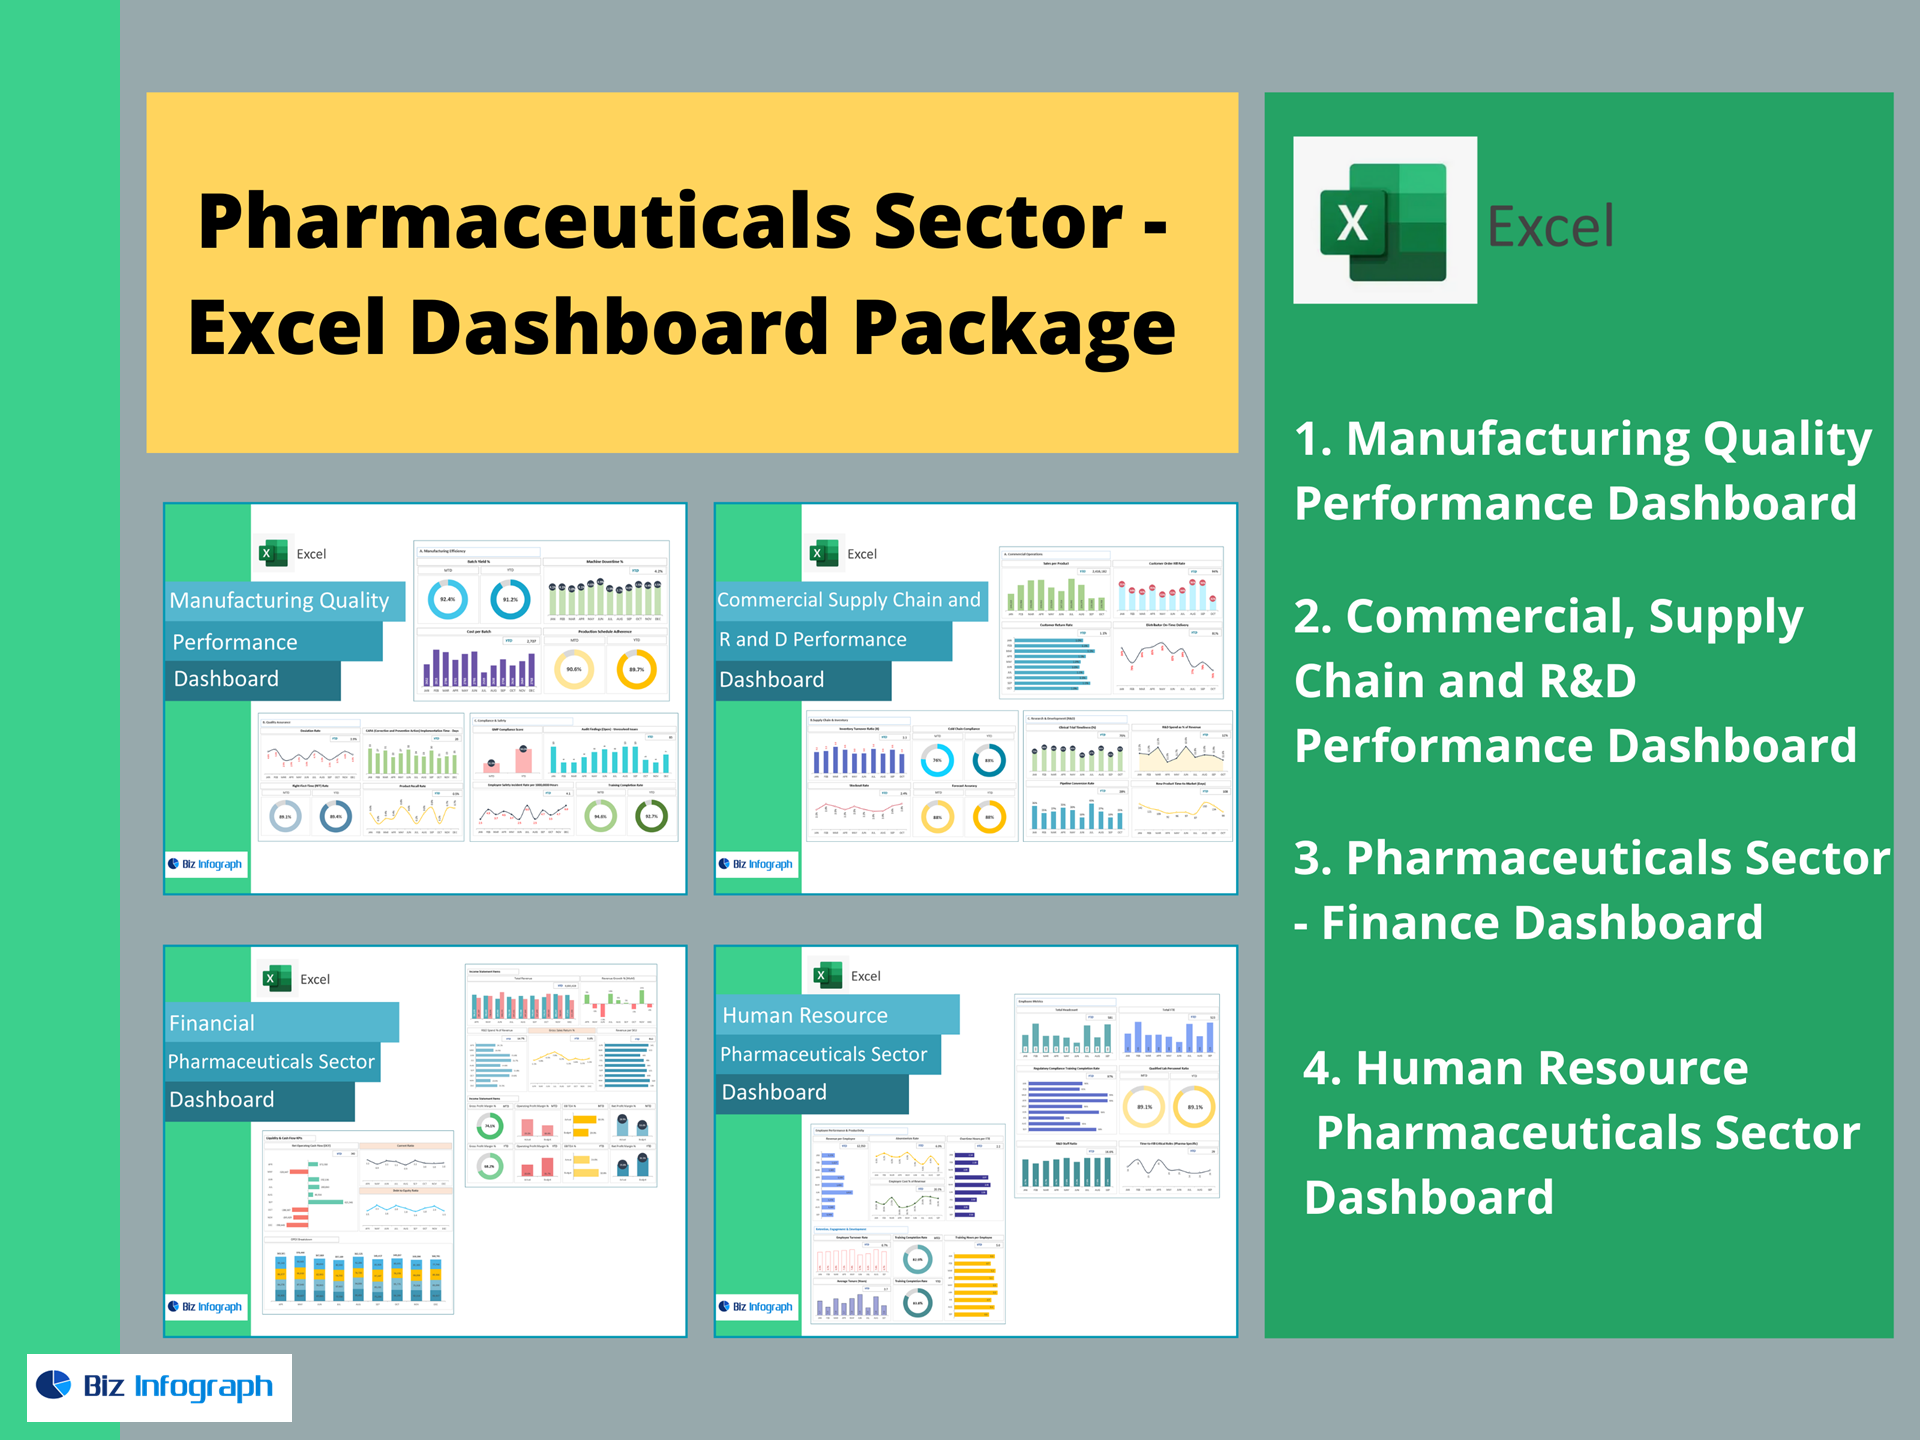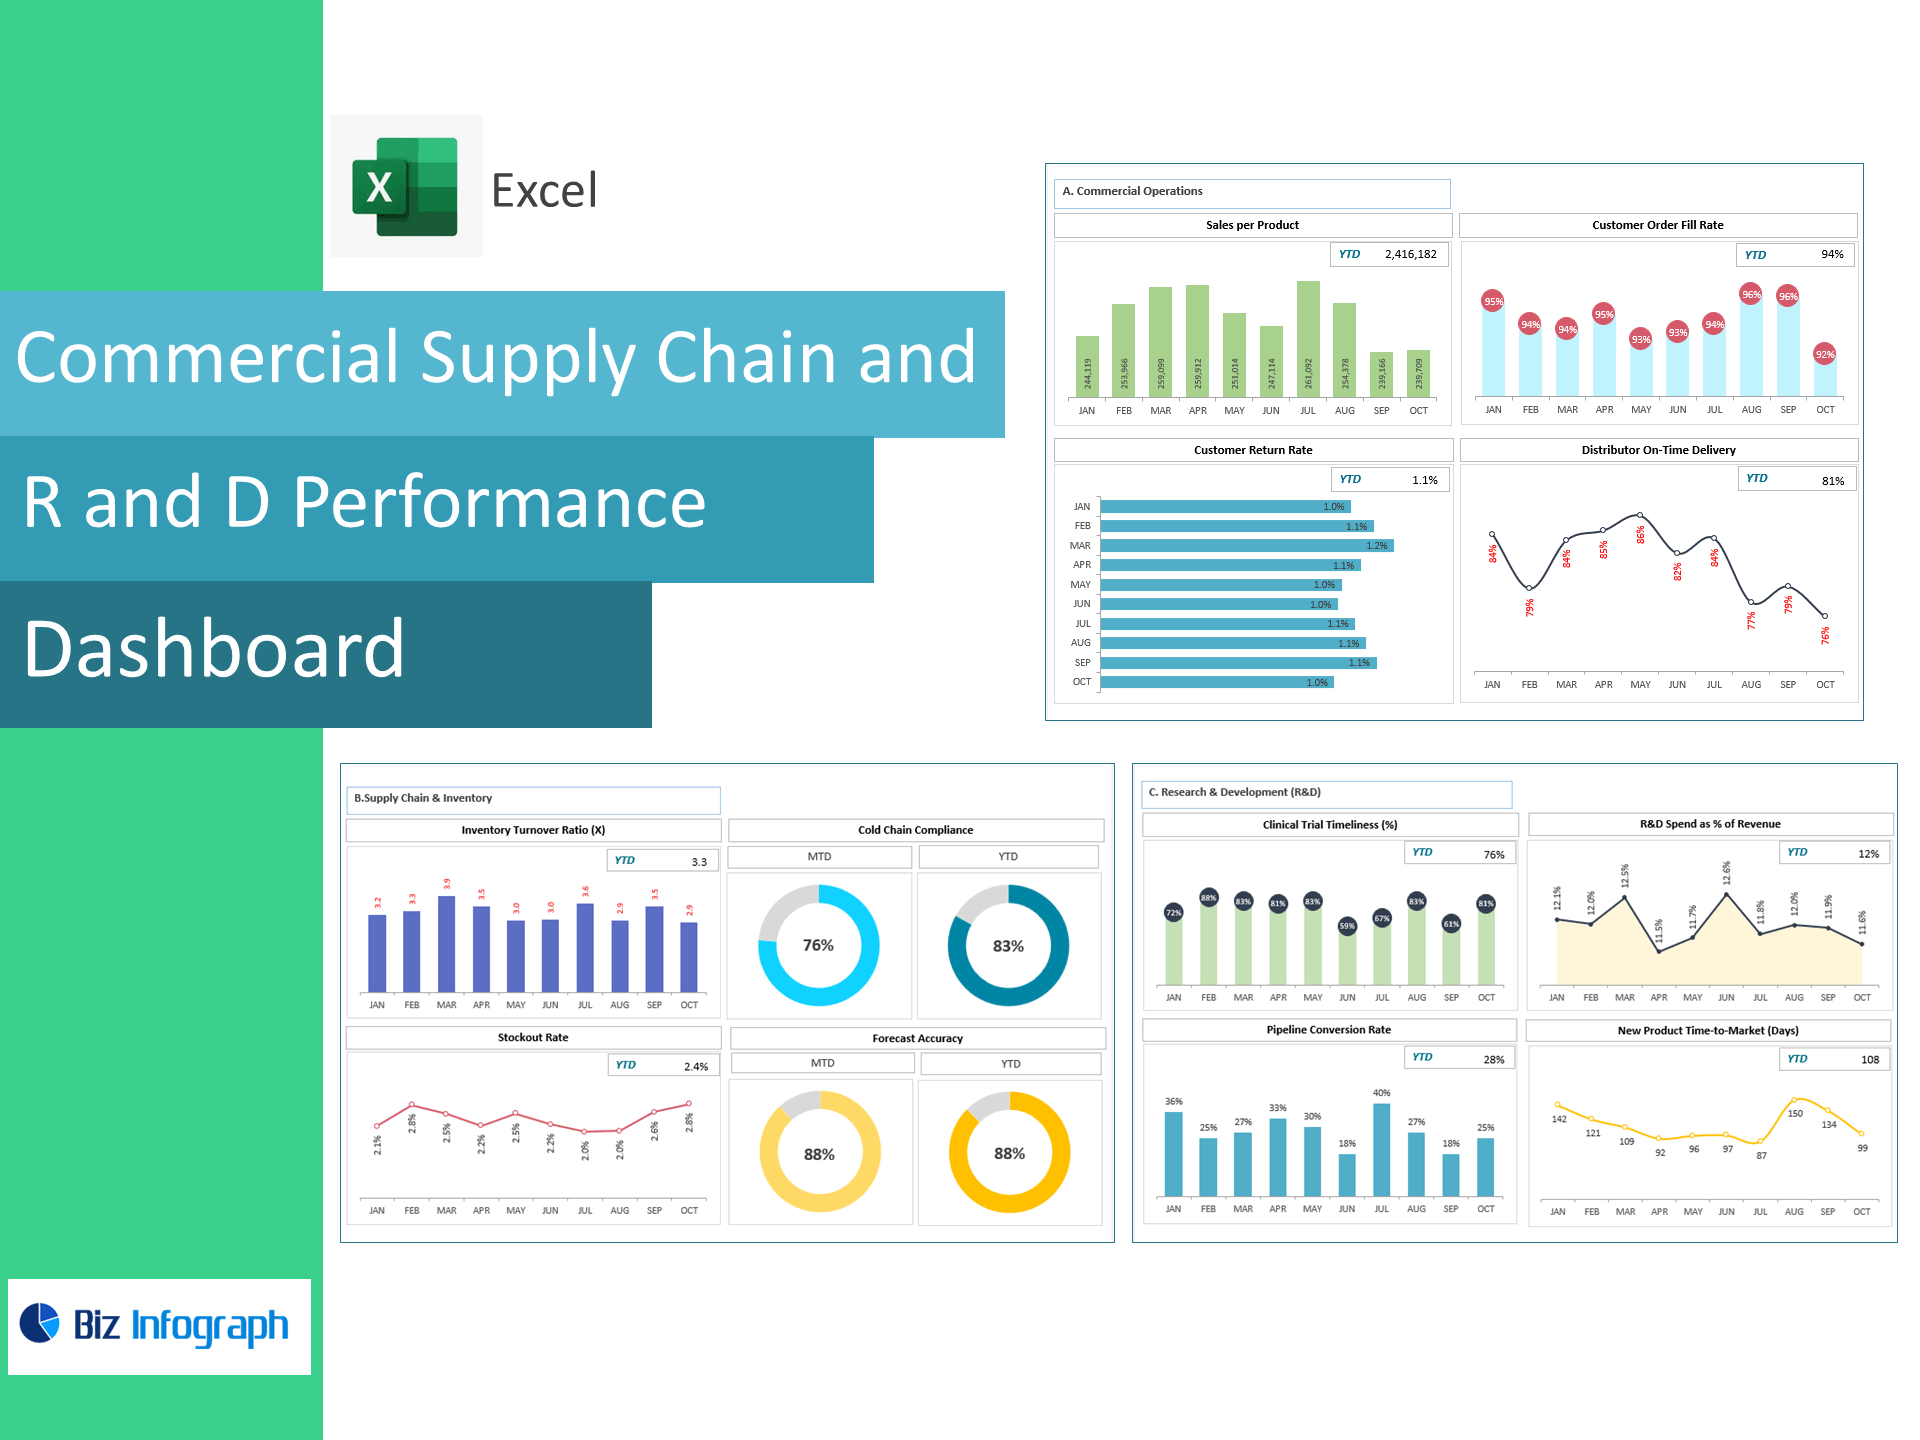
Commercial, Supply Chain & R&D Performance Dashboard — Excel Template
Unify commercial execution, distributor service, inventory health, and R&D progress in one executive-ready Excel dashboard. This template turns order fill, returns, on-time delivery, inventory turnover, stockouts, cold-chain compliance, forecast accuracy, clinical trial timeliness, time-to-market, and pipeline conversion into clear visuals your team can act on—no coding or add-ins required.
What you’ll track (prebuilt KPIs)
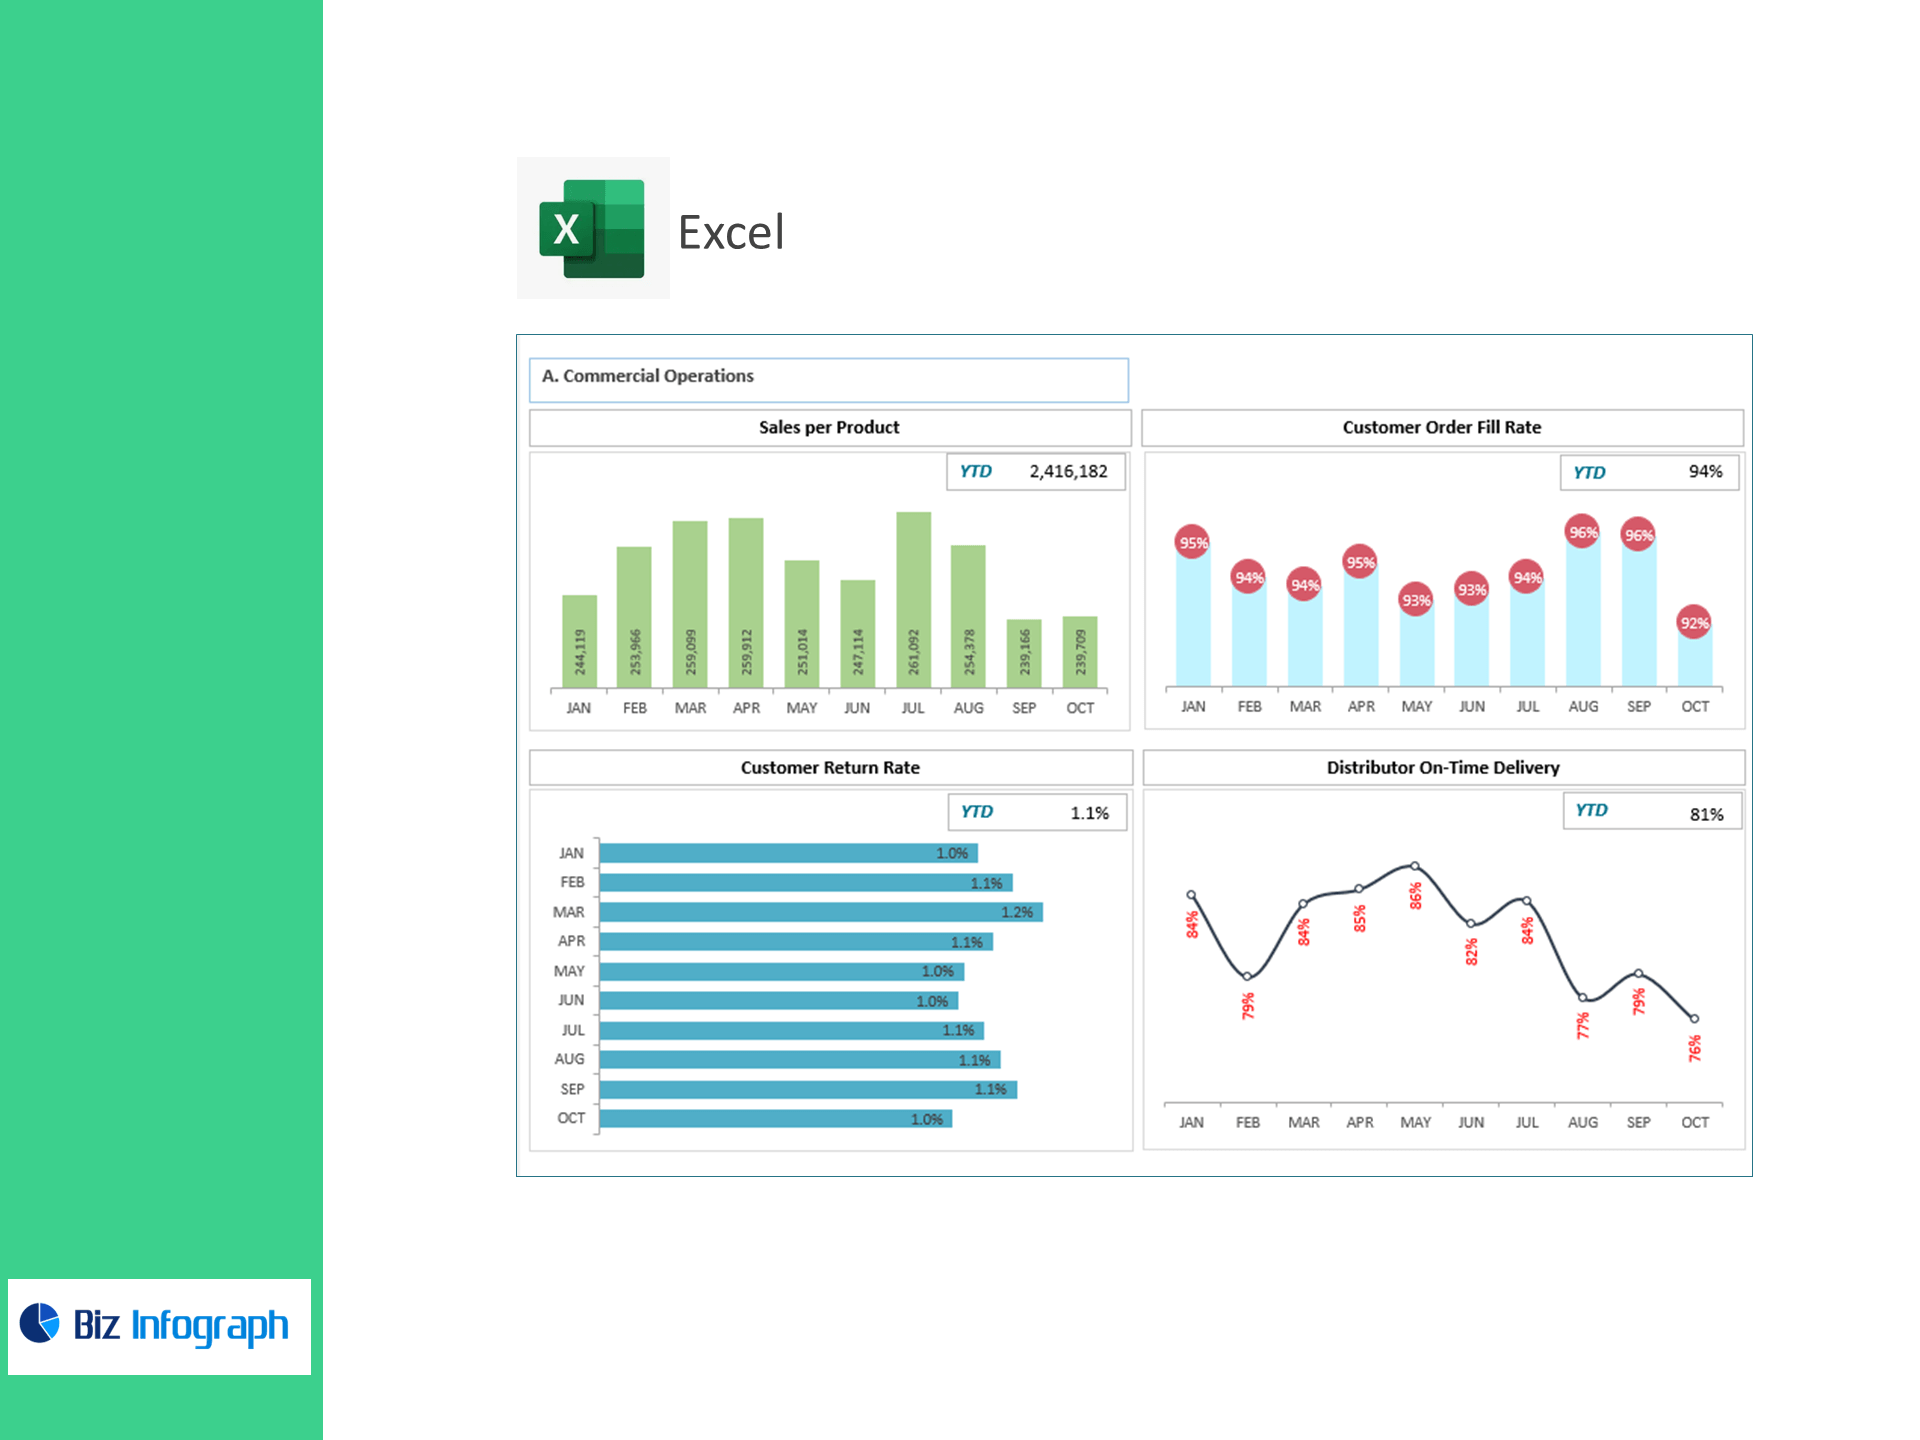
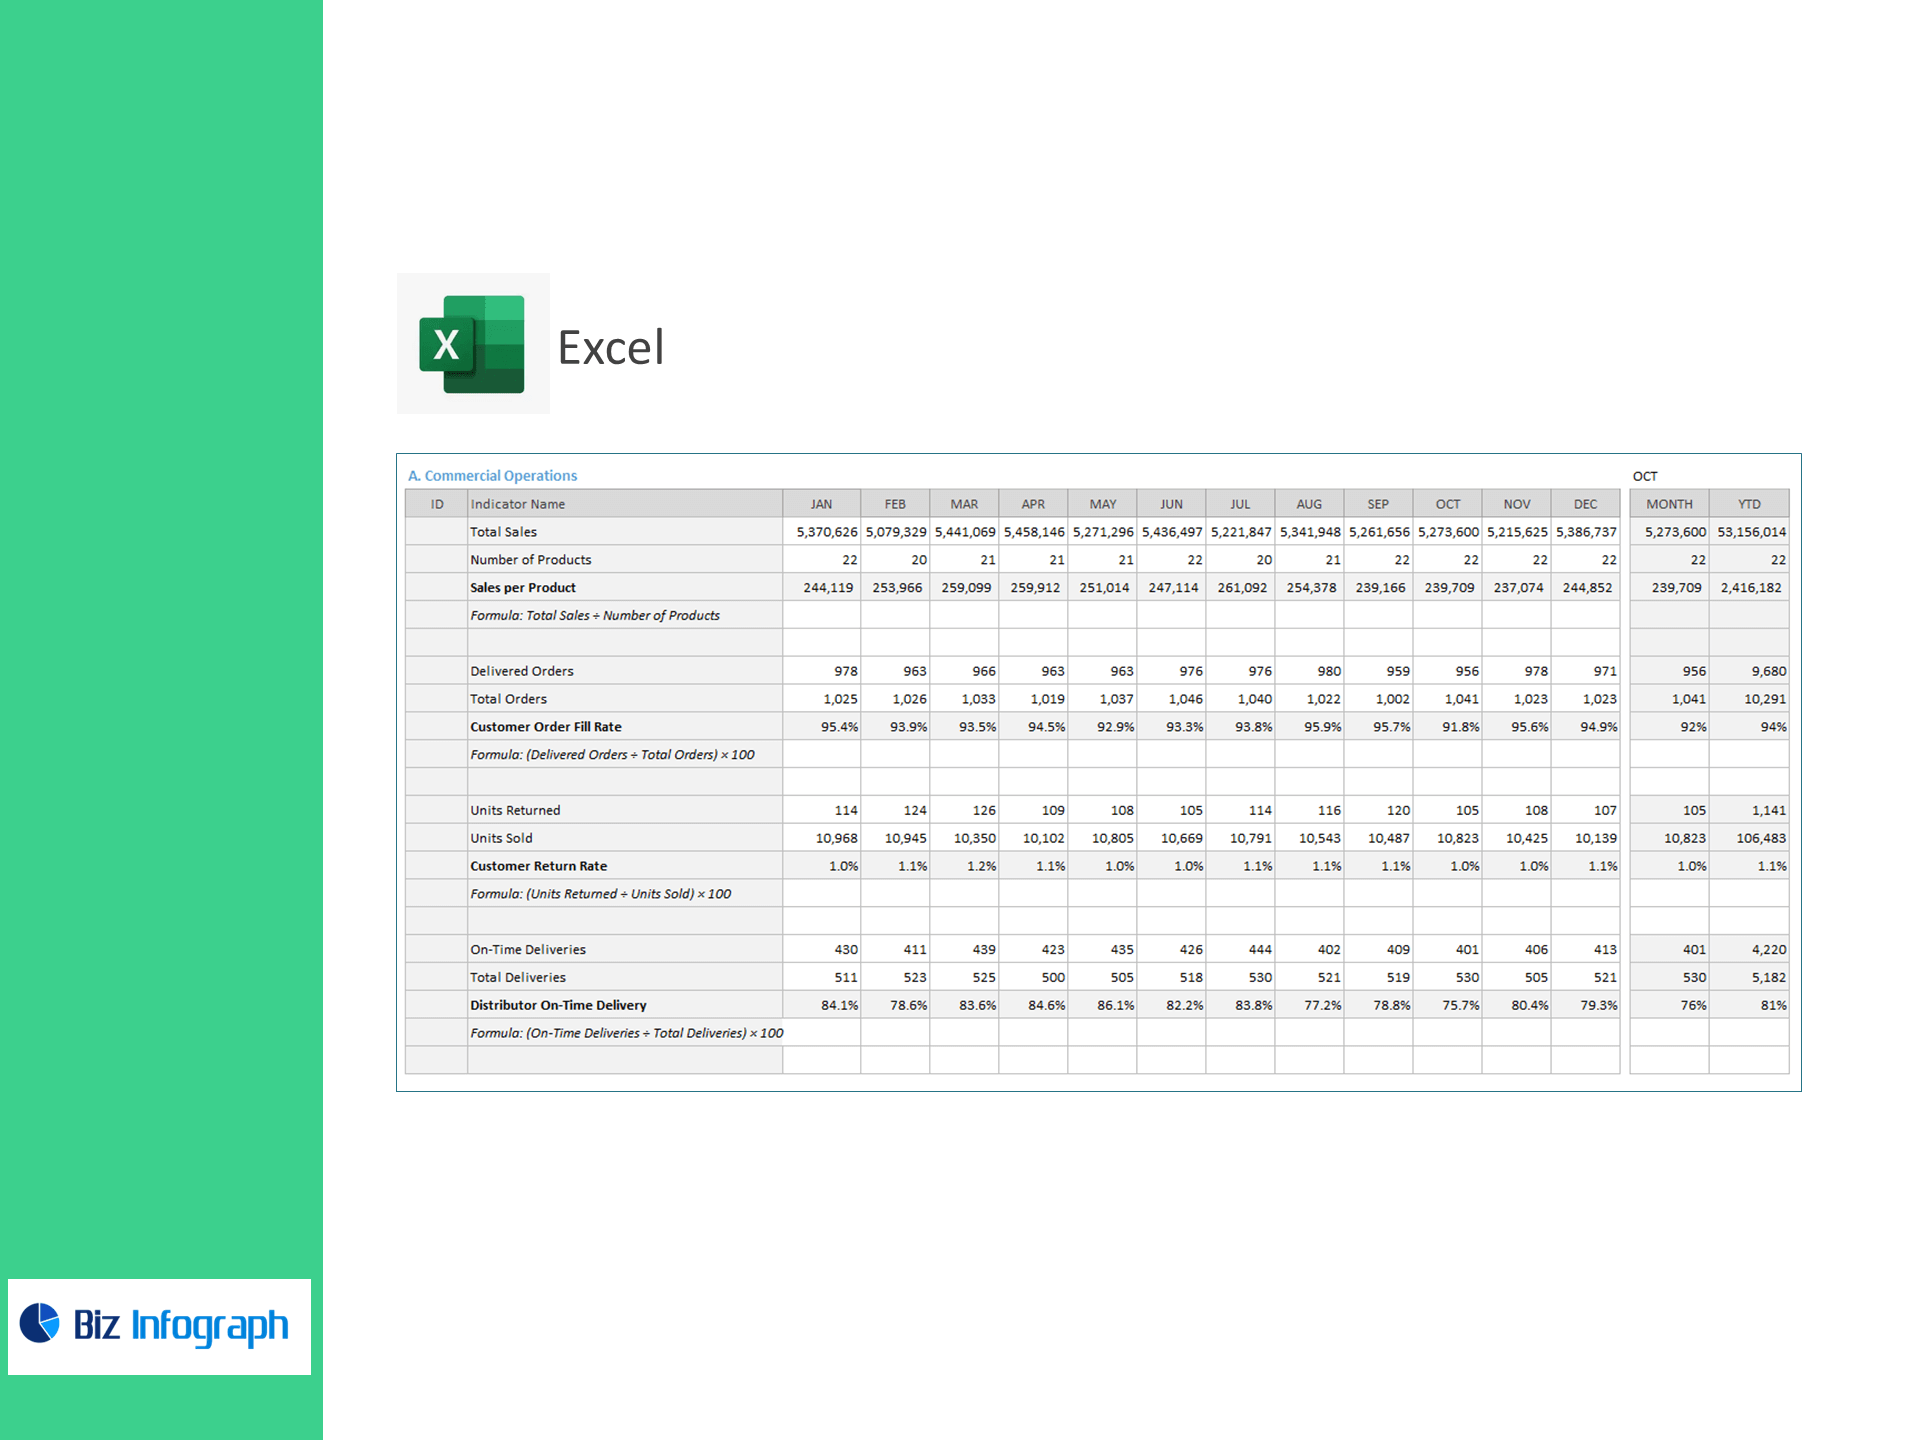
A) Commercial Operations
-
Sales per Product (mix & focus)
-
Customer Order Fill Rate
-
Customer Return Rate
-
Distributor On-Time Delivery
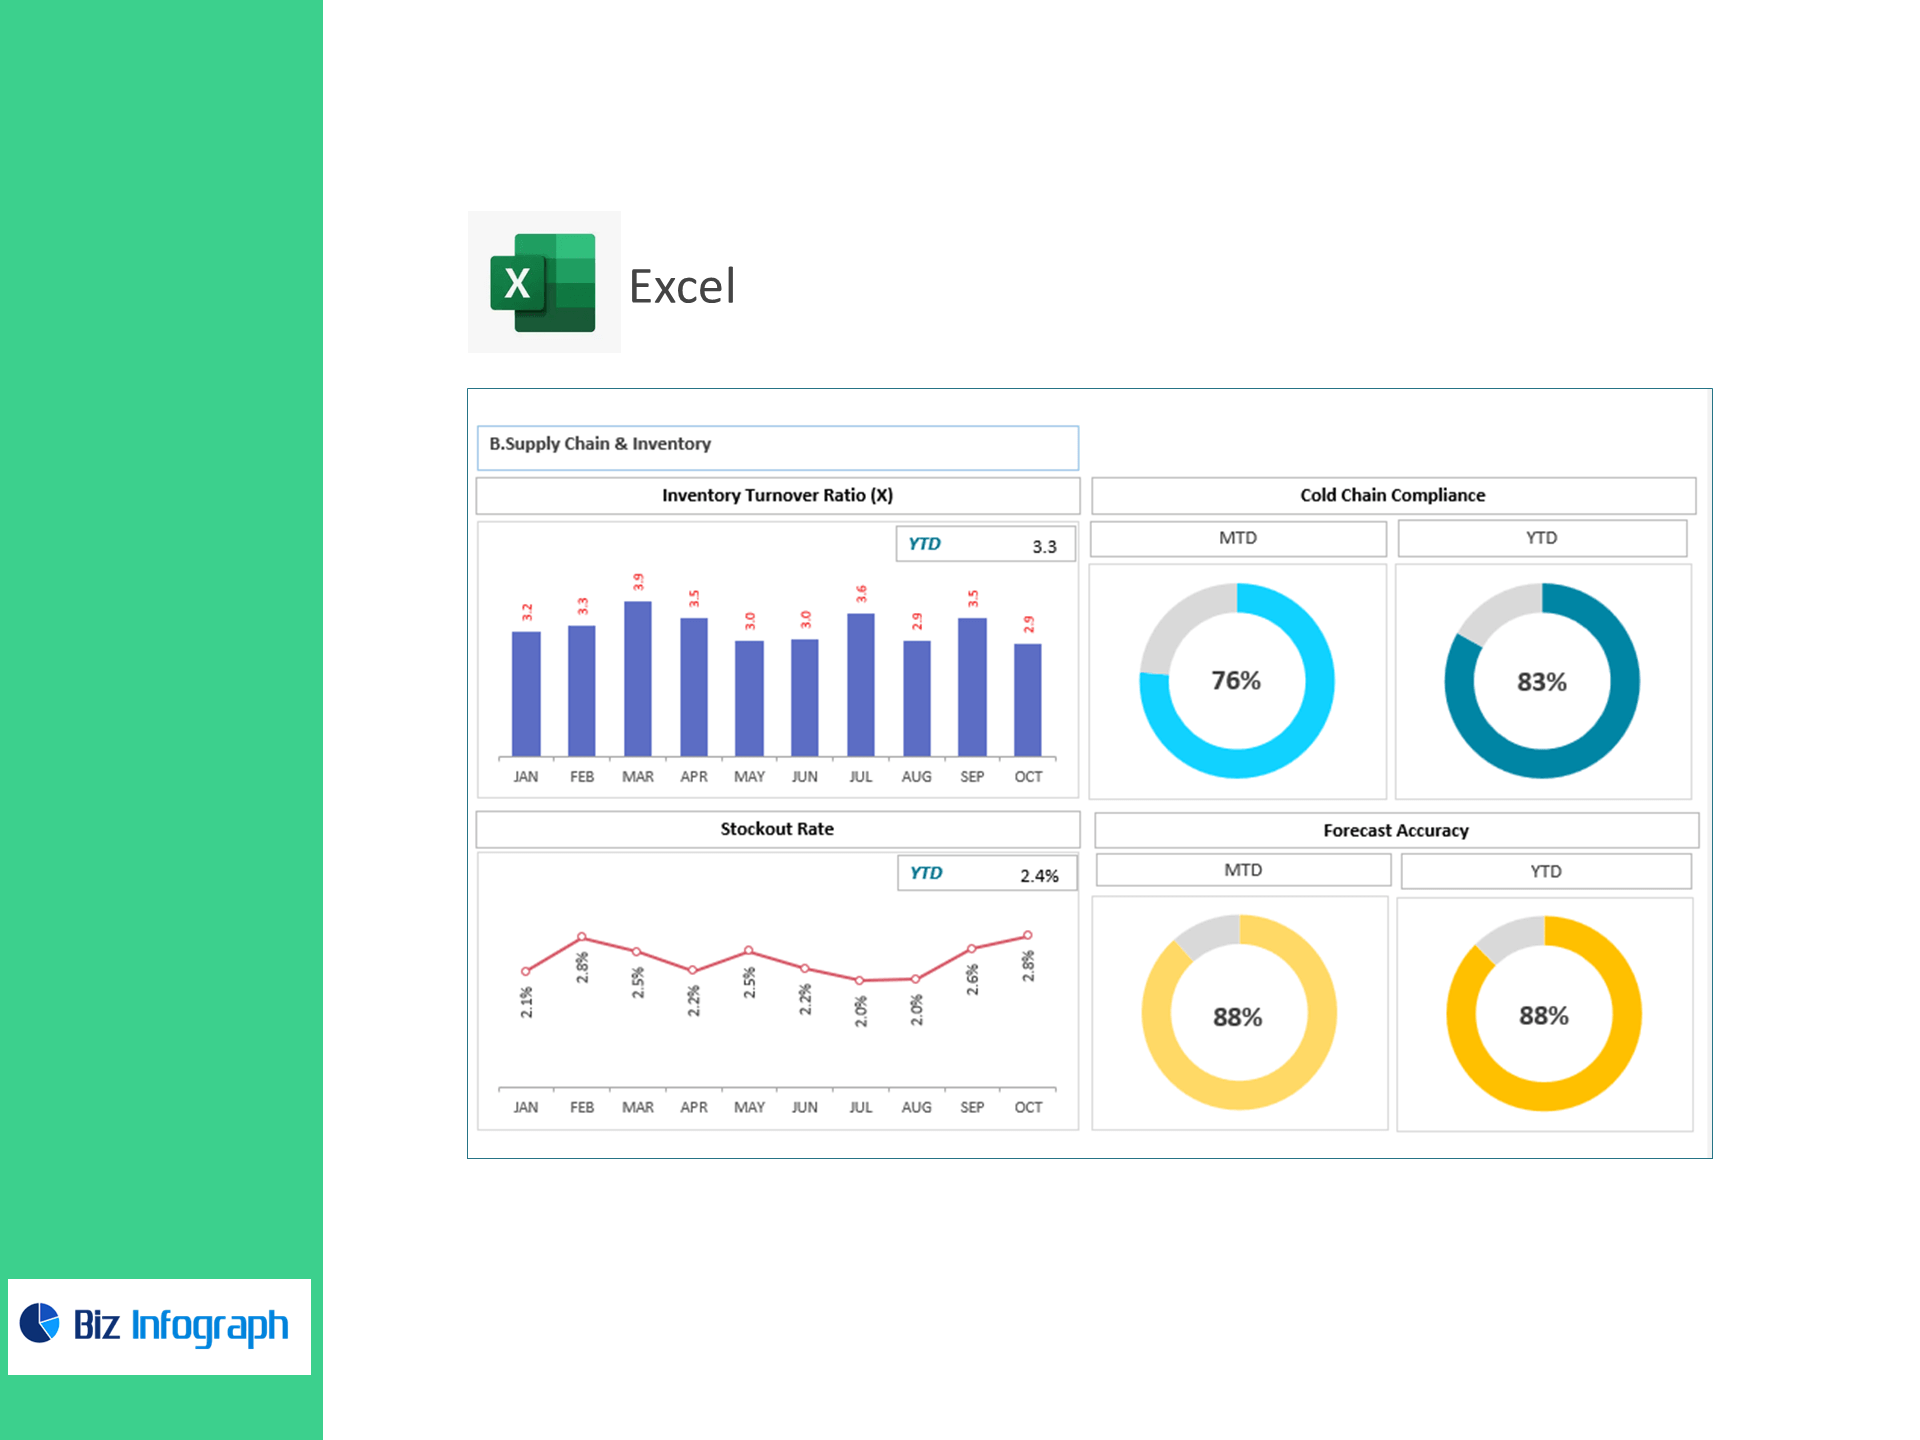
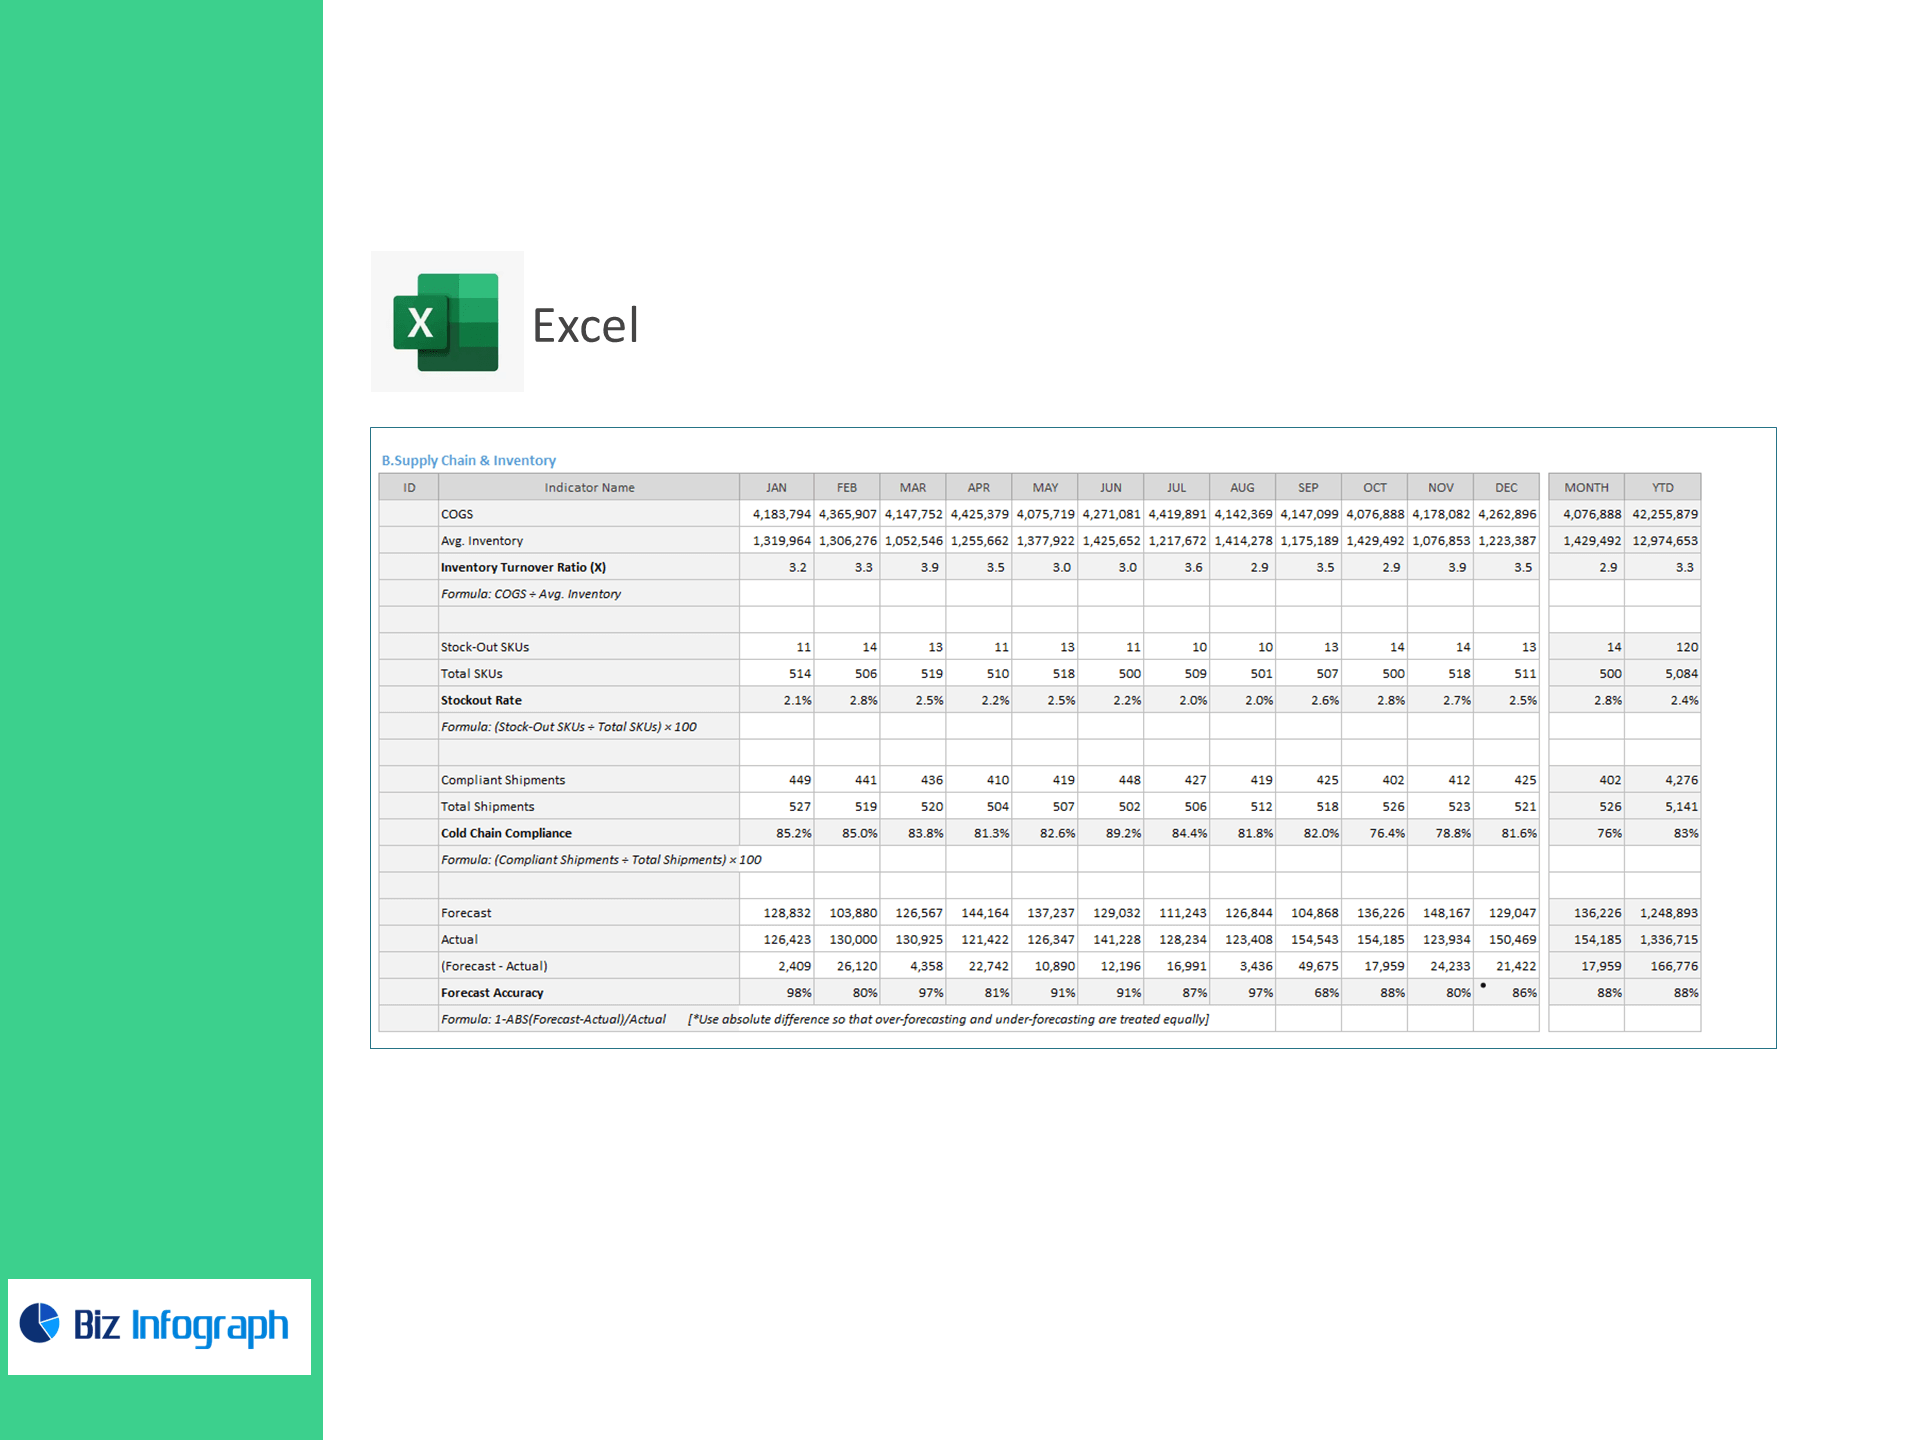
B) Supply Chain & Inventory
-
Inventory Turnover (X)
-
Stockout Rate (by SKU/brand)
-
Cold-Chain Compliance (compliant ÷ total shipments)
-
Forecast Accuracy (uses absolute error so over/under forecasts are treated equally)
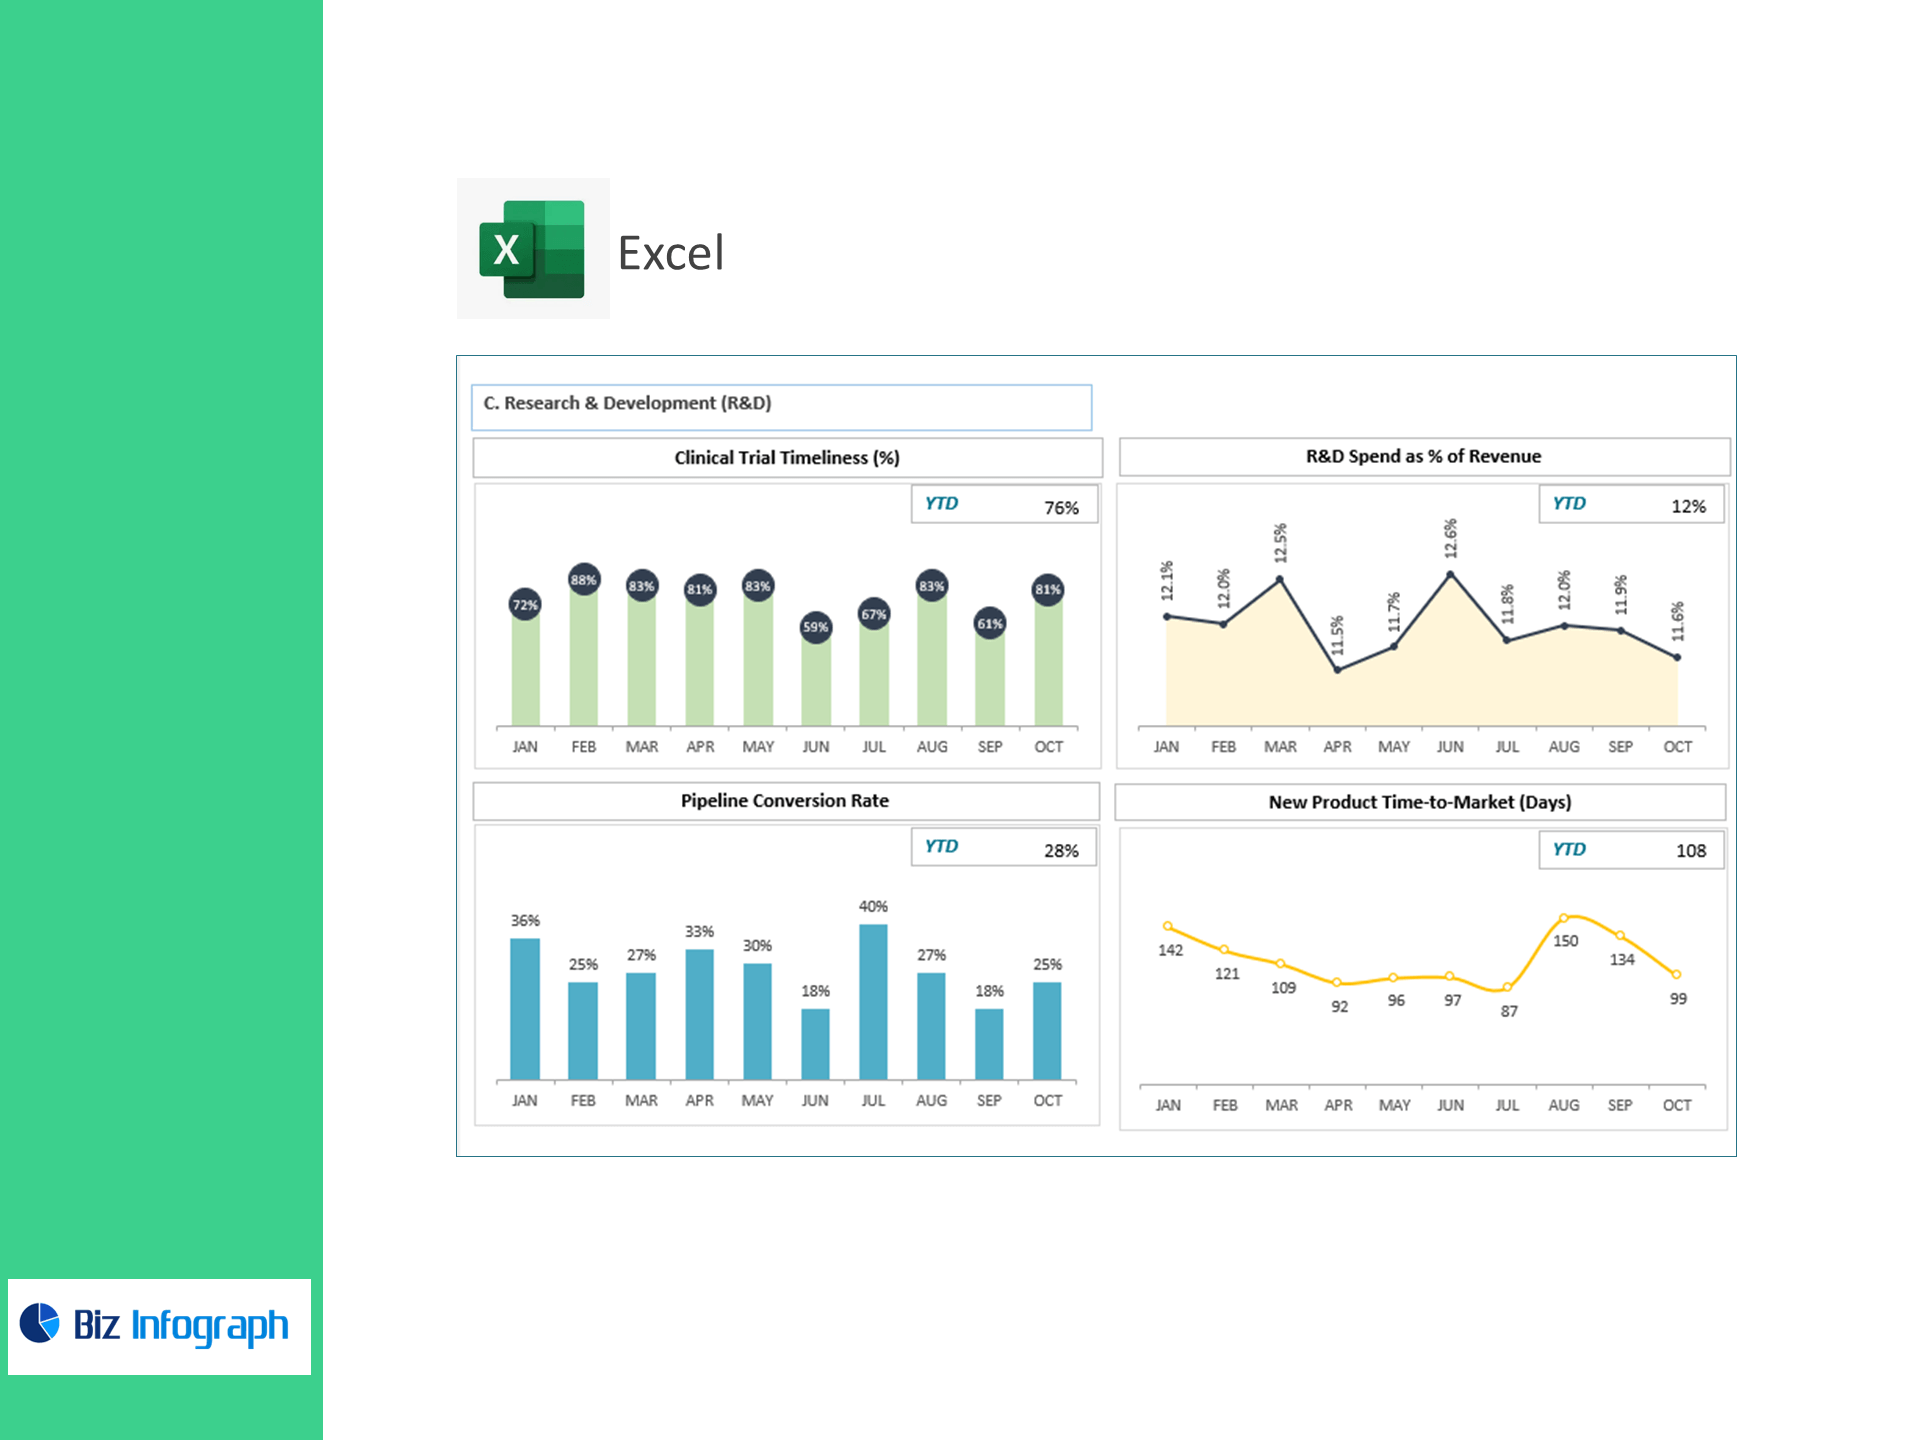
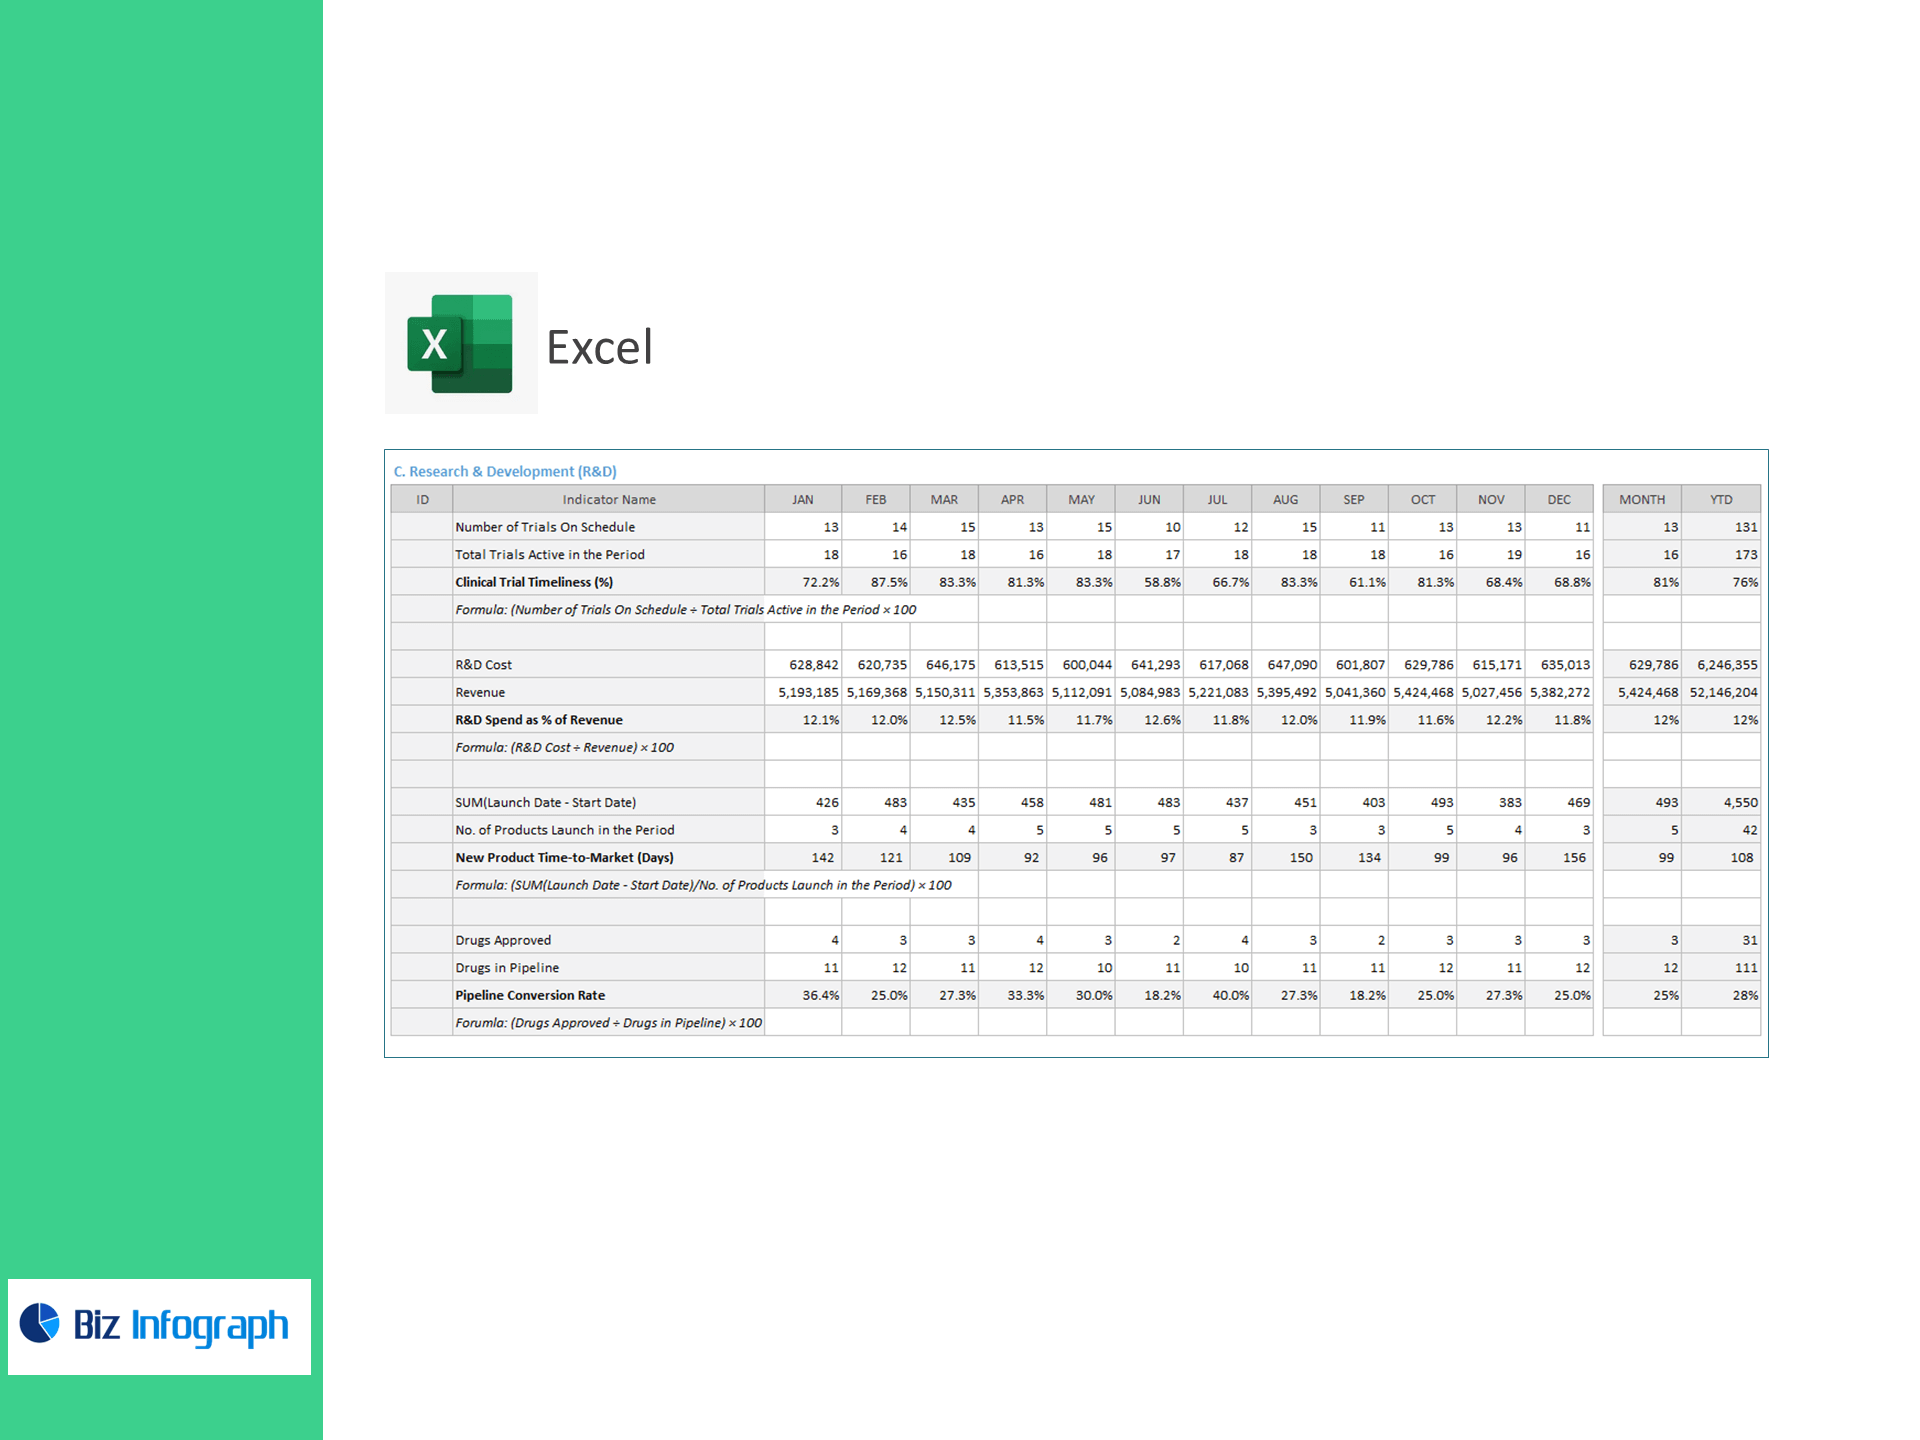
C) R&D (Research & Development)
-
Clinical Trial Timeliness (%)
-
R&D Spend as % of Revenue
-
New Product Time-to-Market (days)
-
Pipeline Conversion Rate (drugs approved ÷ pipeline)
Why teams choose this template
-
End-to-end visibility: See how supply reliability and forecast quality shape commercial KPIs—and how pipeline health feeds future revenue.
-
Proactive risk control: Stockouts, cold-chain slippage, and late trials surface instantly with red/amber/green thresholds.
-
Faster decisions: Compare markets, SKUs, and study phases with slicers; pinpoint underperforming products or sites in seconds.
-
Board-ready outputs: Clean KPI cards, trend lines, and variance views export perfectly to PowerPoint or PDF.
What’s inside
-
Executive dashboard (Commercial • Supply Chain • R&D tabs)
-
Drill-downs by product, SKU, market, distributor, study, and phase
-
OTIF & fill-rate service scorecard, returns heat map, stockout tracker
-
Forecast accuracy & bias panel (MAPE/AE ready if you add columns)
-
Clinical portfolio view (on-schedule vs. at-risk), TTM calculator
-
Data worksheet (paste CSV/ERP/CTMS exports) + one-click refresh
-
Works with Excel 365/2021 (Win/Mac). No macros required.
For ready-to-use Dashboard Templates: