
Sales Pipeline Dashboard Template - Sales Dashboard Example
Sales Pipeline Dashboard is an Excel Template that will help to manage your sales in various dimensions. This template is designed to see your overall sales pipeline stages and the expected amount of sales to realize.
Defining a Sales Dashboard
A sales dashboard is a visual representation tool that aggregates and displays key sales data and metrics in real-time. It allows sales teams and managers to monitor performance, track sales goals, and make data-driven decisions. By consolidating complex sales data into an easily digestible format, a dashboard provides immediate insights into a sales team's performance, highlighting areas of success and those needing improvement.
Importance of Sales Dashboards in Decision-Making
Sales dashboards are crucial for driving sales performance and strategy. They offer a clear view of sales activities, conversion rates, and the sales cycle length, enabling sales managers and representatives to identify trends, set targets, and refine sales strategies. By leveraging real-time data and analytics, sales dashboards allow for swift, informed decision-making, which can significantly impact the bottom line and sales goals achievement.
Understanding Sales Pipeline Dashboards
What is a Sales Pipeline Dashboard?
A sales pipeline dashboard focuses specifically on the stages of the sales cycle, from initial contact to closing deals. It visualizes the flow of potential sales or leads through the pipeline, providing insights into the volume, value, and conversion rate at each stage. This specialized dashboard helps sales teams understand where bottlenecks may occur and which sales opportunities to prioritize to maximize revenue growth.
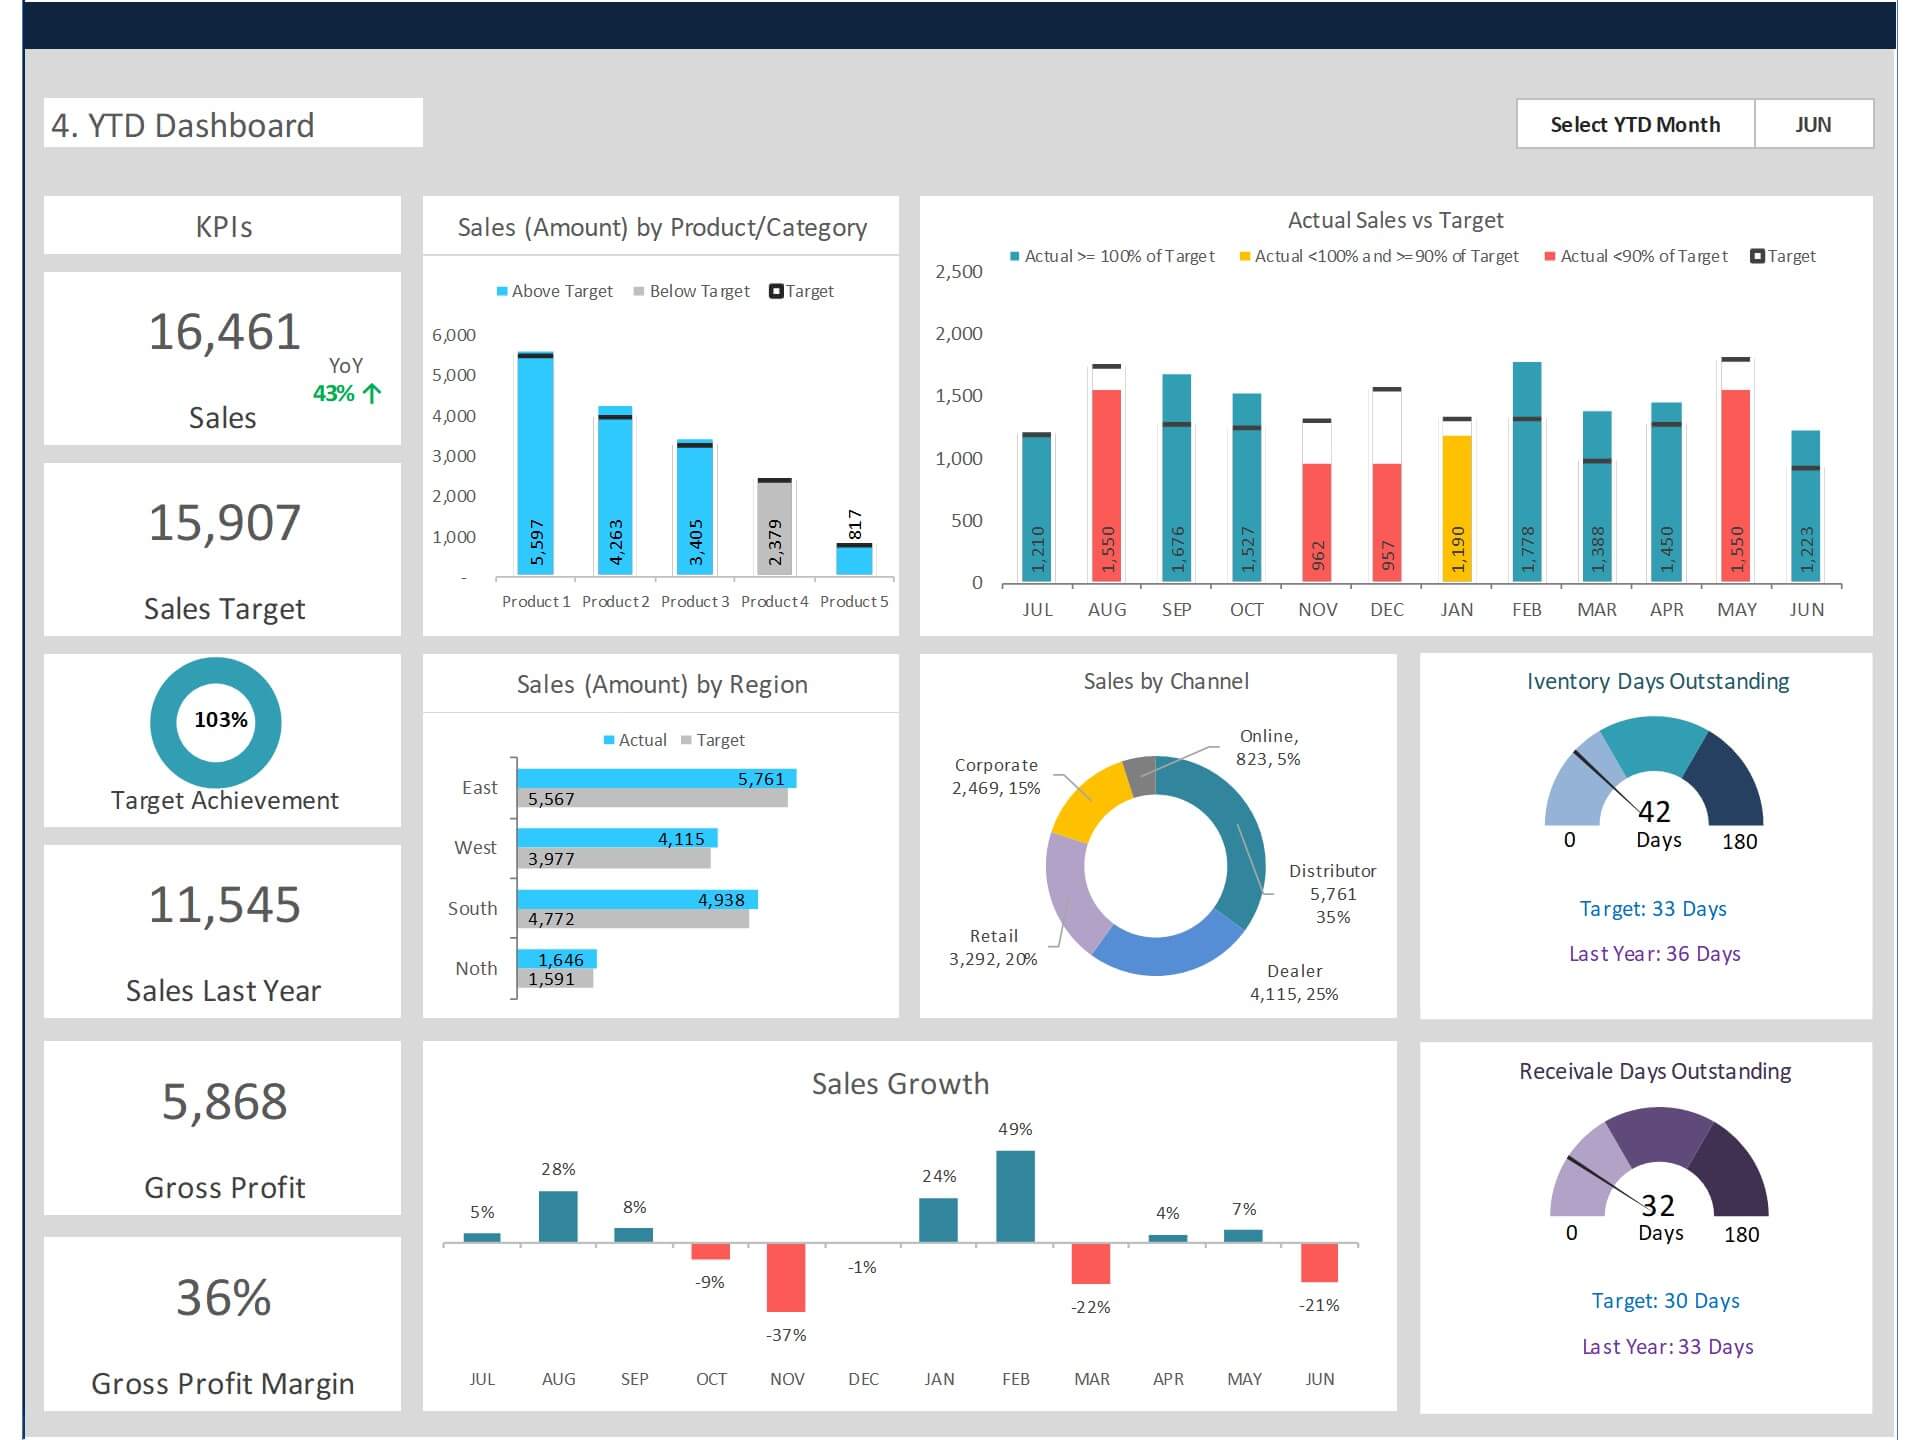
Key Metrics and KPIs to Track
Effective sales pipeline dashboards track a variety of key performance indicators (KPIs) and metrics, such as total revenue, average deal size, sales cycle length, and conversion rates by stage. These metrics provide a clear picture of sales health and are essential for forecasting sales and setting realistic sales targets. Incorporating CRM data, sales dashboards present actionable insights that can help in refining sales strategies and processes.
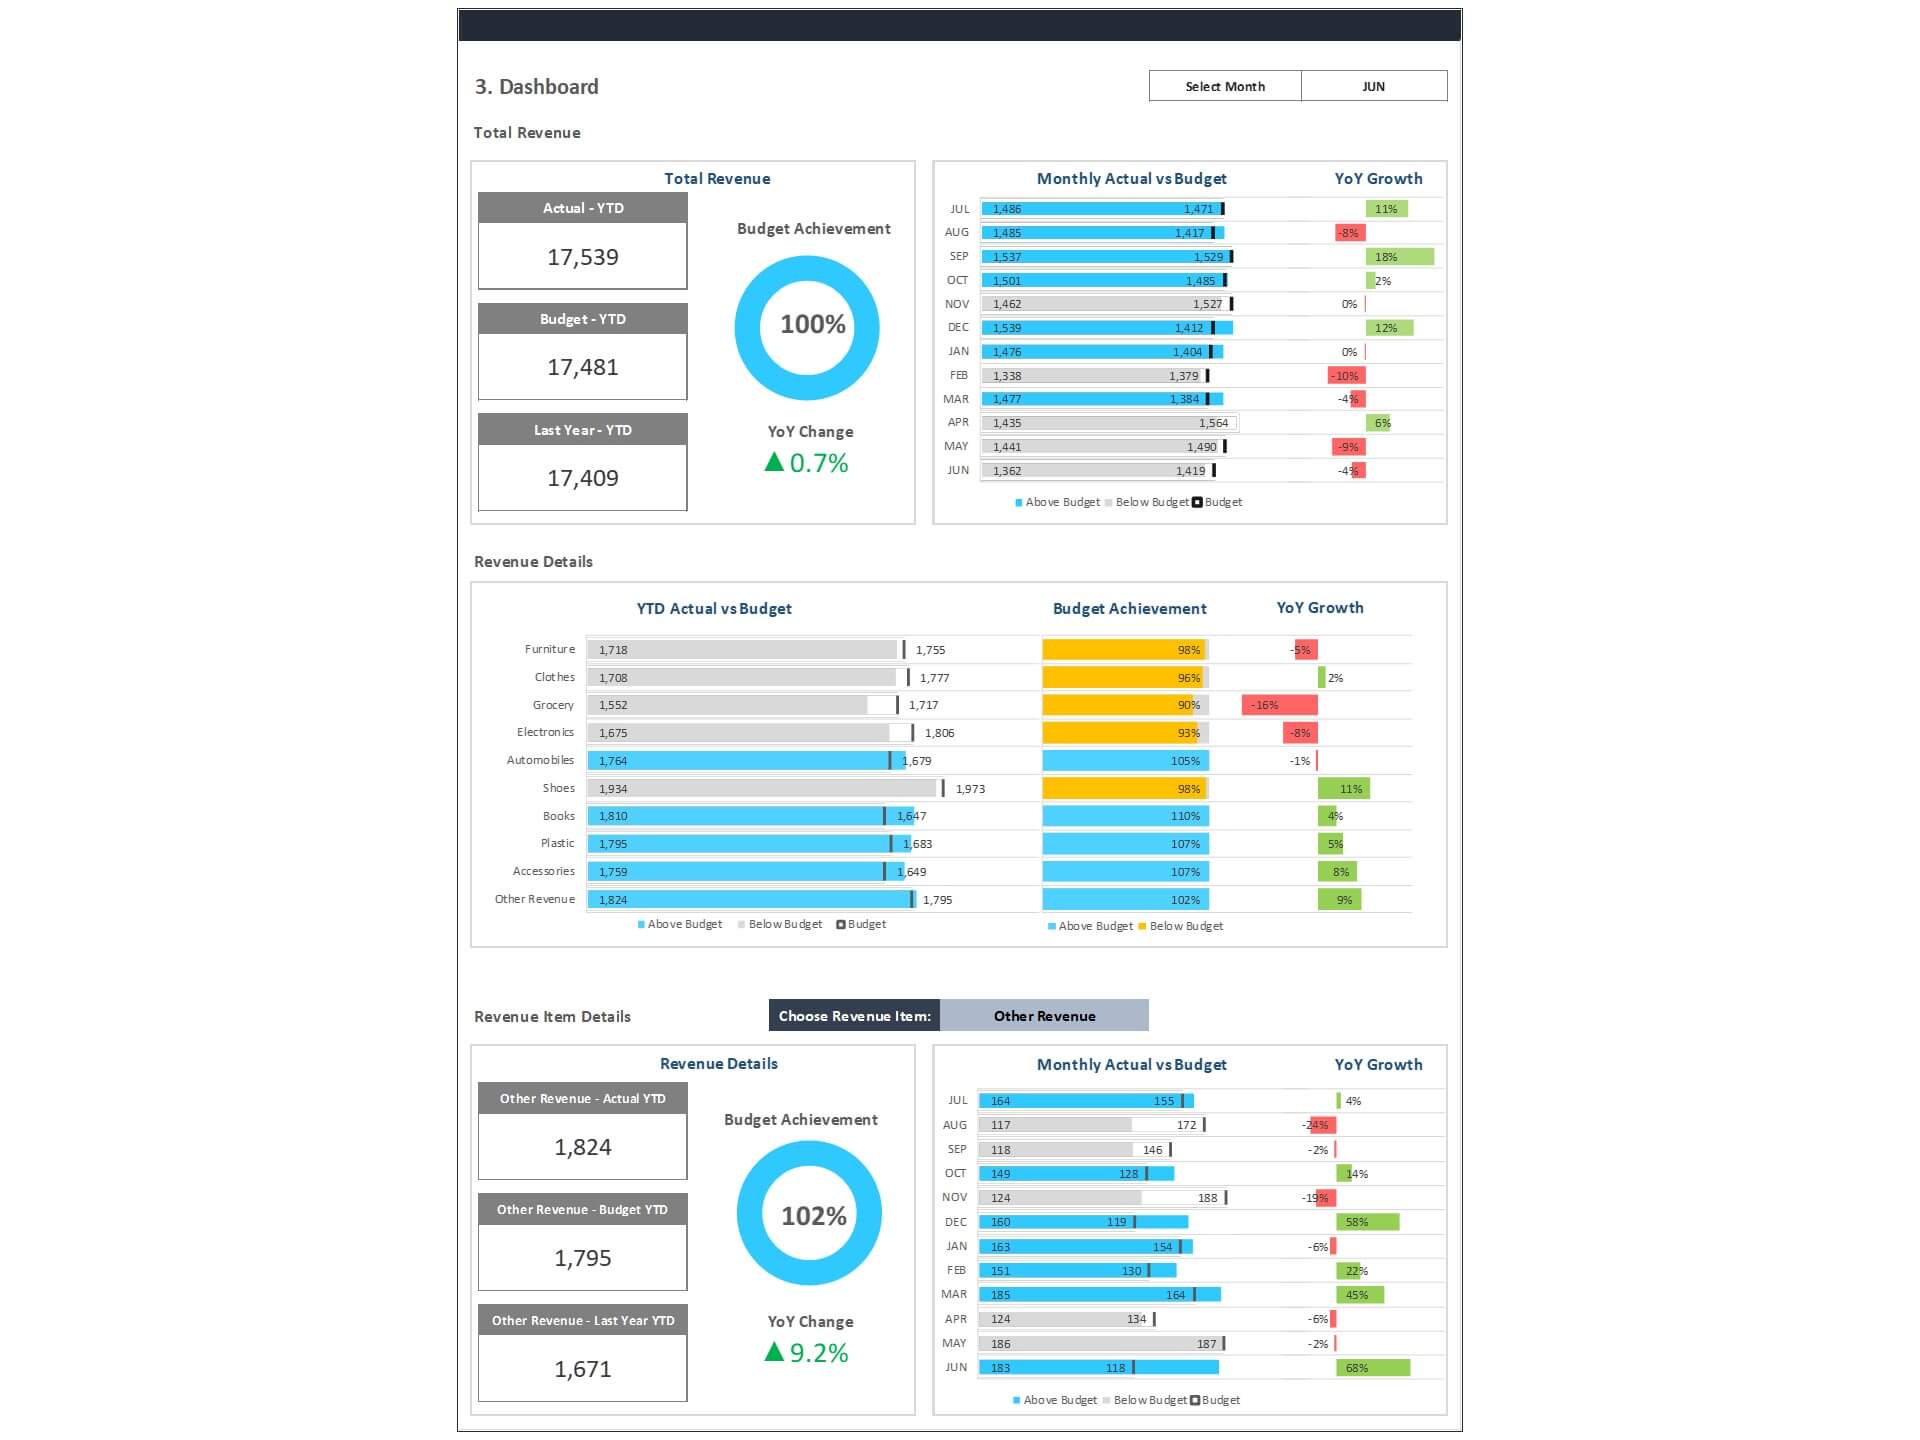
Examples of Sales Pipeline Visualization
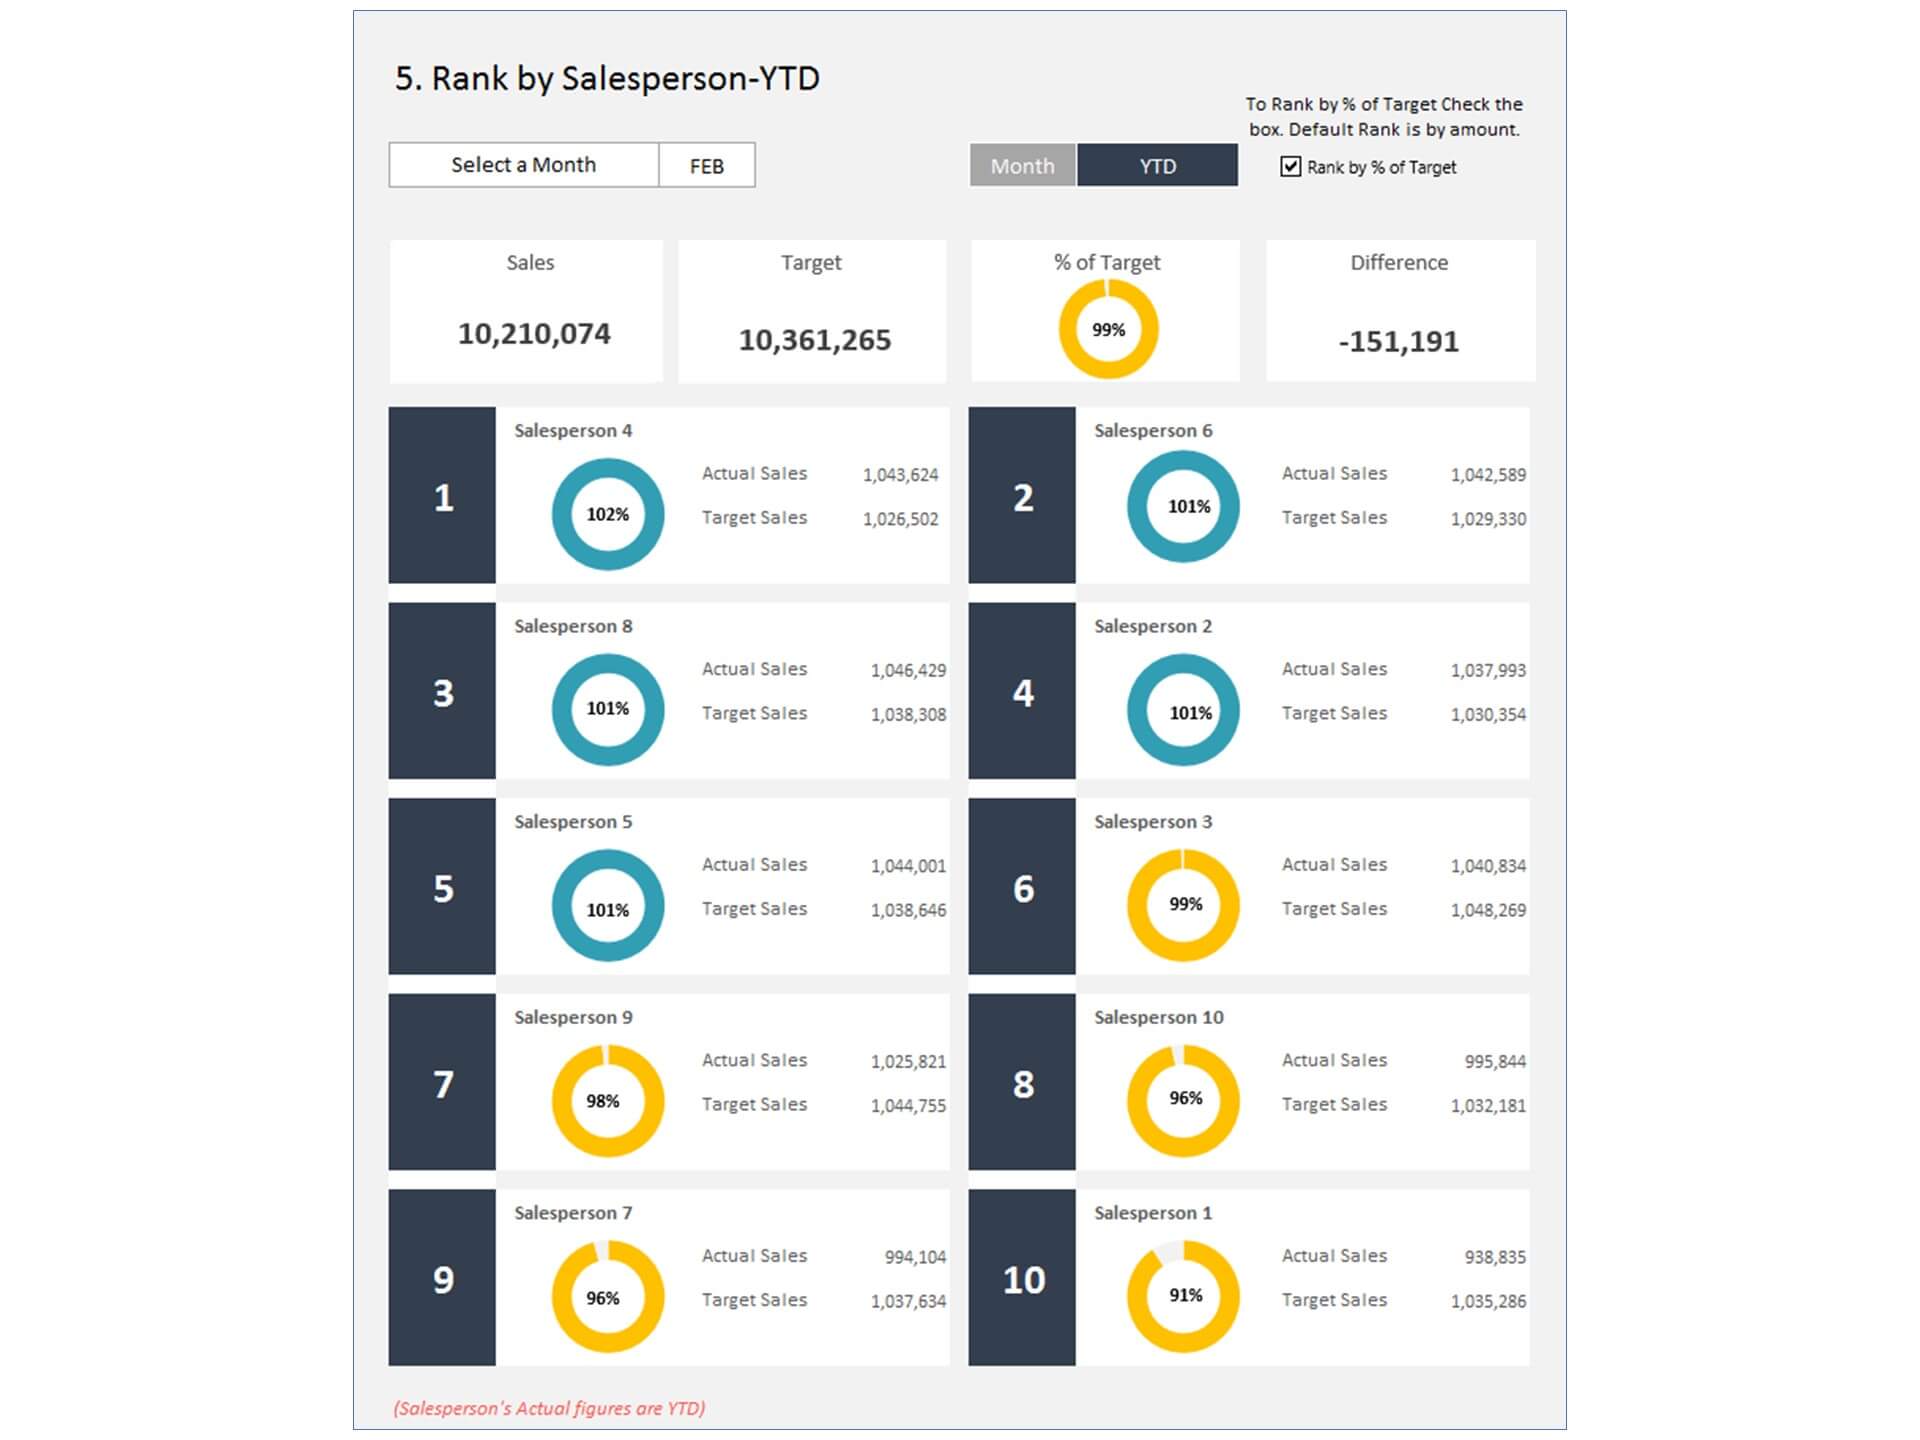
Sales pipeline visualization often includes bar charts, funnel graphics, and line graphs, offering a clear view of the current sales status. Dashboard examples typically showcase the number of deals in each pipeline stage, the average sales cycle length, and the conversion rate, enabling sales representatives and managers to quickly assess performance and identify areas for action.
Building Effective Sales Dashboards
Steps to Create Sales Dashboards
Creating effective sales dashboards involves several key steps: identifying the main objectives, selecting relevant KPIs and metrics, integrating with CRM or sales data sources, and designing for clarity and ease of use. Sales managers should focus on ensuring that the dashboard is tailored to the specific needs of the sales team, providing the data they need to monitor performance and achieve sales targets.
Incorporating Analytics into Your Dashboard
Incorporating analytics into your sales dashboard enhances its usefulness by providing deeper insights into sales performance and customer behavior. Analytics can help identify patterns, predict sales trends, and offer recommendations for improving sales outcomes. By analyzing sales data, sales teams can make more informed decisions and develop more effective sales strategies.
Best Practices for Dashboard Design
The best sales dashboards are designed for simplicity, relevance, and actionable insights. They should highlight the most important sales KPIs, be easy to interpret, and allow users to drill down for more detailed information. A great sales dashboard balances comprehensive data analysis with user-friendly design, enabling sales professionals to quickly understand their sales performance and take appropriate actions.
Sales Dashboard Examples and Templates
Overview of Dashboard Templates
Dashboard templates serve as a starting point for creating your own sales dashboards. They provide a framework that can be customized to fit the specific needs of your sales team. Templates can range from basic sales performance overviews to comprehensive analytics platforms, featuring pre-built widgets and metrics tailored to sales operations.
Customizing Your Sales Pipeline Dashboard
Customizing your sales pipeline dashboard involves selecting the metrics and KPIs that are most relevant to your sales process and goals. This might include adjusting the dashboard to track individual and team performance, focusing on the key stages of your sales funnel, or integrating new pipeline data. The goal is to create a tool that provides real-time insights tailored to your sales team's specific needs.
Reviewing Example Dashboards for Inspiration
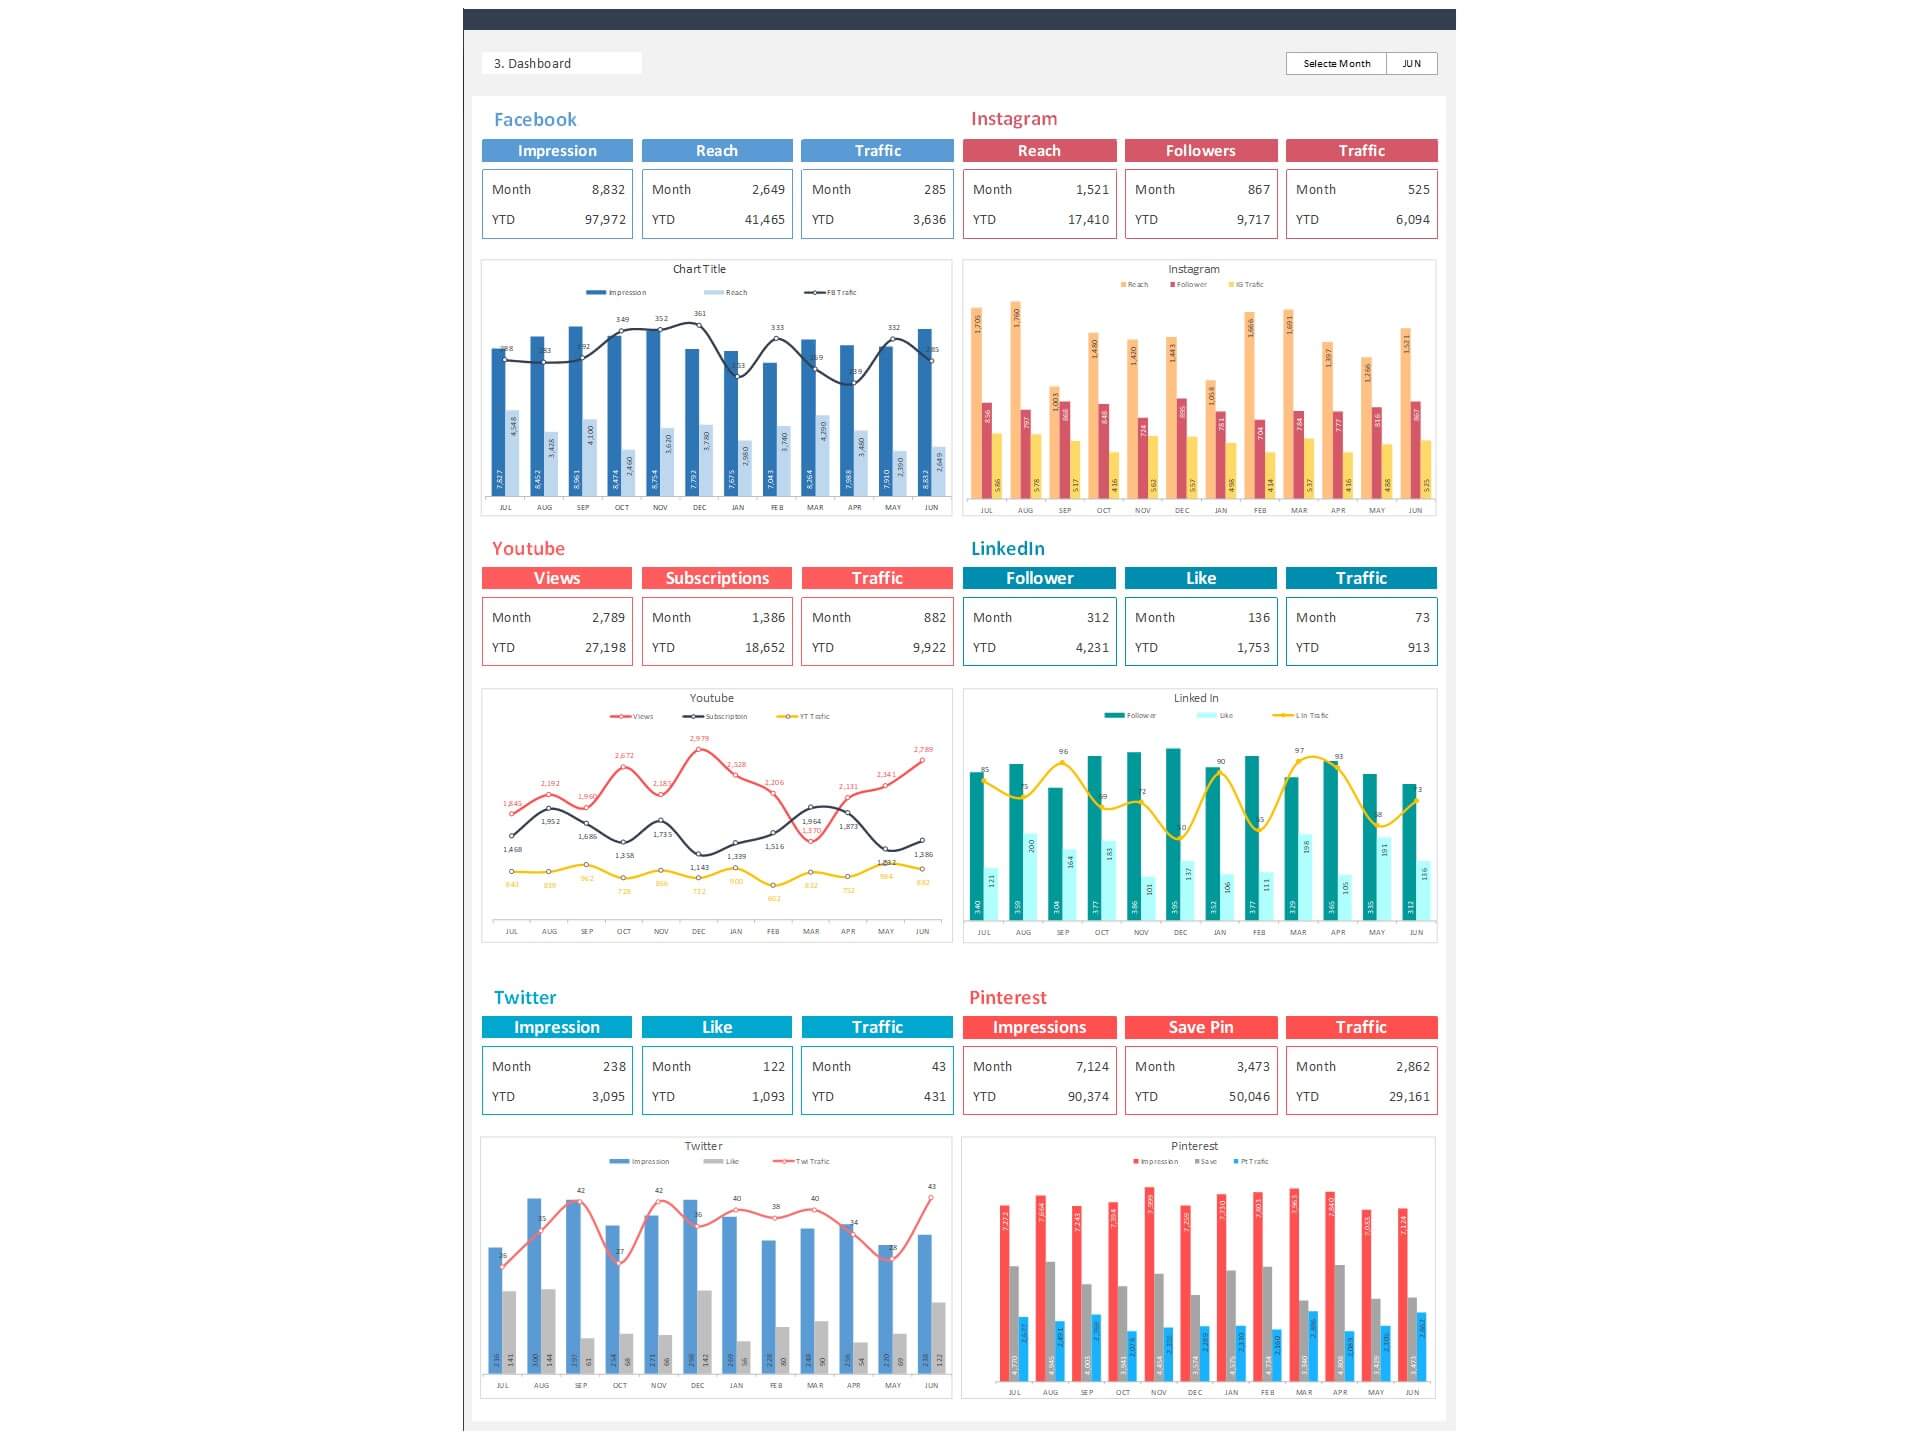
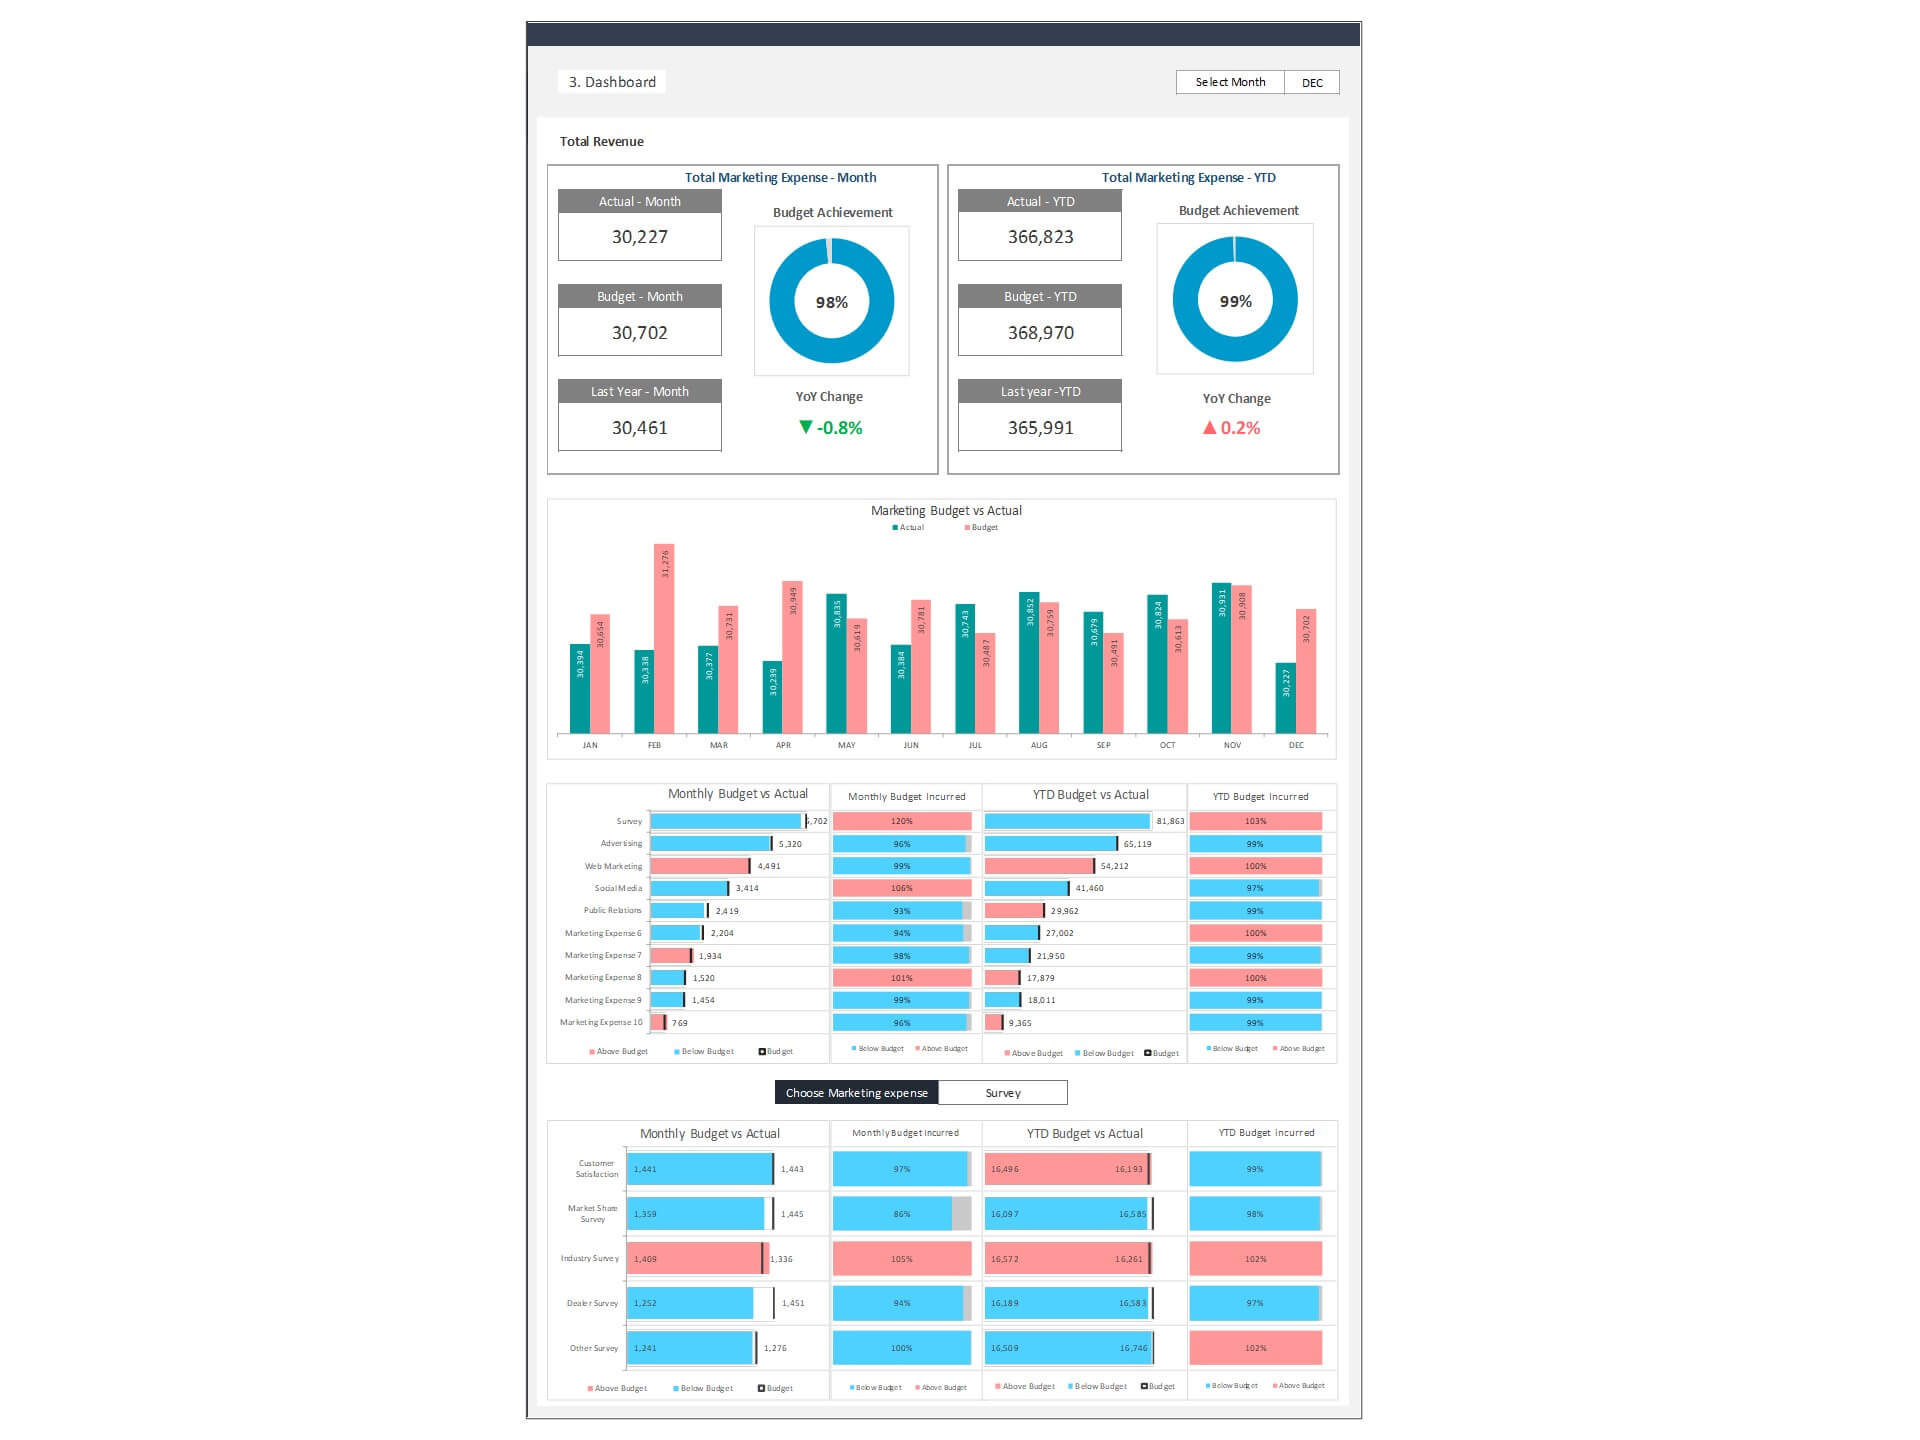
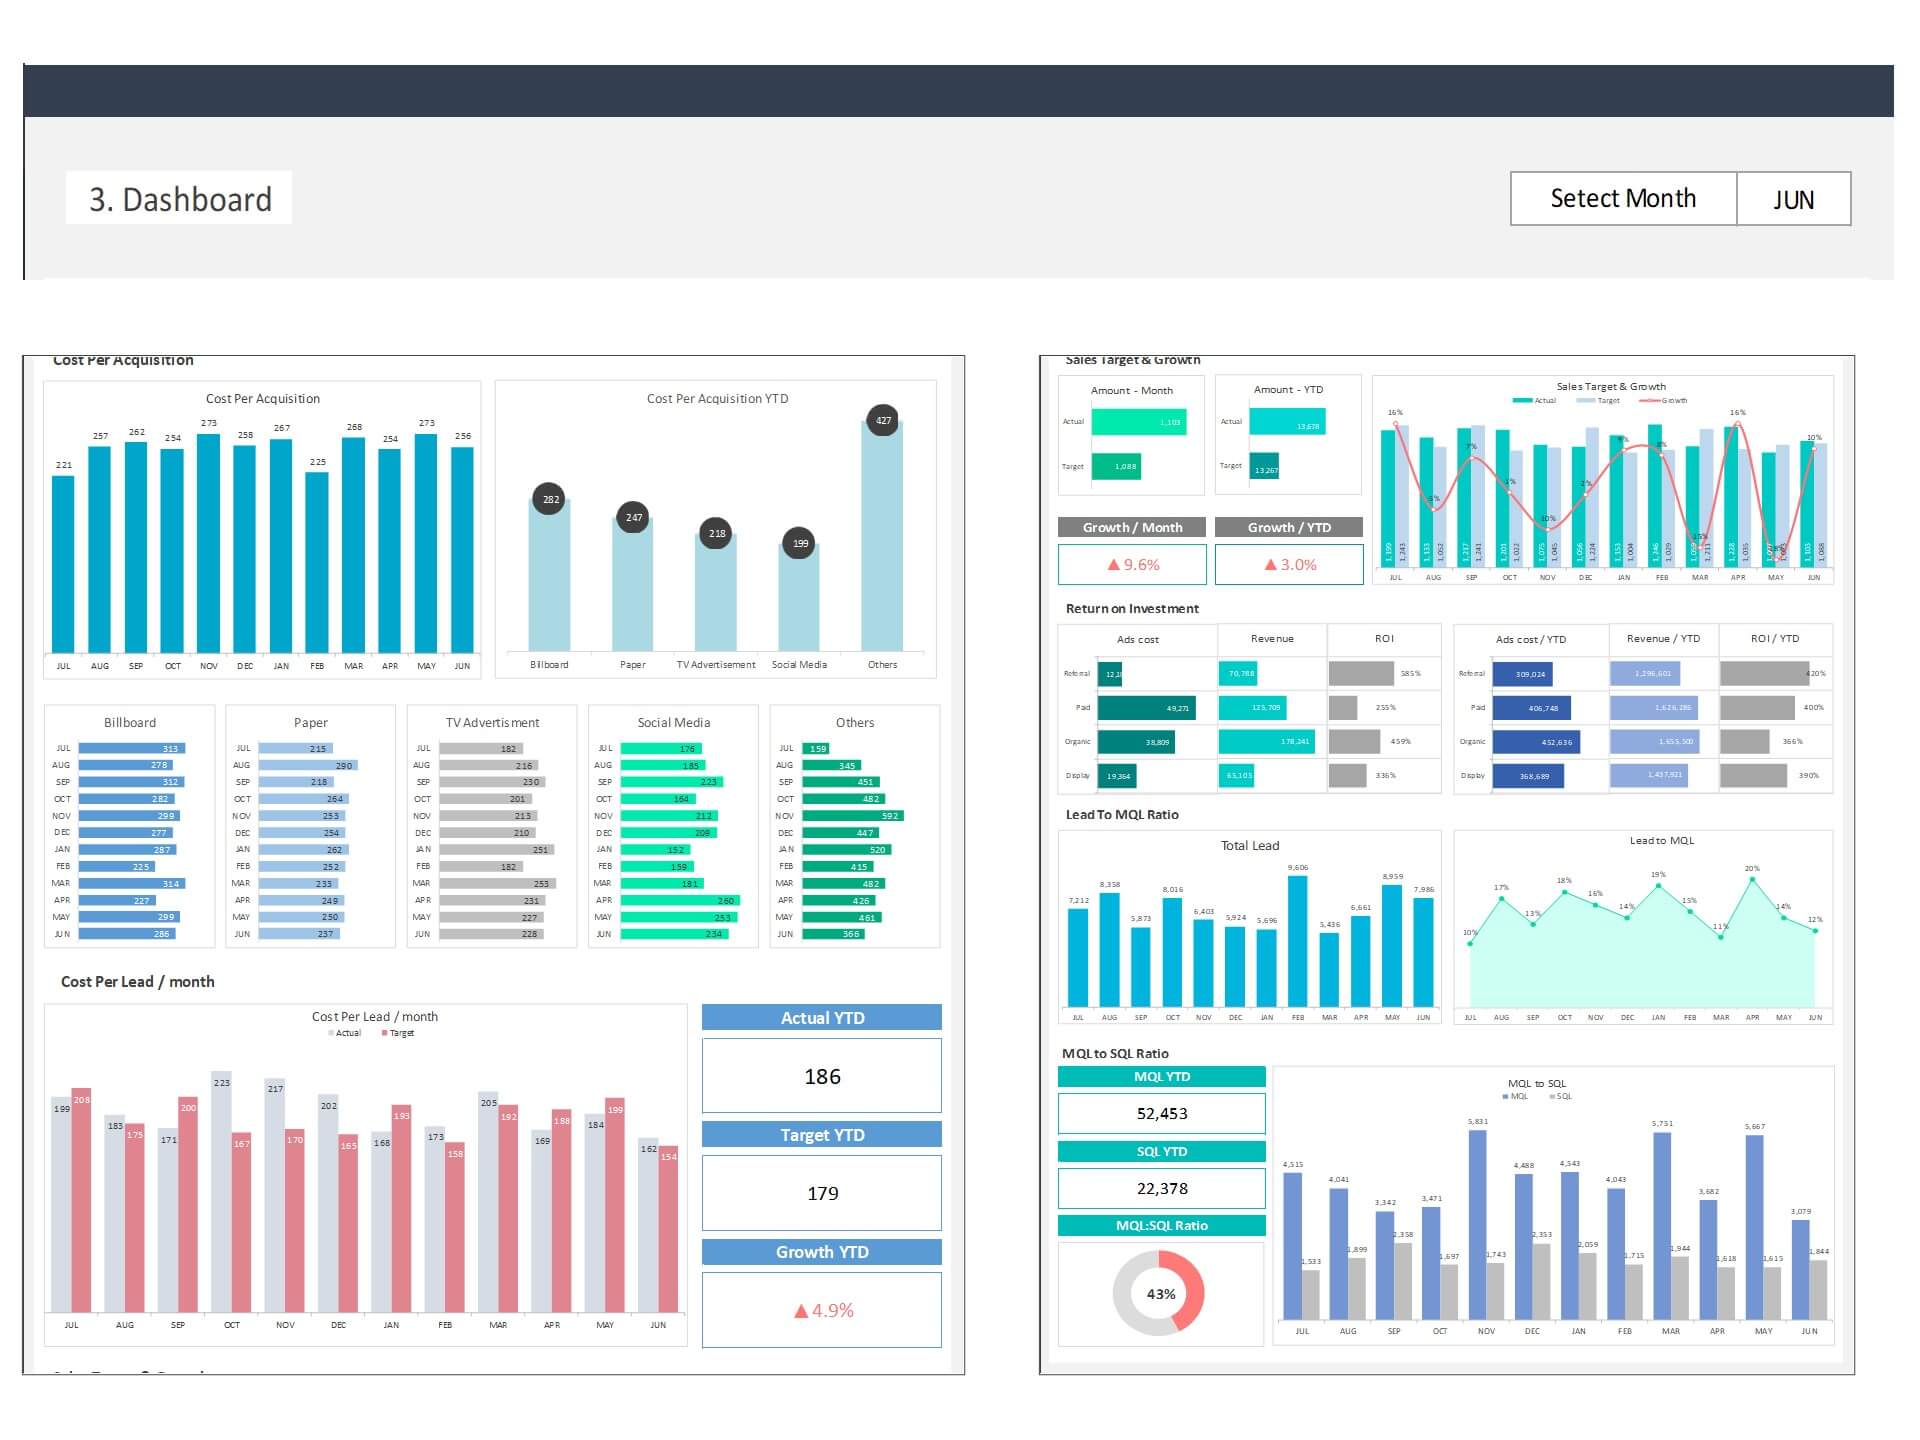
Reviewing example dashboards can provide valuable inspiration for building your own. Examples showcase different layouts, styles, and approaches to presenting sales data. By examining how other companies and sales leaders visualize their sales metrics and KPIs, you can discover new ways to enhance your own dashboard for better clarity and impact.
Advanced Sales Dashboard Features in Excel Templates
Integrating Salesforce and Other Tools with Excel
Integrating Salesforce or other CRM tools with your Excel sales dashboard template enables seamless data synchronization and up-to-date information. By utilizing data import functions or add-ins in Excel, sales teams can automatically pull in detailed customer information, track sales activities, and monitor sales leads. This integration provides a comprehensive view of the sales landscape directly within the familiar Excel environment, enhancing productivity and data accuracy.
Real-Time Sales Performance Tracking in Excel
Implementing real-time sales performance tracking in Excel sales dashboard templates is crucial for dynamic sales environments. By using Excel's data refresh capabilities and connecting to live data sources, sales teams can monitor their progress toward sales targets continuously. Conditional formatting, data bars, and sparklines within Excel allow for immediate visualization of changes in the sales landscape, enabling teams to react promptly and adjust strategies to maintain sales momentum and meet goals.
Utilizing Advanced KPIs for Strategic Insights in Excel
Incorporating advanced KPIs into your Excel sales dashboard template can provide deeper insights into sales performance and customer behavior. Excel's advanced analytical tools, such as Power Query and Power Pivot, enable sales leaders to analyze complex datasets and uncover metrics like customer lifetime value, lead scoring, and sales rep efficiency. These insights can reveal hidden opportunities and areas for improvement, allowing for the development of targeted sales strategies and improved business outcomes. By leveraging Excel's extensive formula capabilities and pivot tables, sales executives can customize their dashboards to focus on the KPIs that matter most, driving strategic decision-making and sales success.
Maximizing the Impact of Your Sales Dashboard
Driving Sales Performance with Effective Metrics
Driving sales performance requires focusing on the right metrics that align with your business goals and sales strategies. Effective sales dashboards highlight these metrics, enabling sales teams to monitor their progress and identify areas where they can improve. By continually analyzing sales data, teams can adapt their approaches to meet and exceed sales targets.
Tips for Maintaining an Executive Sales Dashboard
An executive sales dashboard should provide a high-level overview of sales performance, focusing on key metrics and trends. To maintain an effective dashboard, regularly update the data sources, review the relevance of displayed KPIs, and ensure the dashboard remains aligned with the company's strategic objectives. This ensures that sales executives have the insights needed to make informed decisions.
Making Informed Decisions with Your Dashboard Data
The ultimate goal of a sales dashboard is to enable data-driven decision-making. By providing a clear, concise view of sales performance and trends, a dashboard helps sales leaders make informed decisions about sales strategies, resource allocation, and market opportunities. The insights gained from a well-designed sales dashboard can lead to significant improvements in sales efficiency and effectiveness.
Conclusion: The Future of Sales Dashboards
Evolving Your Dashboard with Your Business
As your business grows and evolves, so should your sales dashboard. Regularly revisiting and updating your dashboard ensures that it continues to provide relevant and actionable insights. This might involve integrating new data sources, adopting new metrics, or refining the dashboard layout to better meet the needs of your sales team.
Staying Ahead with Great Sales Dashboard Practices
Staying ahead in sales requires continuous improvement and adaptation. By following great sales dashboard practices, incorporating feedback from sales teams, and leveraging the latest technologies and data analysis techniques, companies can ensure their sales dashboards remain powerful tools for driving sales performance and achieving business success.
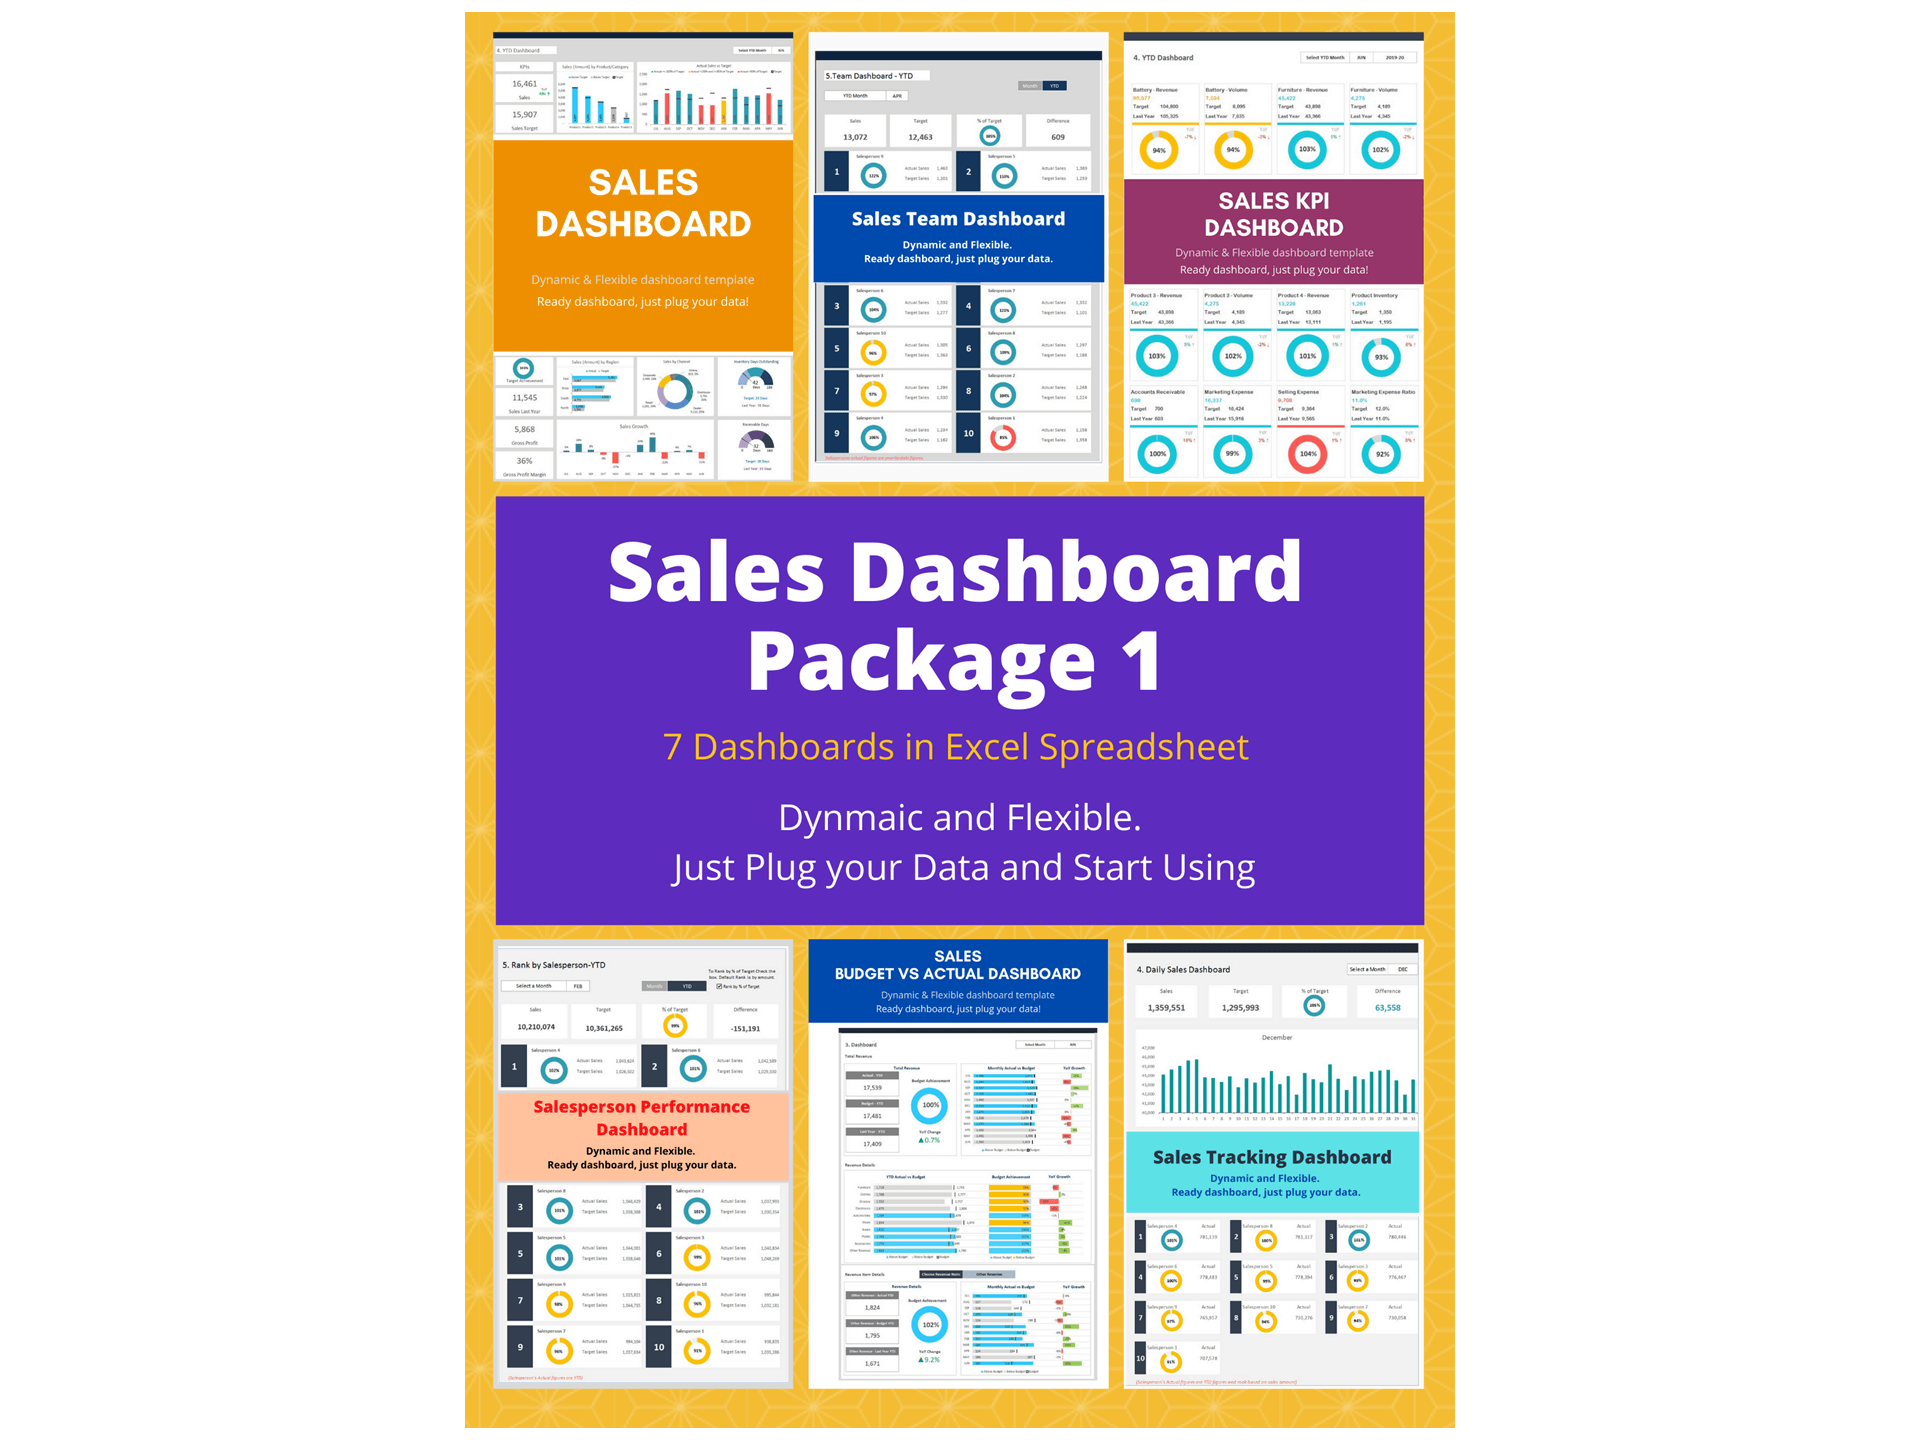
Key Features of our Dashboard Template:
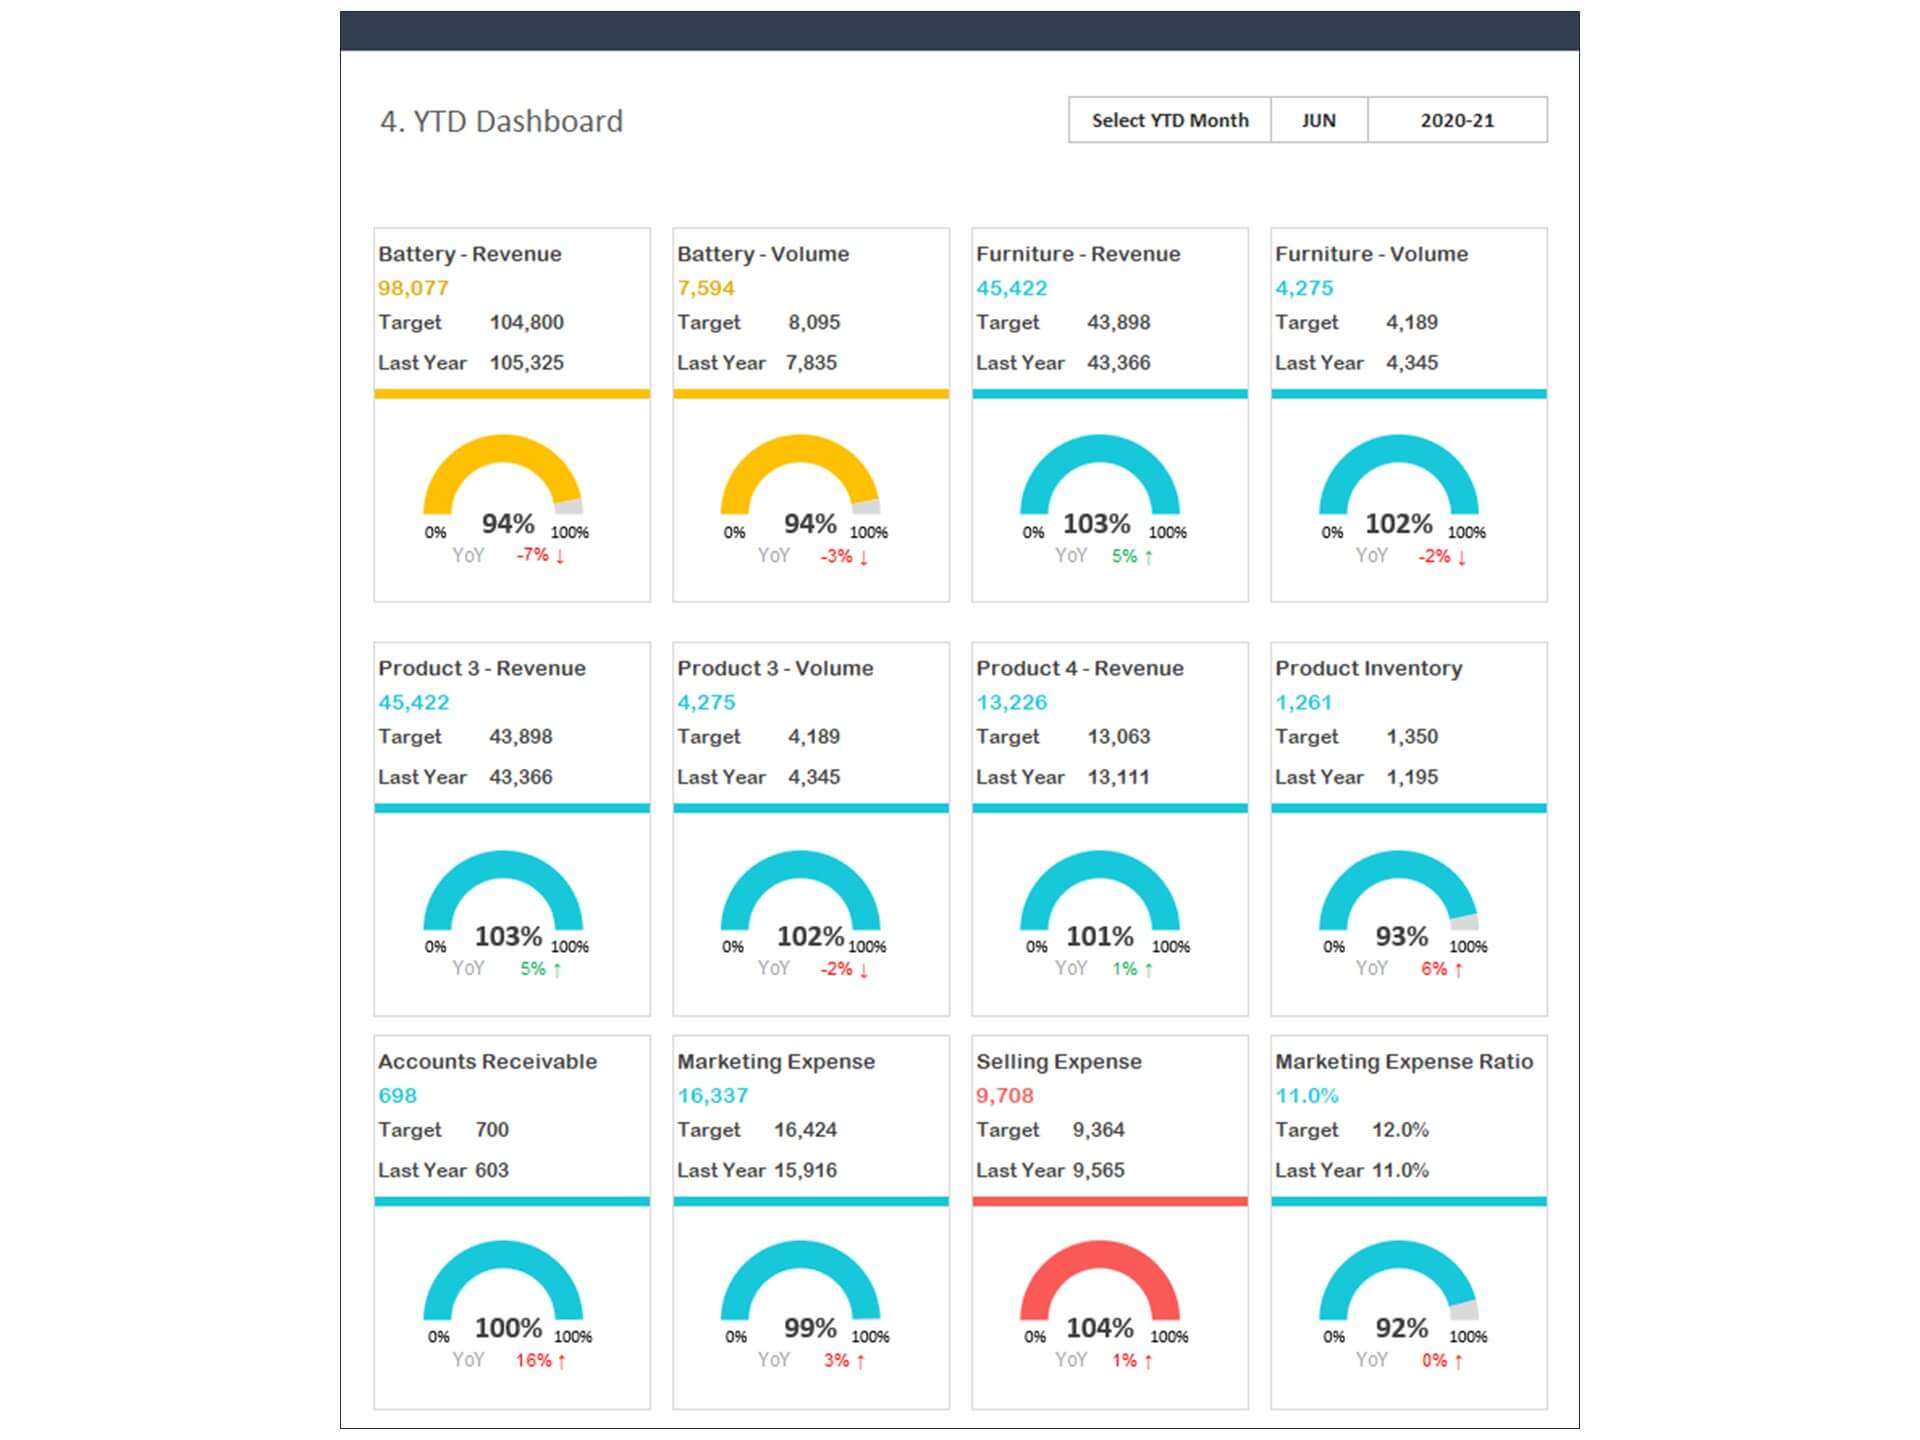
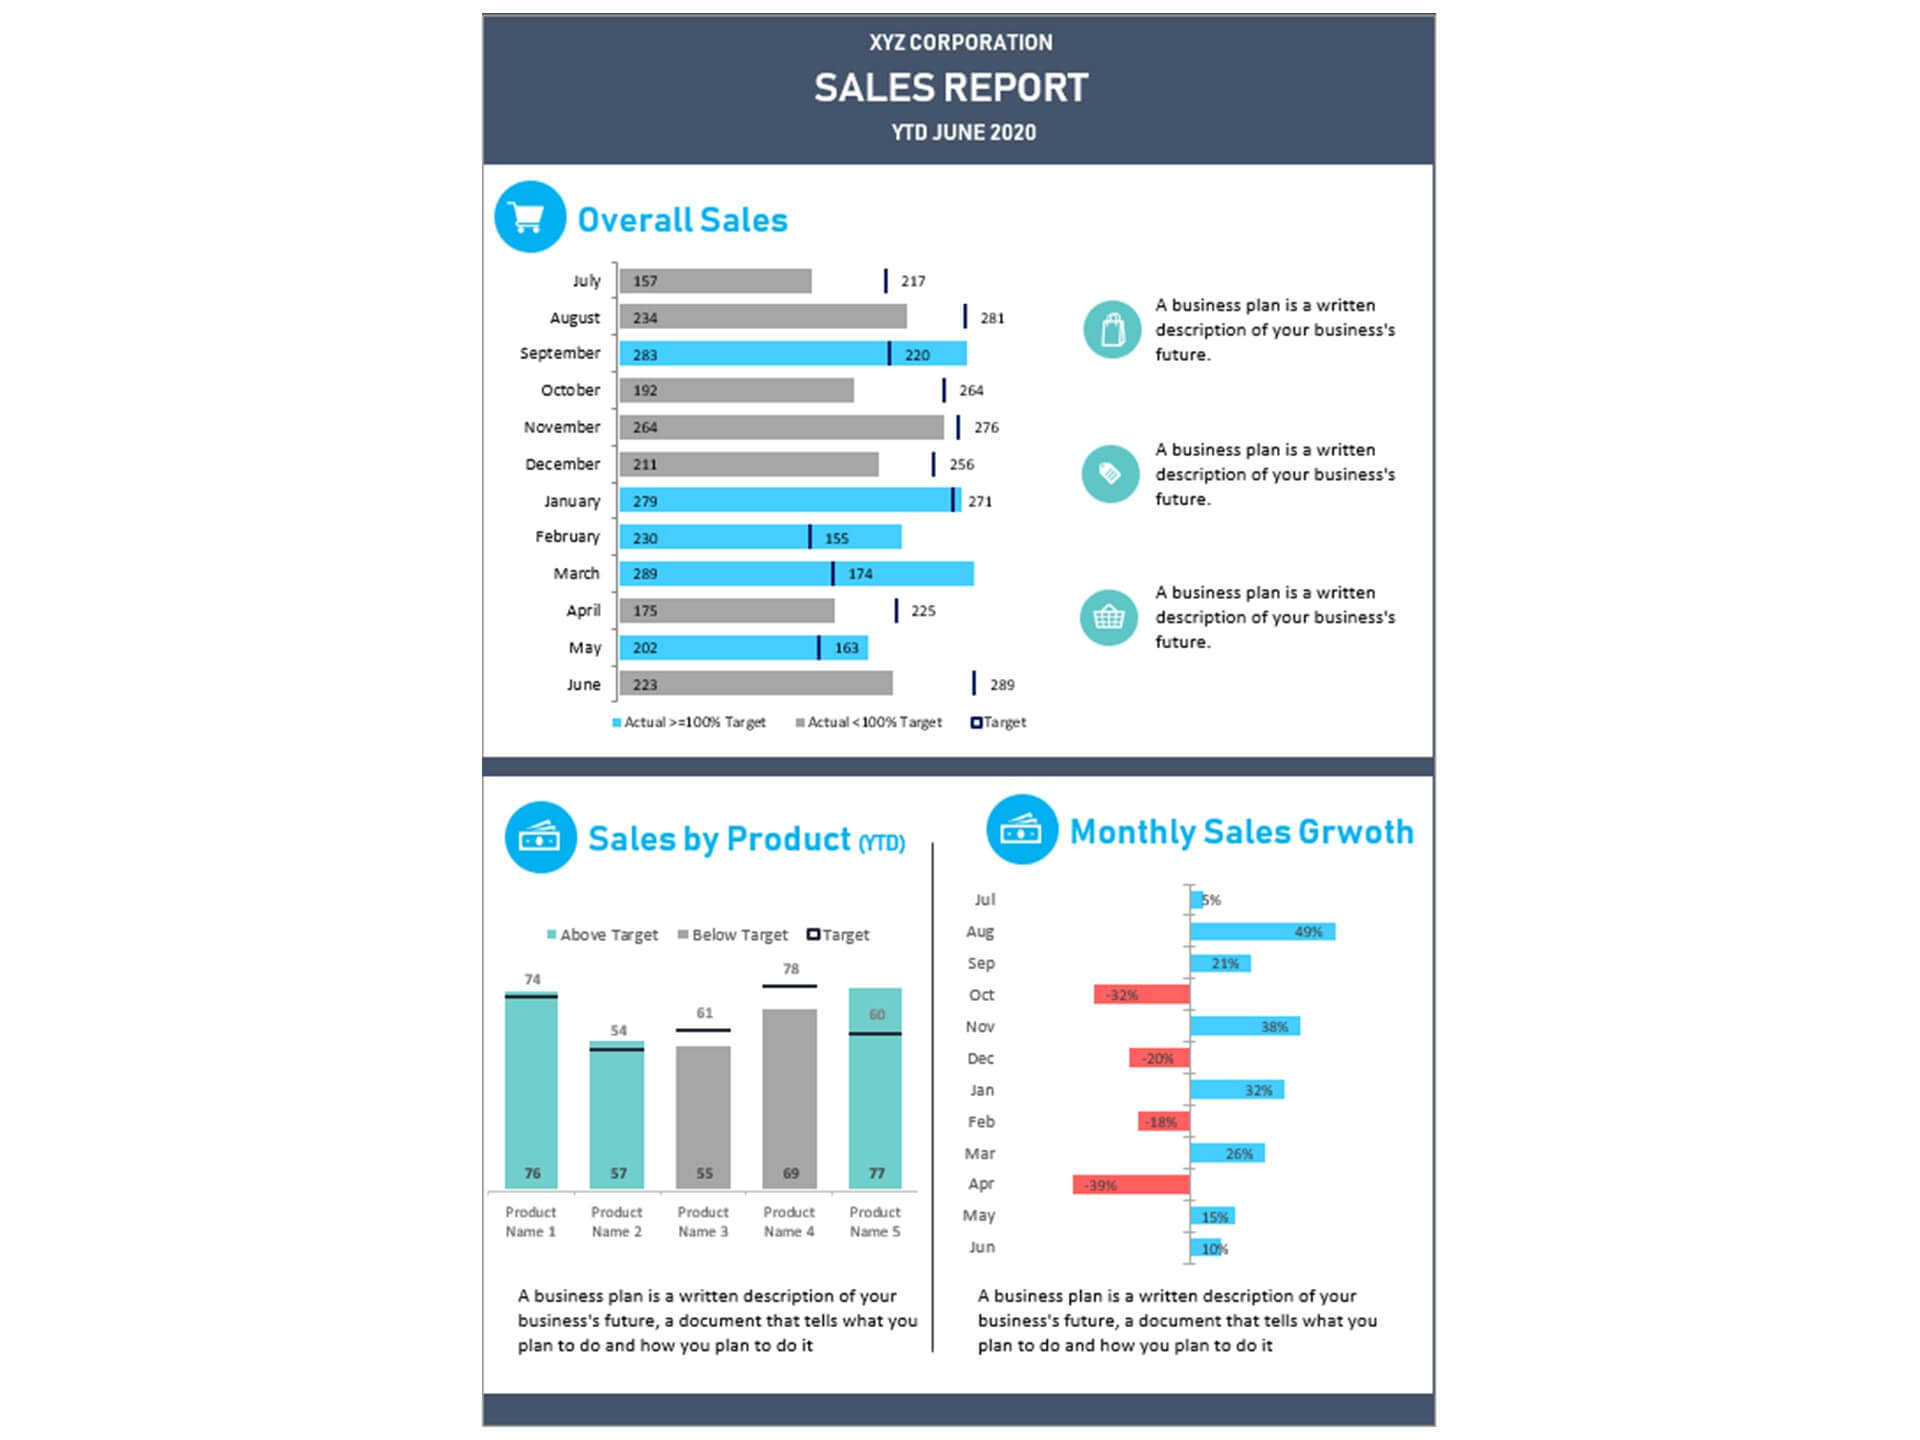
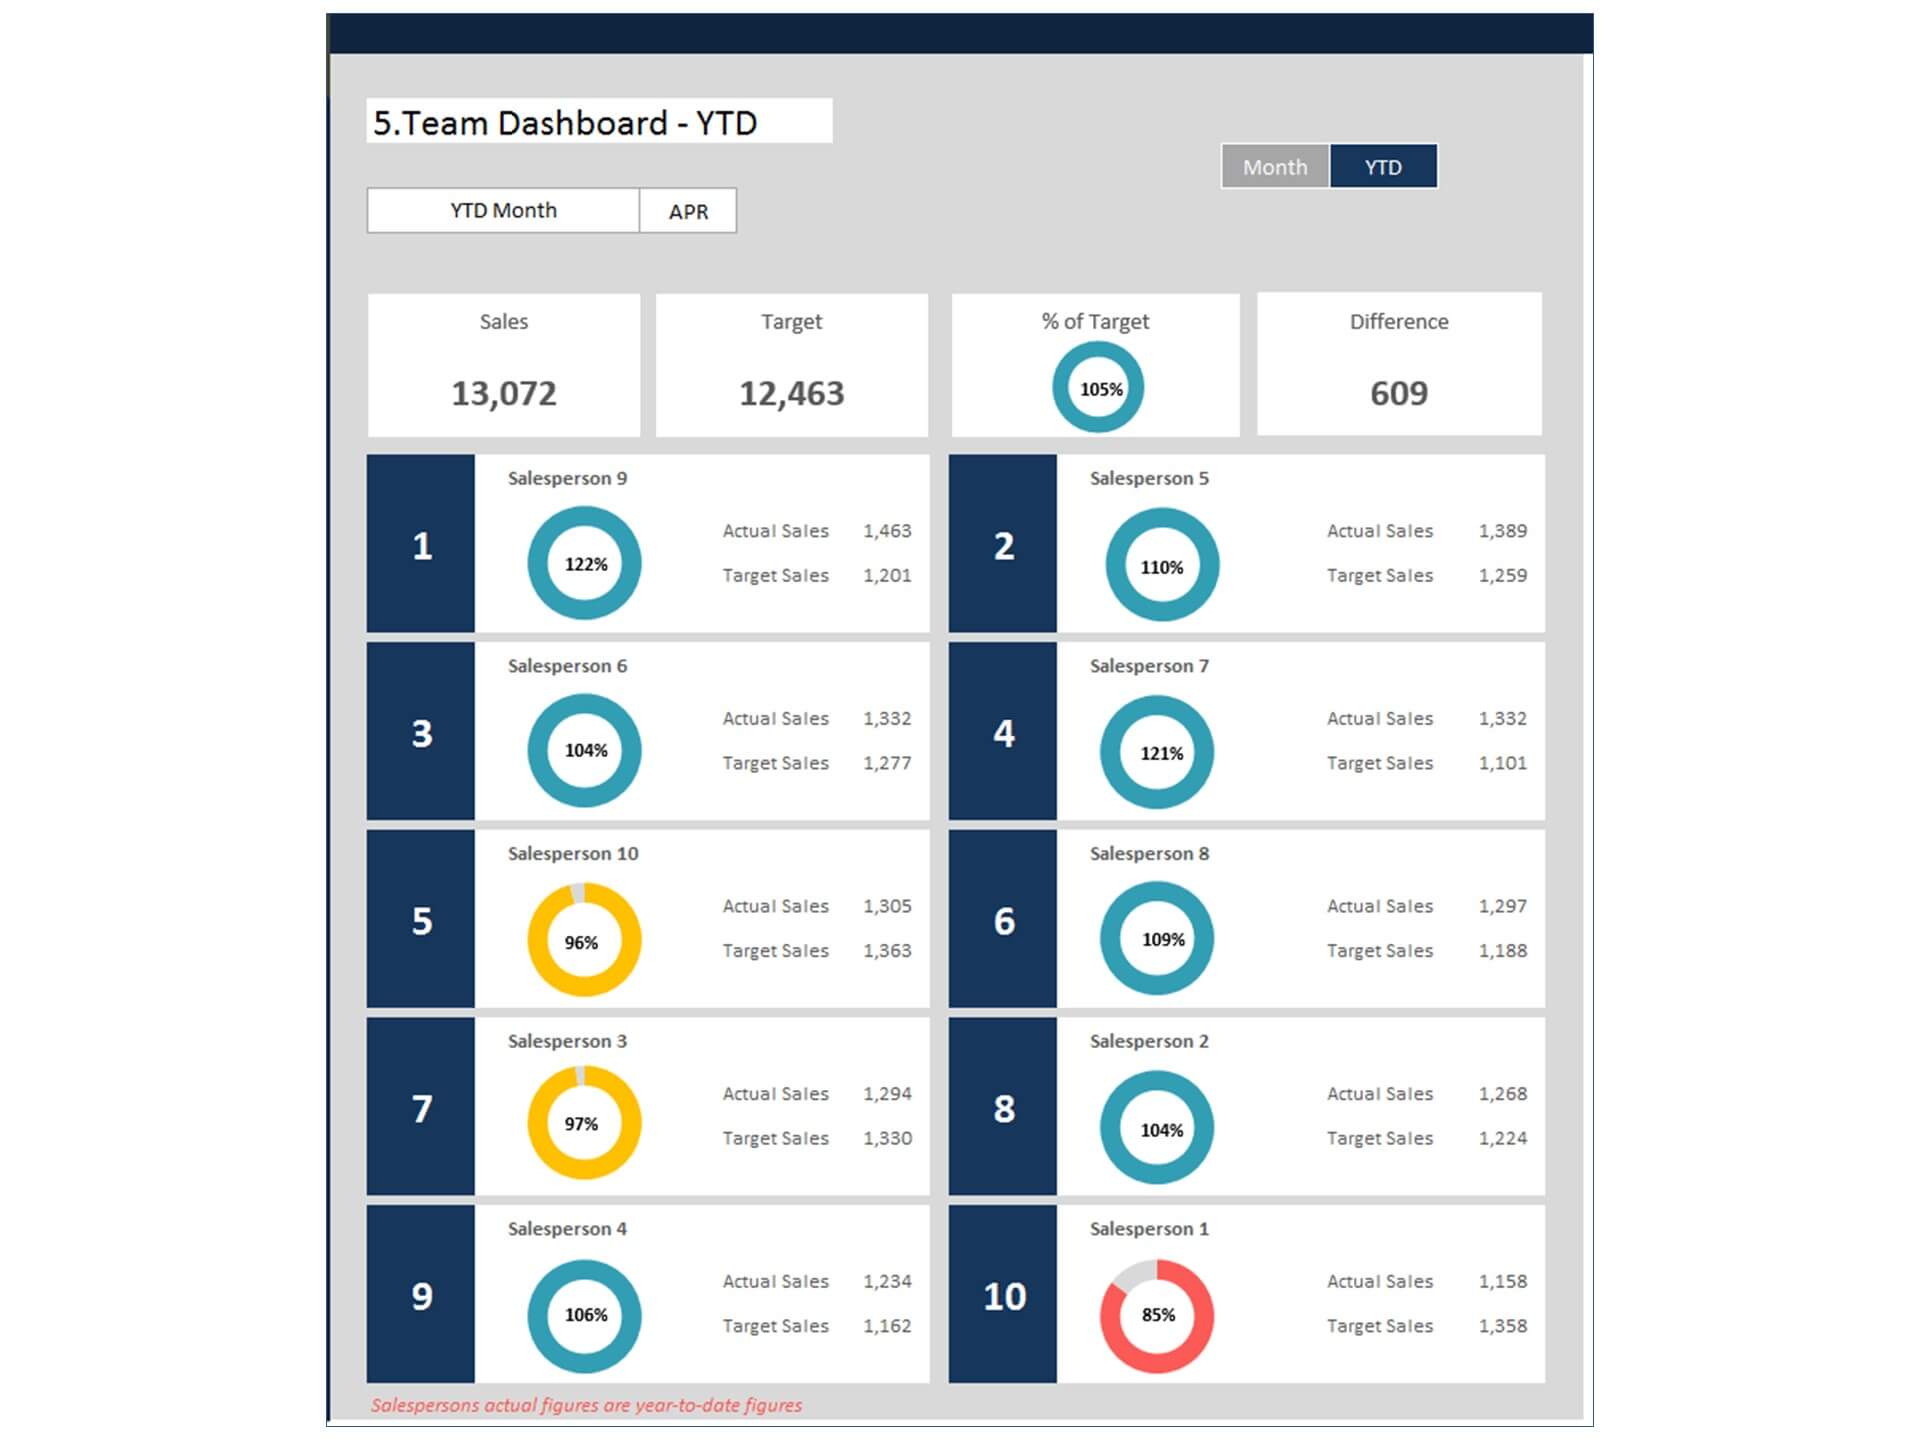
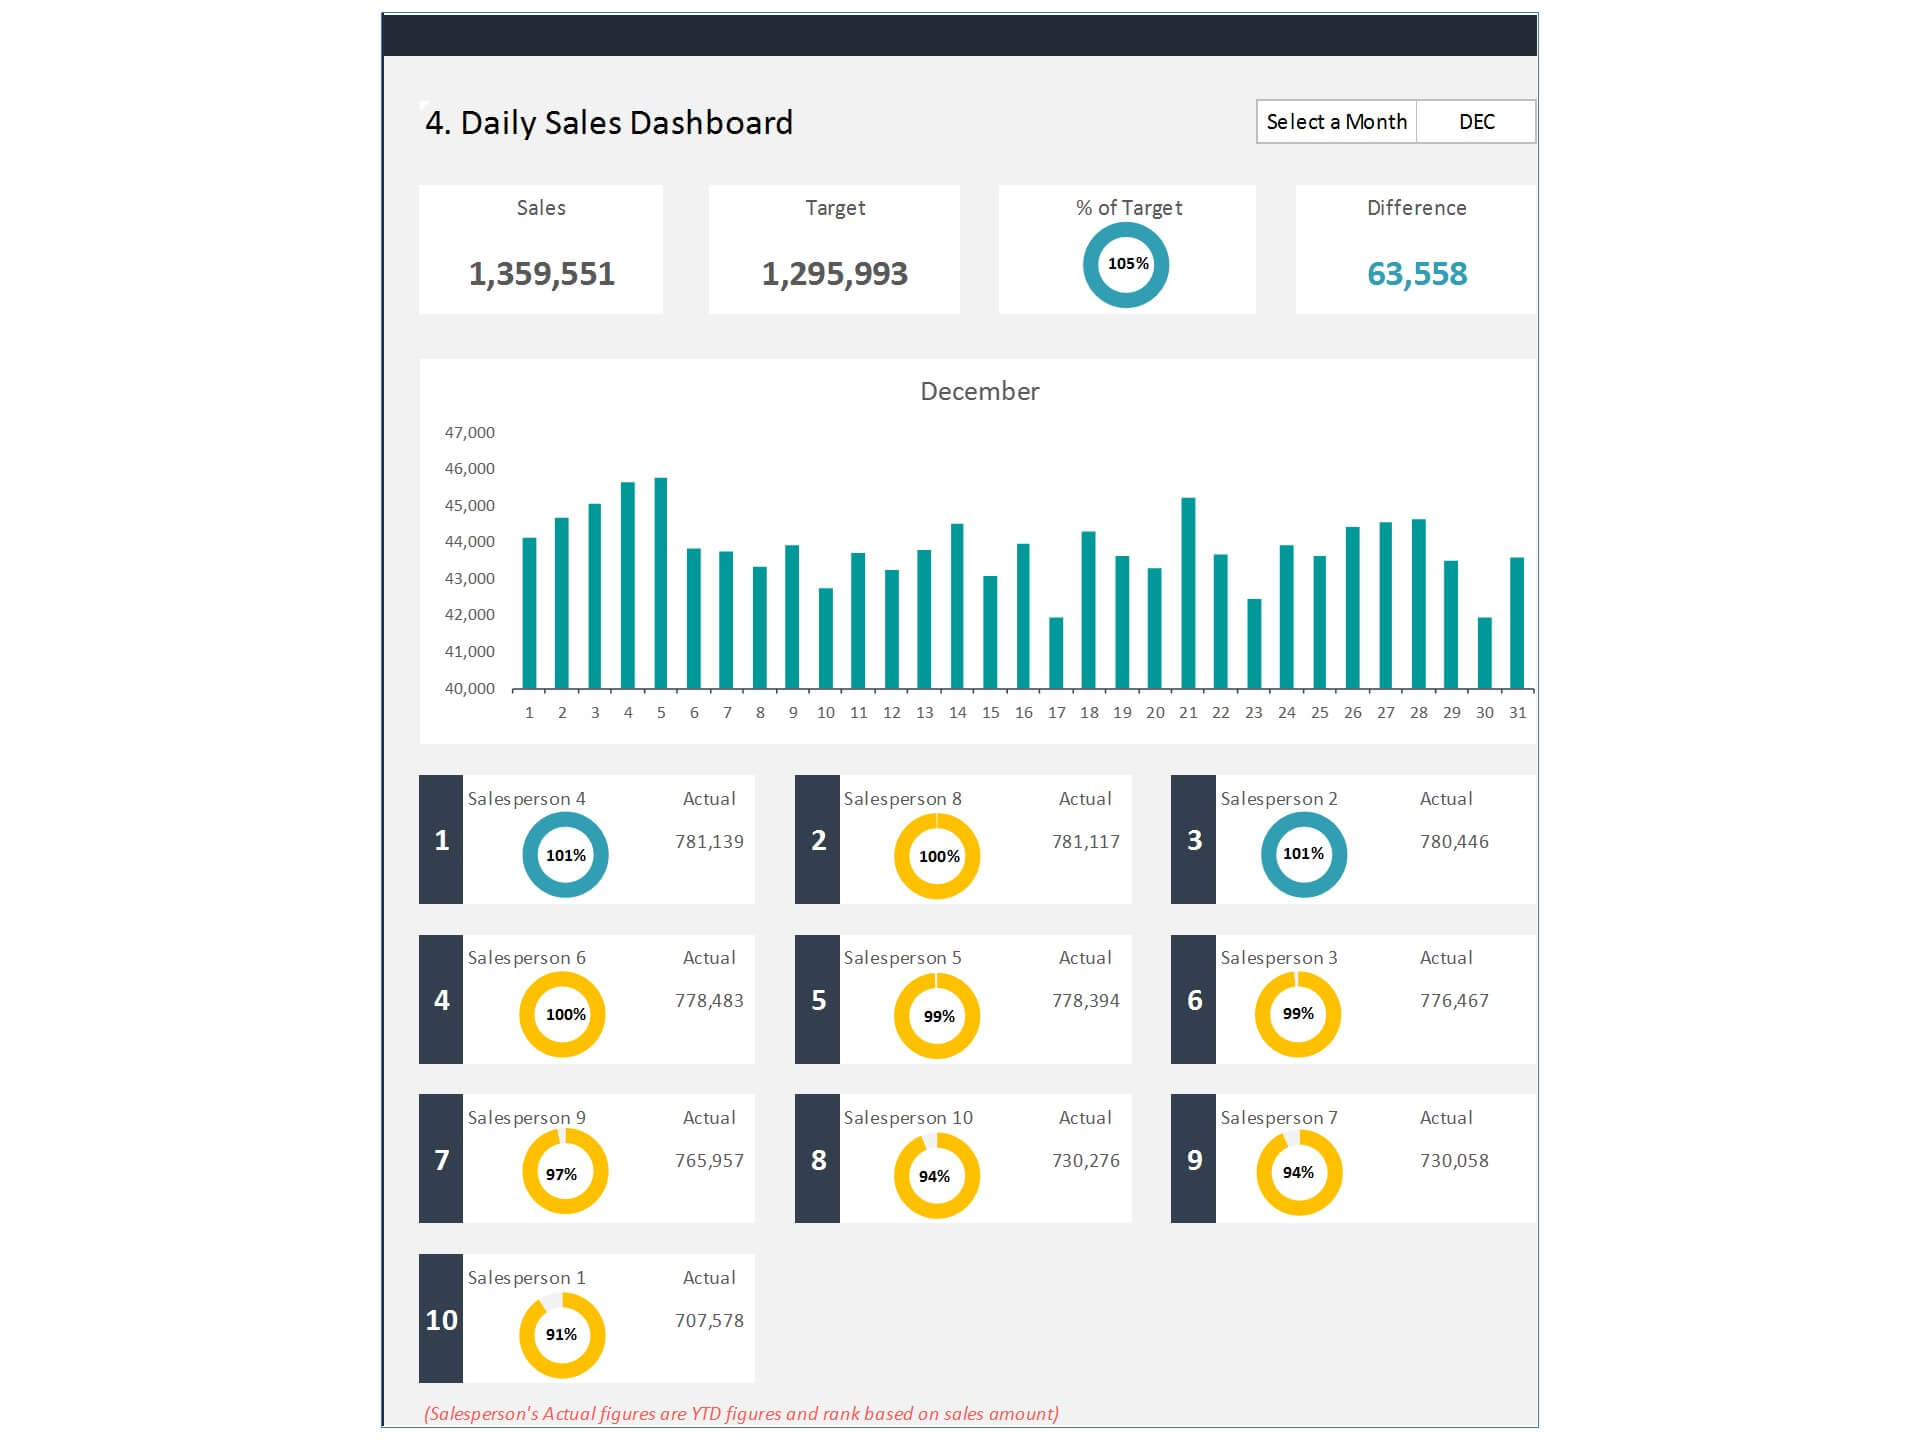
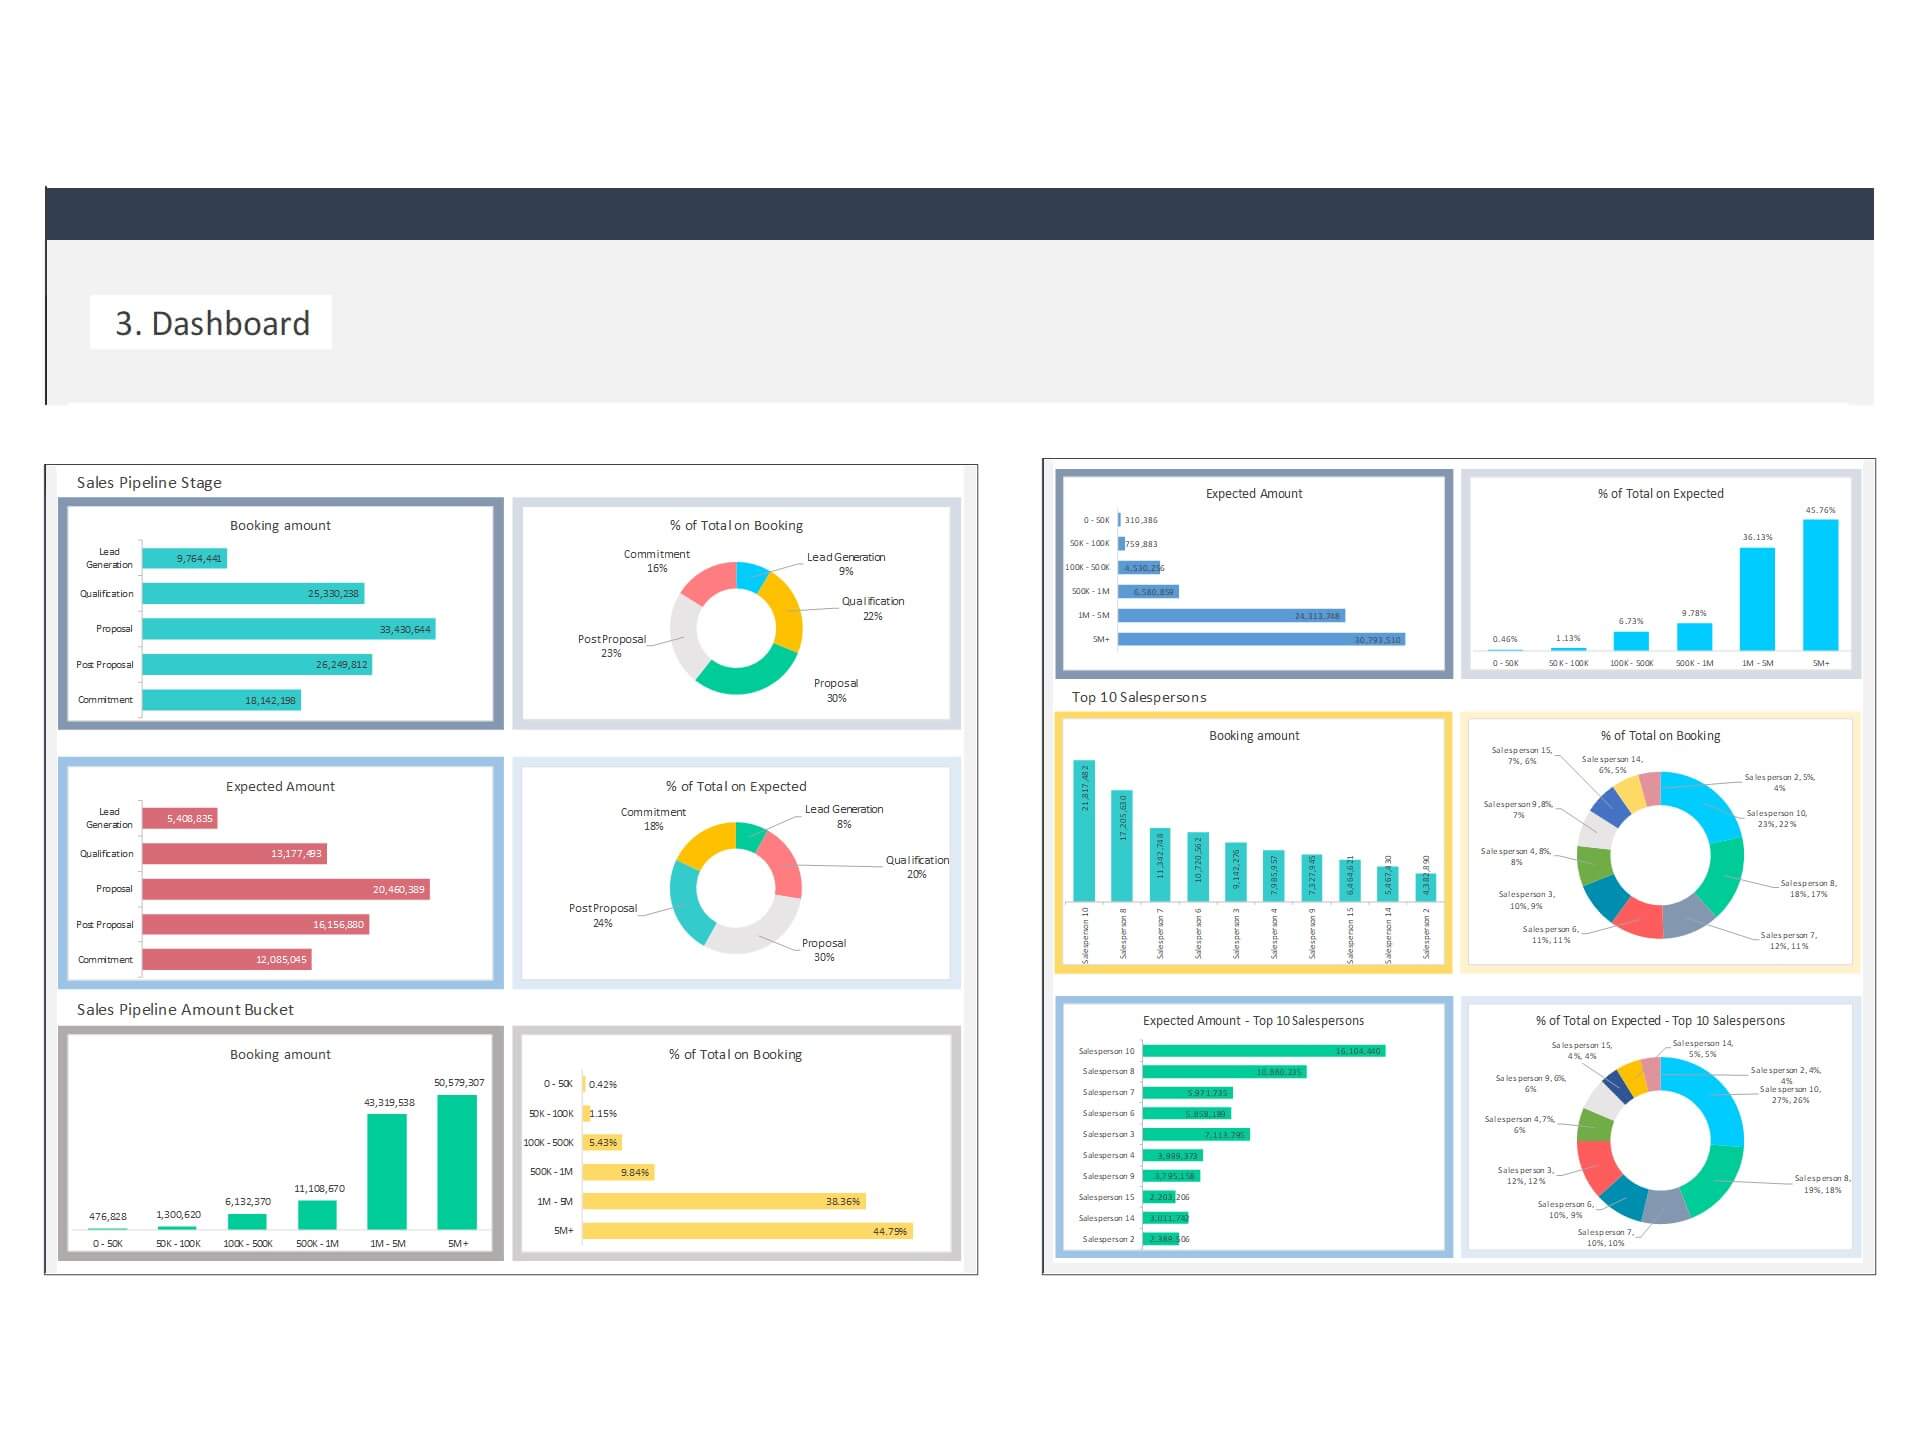
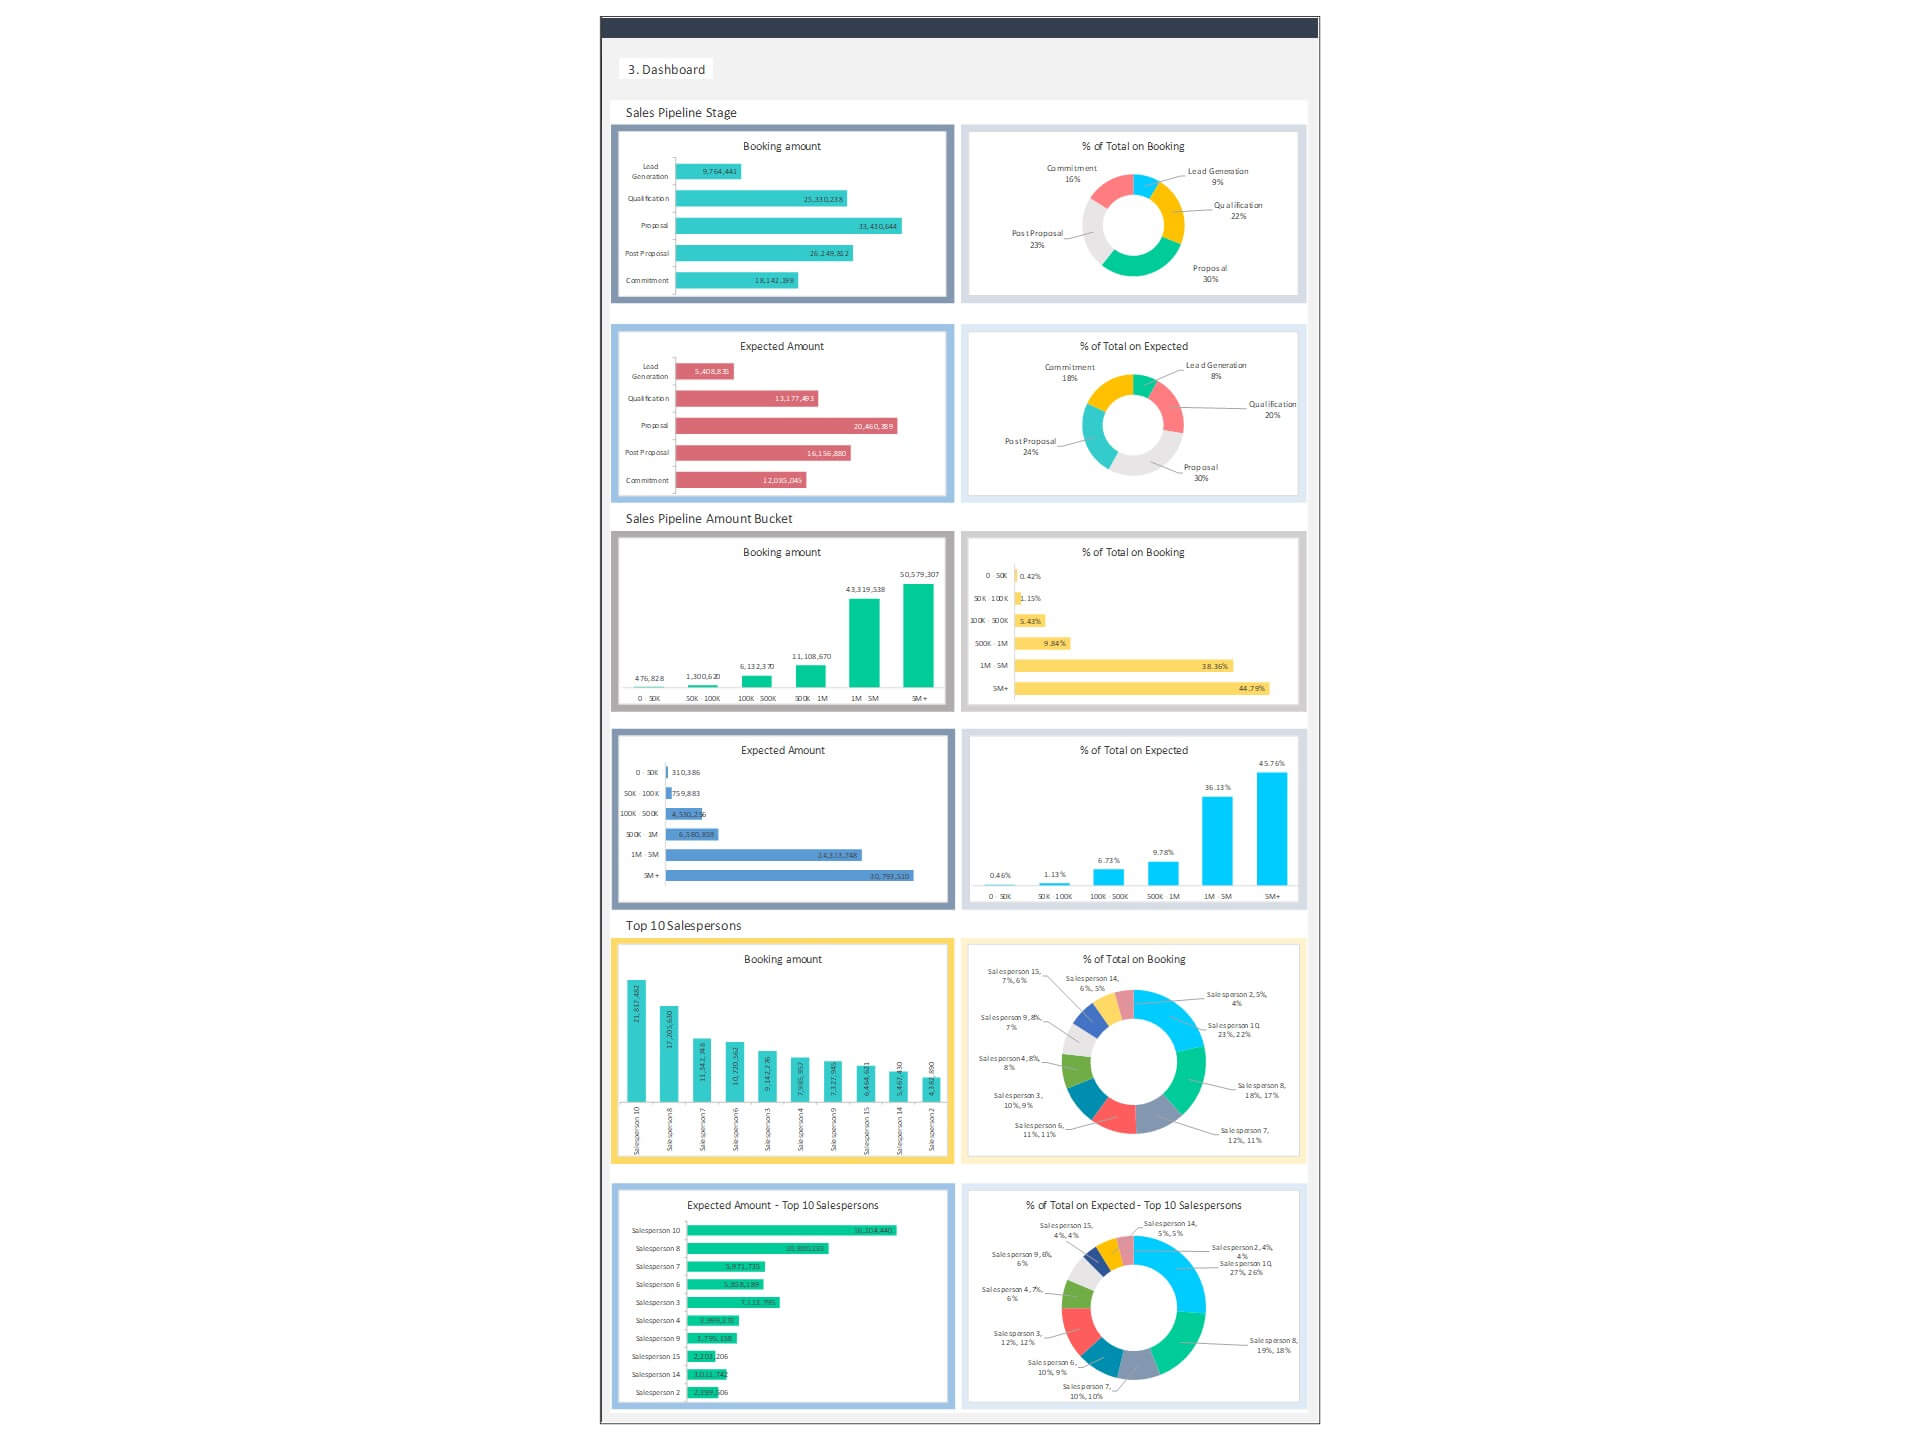
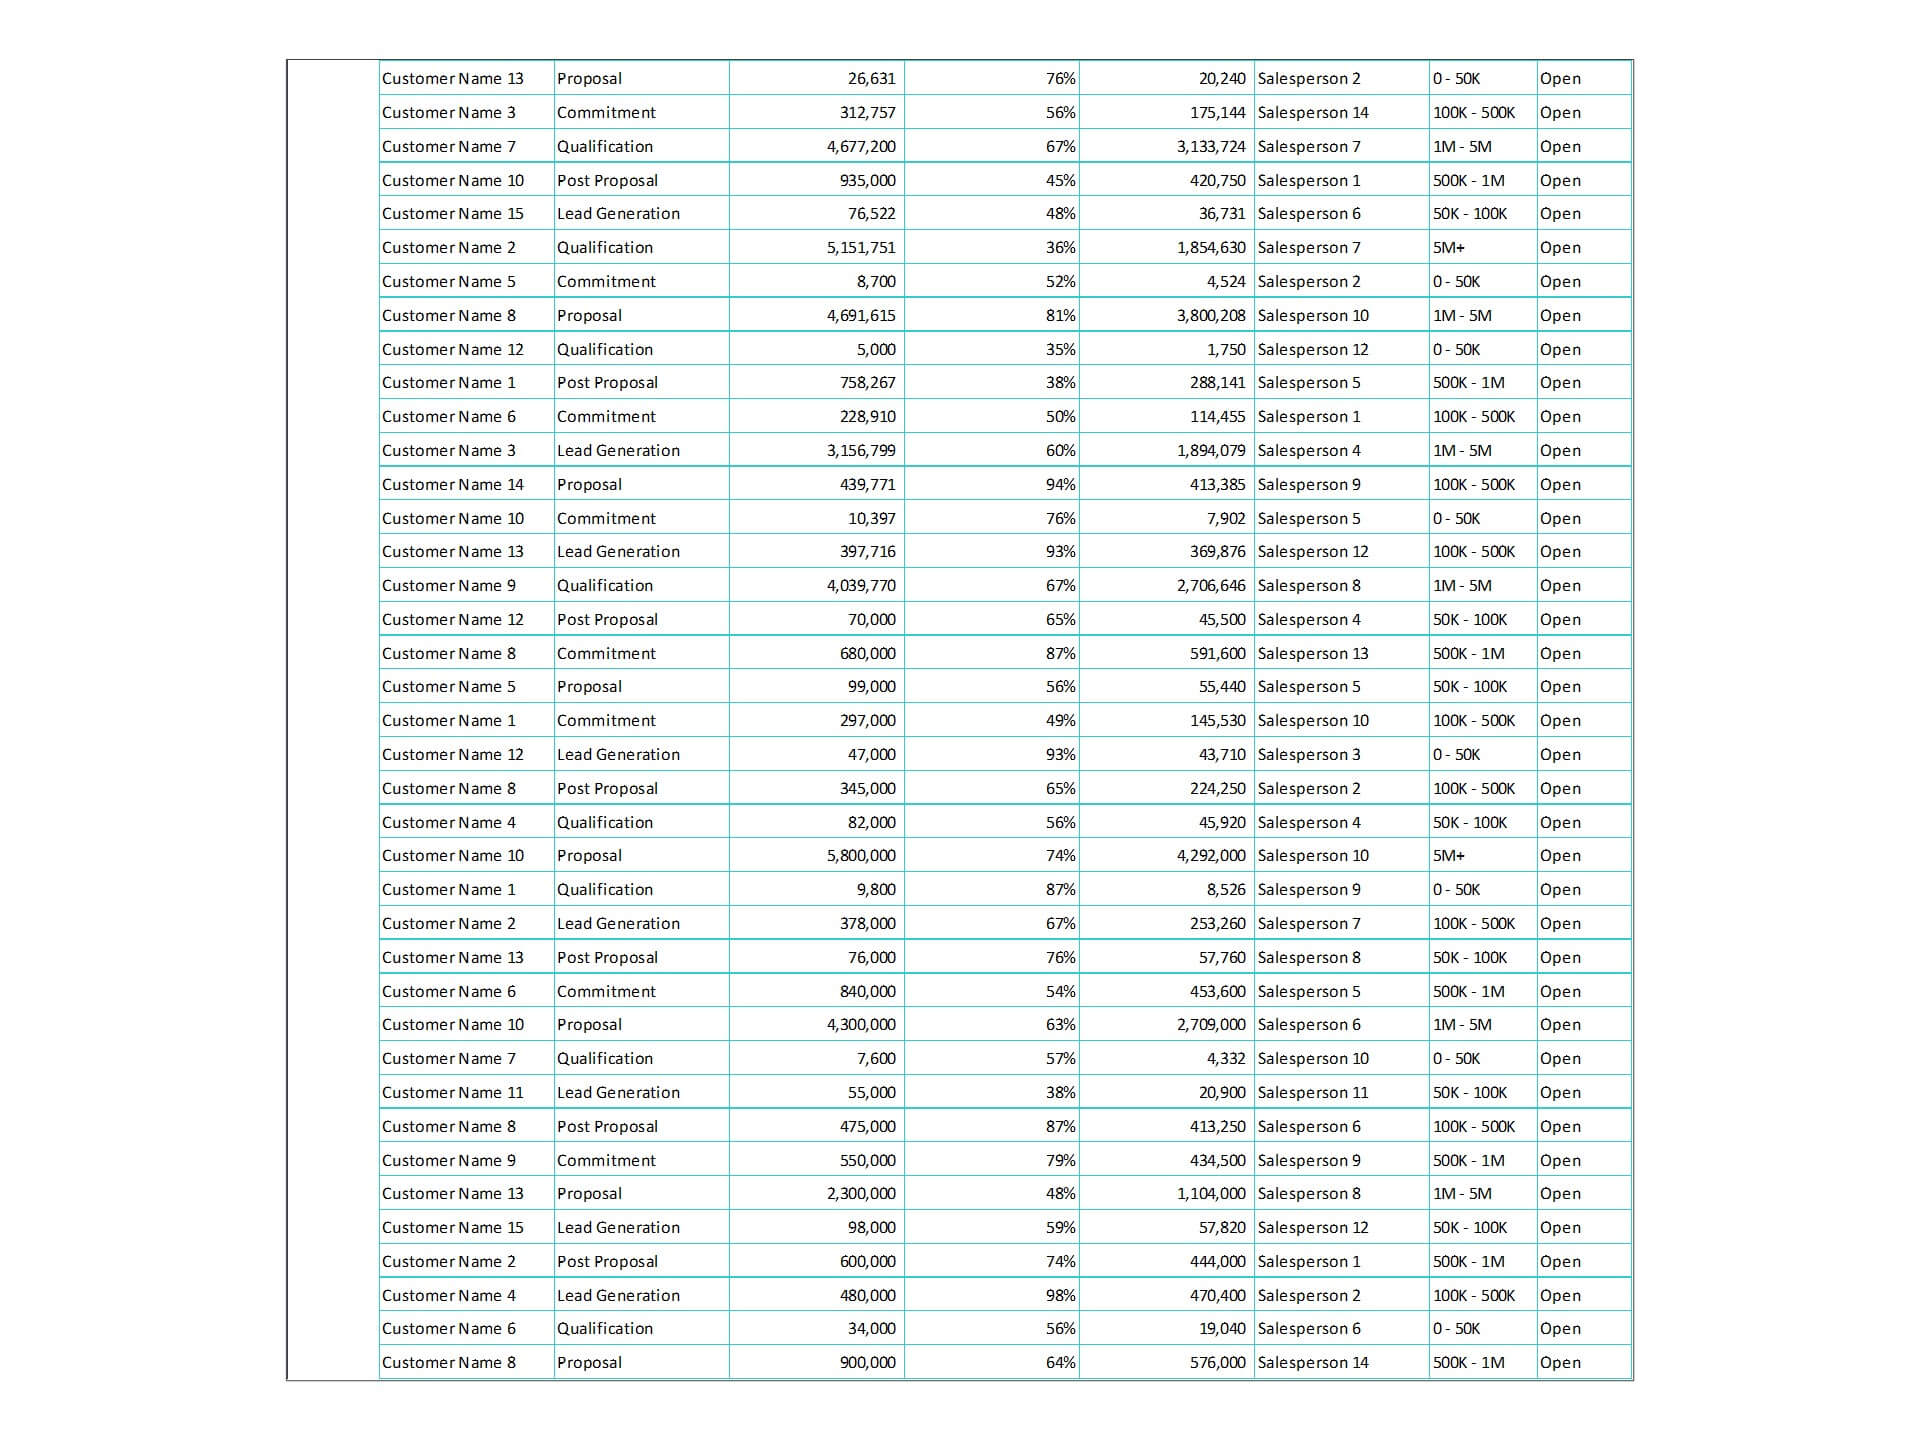
- Provides key sales insights for the CEO and sales team with details of total sales in pipeline i.e. Lead Generation, Qualification, Proposal, Post Proposal and Commitment.
- Visualize overall sales performance
- Fully editable, easy to use, template with sample data
- Eye-catching design and customizable
- Change the sample data with your data
- Spreadsheets ready for printing without Biz Infograph logo
- Consolidate key financial performance indicators in one dashboard
- No monthly fees
- Immediate download
- No VBA, no Macro
- No installation necessary
- Professionally designed
What is included in this dashboard template?
- Just plug your data, the dashboard will be ready instantly and start using.
- A text file which contains a password to view and edit the formula
- A guide to unlocking all the elements in the dashboard
Professional Support:
- Video tutorial guide on how to navigate and use Sales Pipeline Dashboard Sales Dashboard Template
- Professional service to customize dashboard template in excel as per business need
- Help and support in post-purchase
- Payment secured by Stripe and PayPal (no PayPal account needed)
A brief guide to using the dashboard template:
- Open the dashboard template
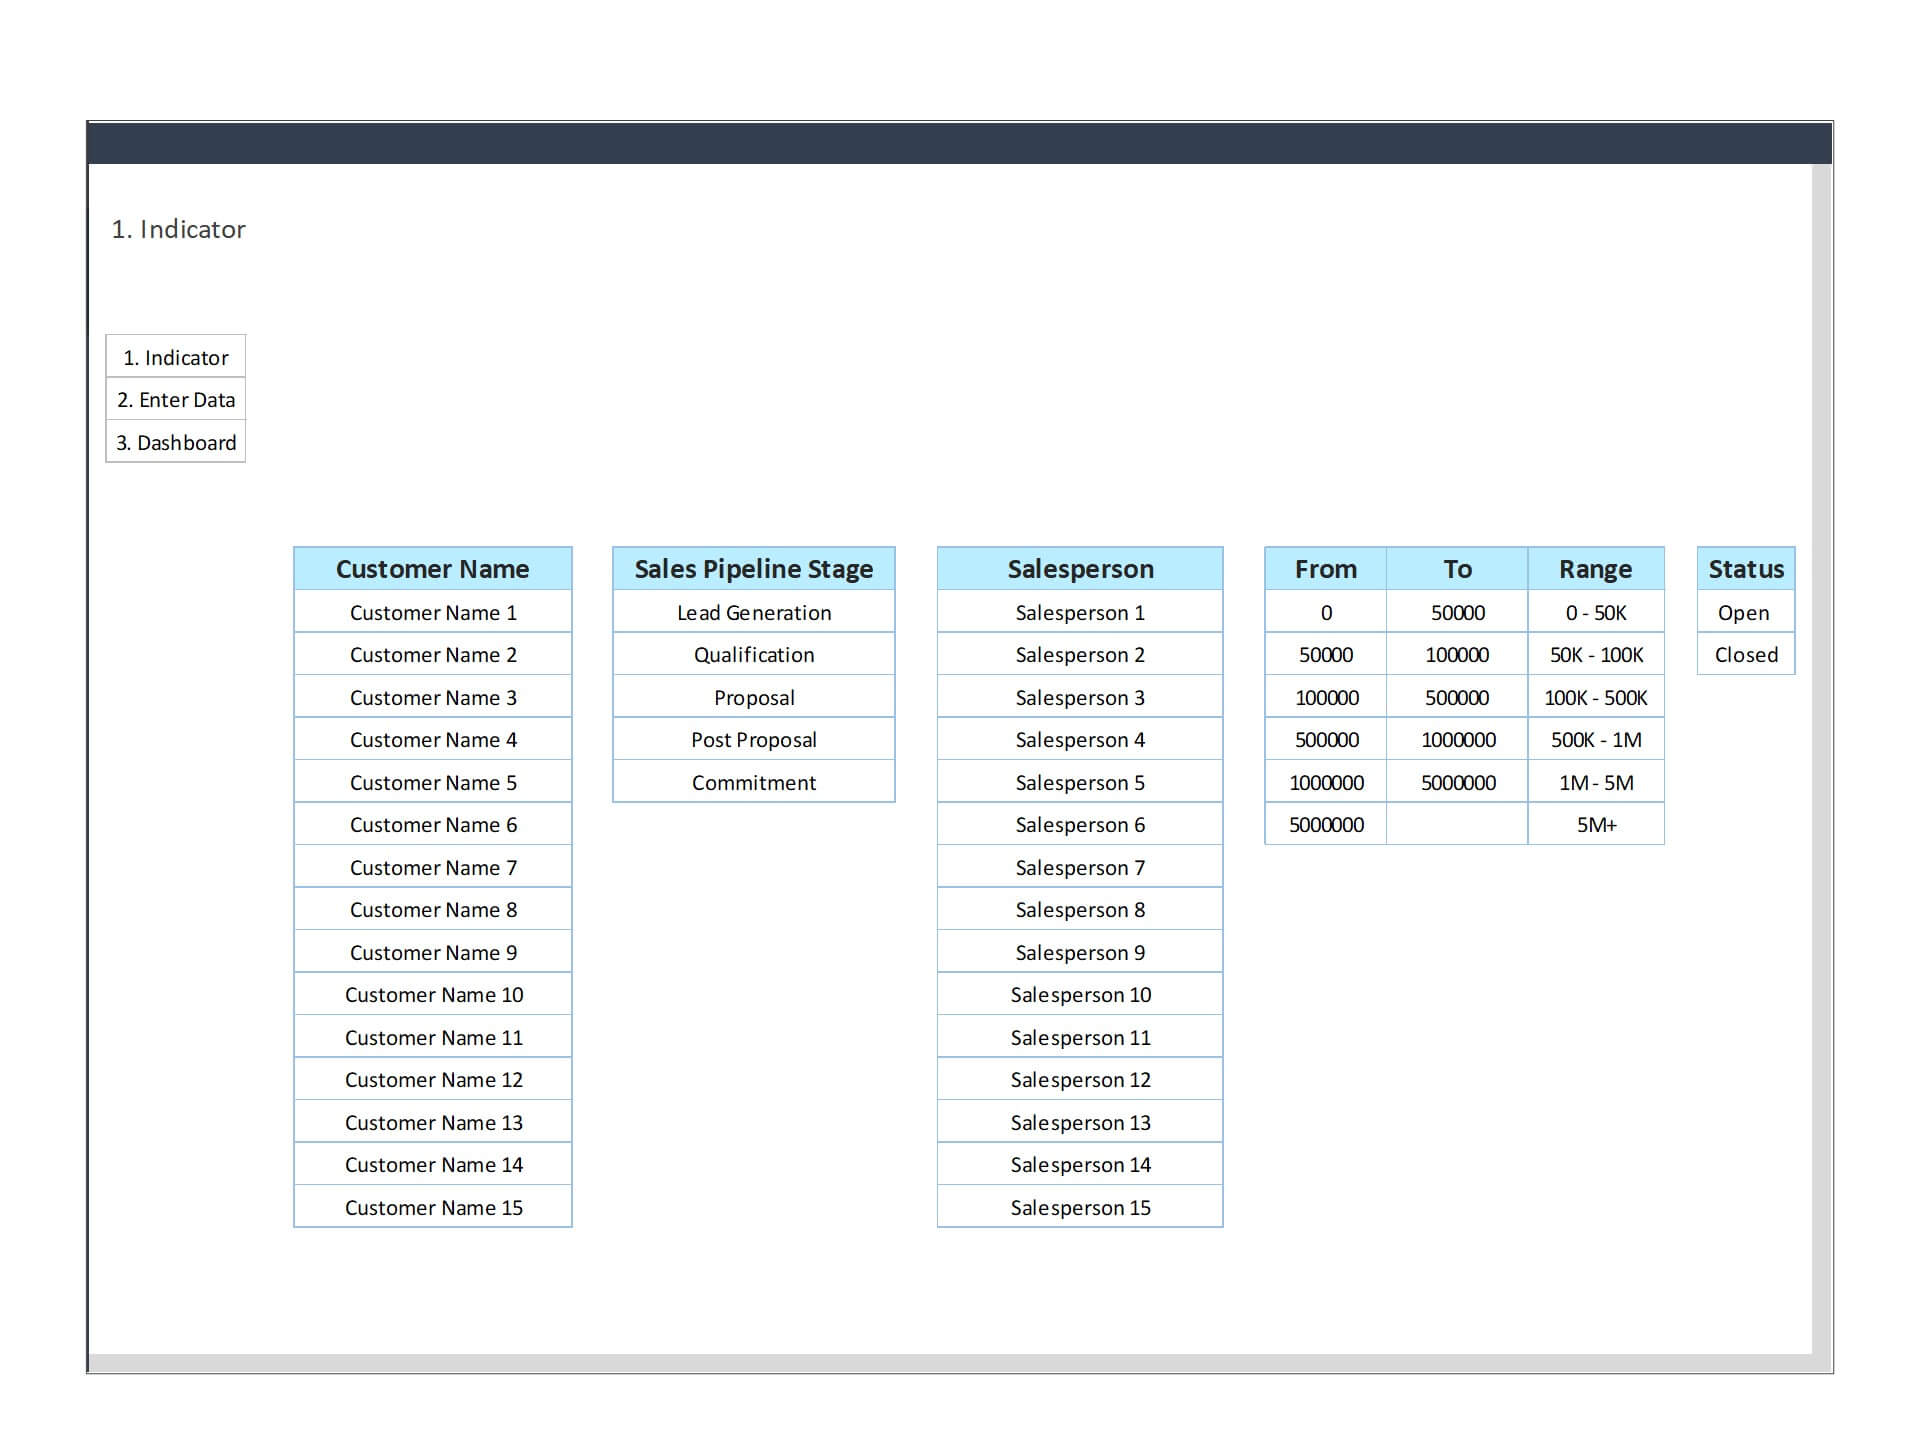
- Go to ‘Indicators’ menu – choose the start month of the fiscal year (i.e. Jan, Feb, Jul, etc.)
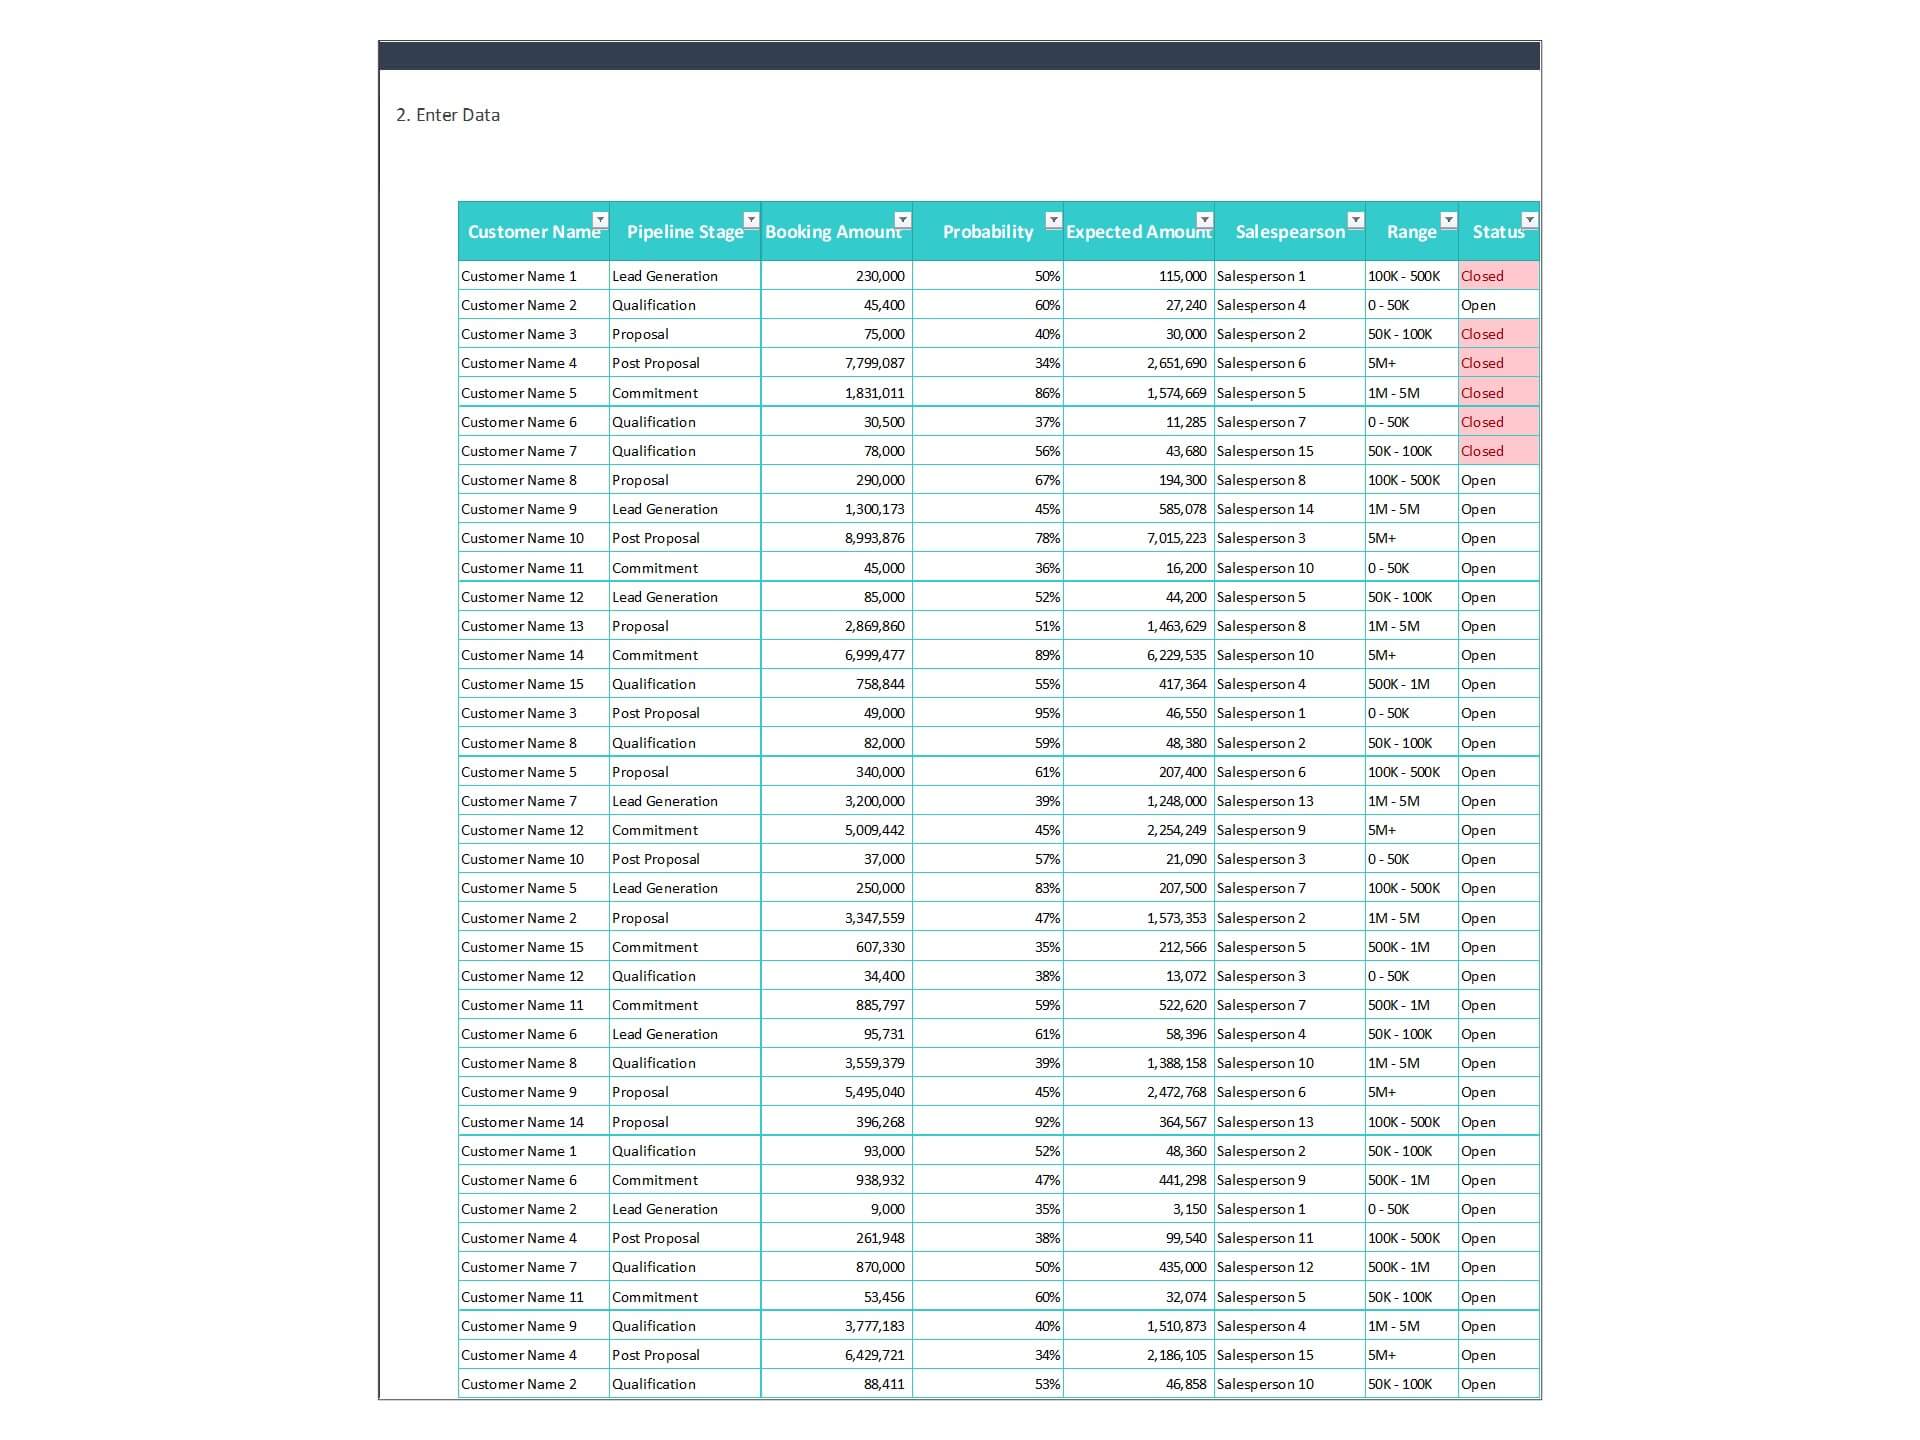
- Go to the ‘Enter Data’ menu – remove the sample data and give your actual data in the respective cells. Formula cells are locked, and you cannot edit it without a password.
- Go to the ‘Dashboard’ menu – see the visualization of sales pipeline stages
- Each page is ready for printing – just press CTRL+P
This Excel dashboard template is password-protected to avoid mistakes, such as accidentally deleting formulas. When you complete the purchase, the password will be available.
For ready-to-use Dashboard Templates: