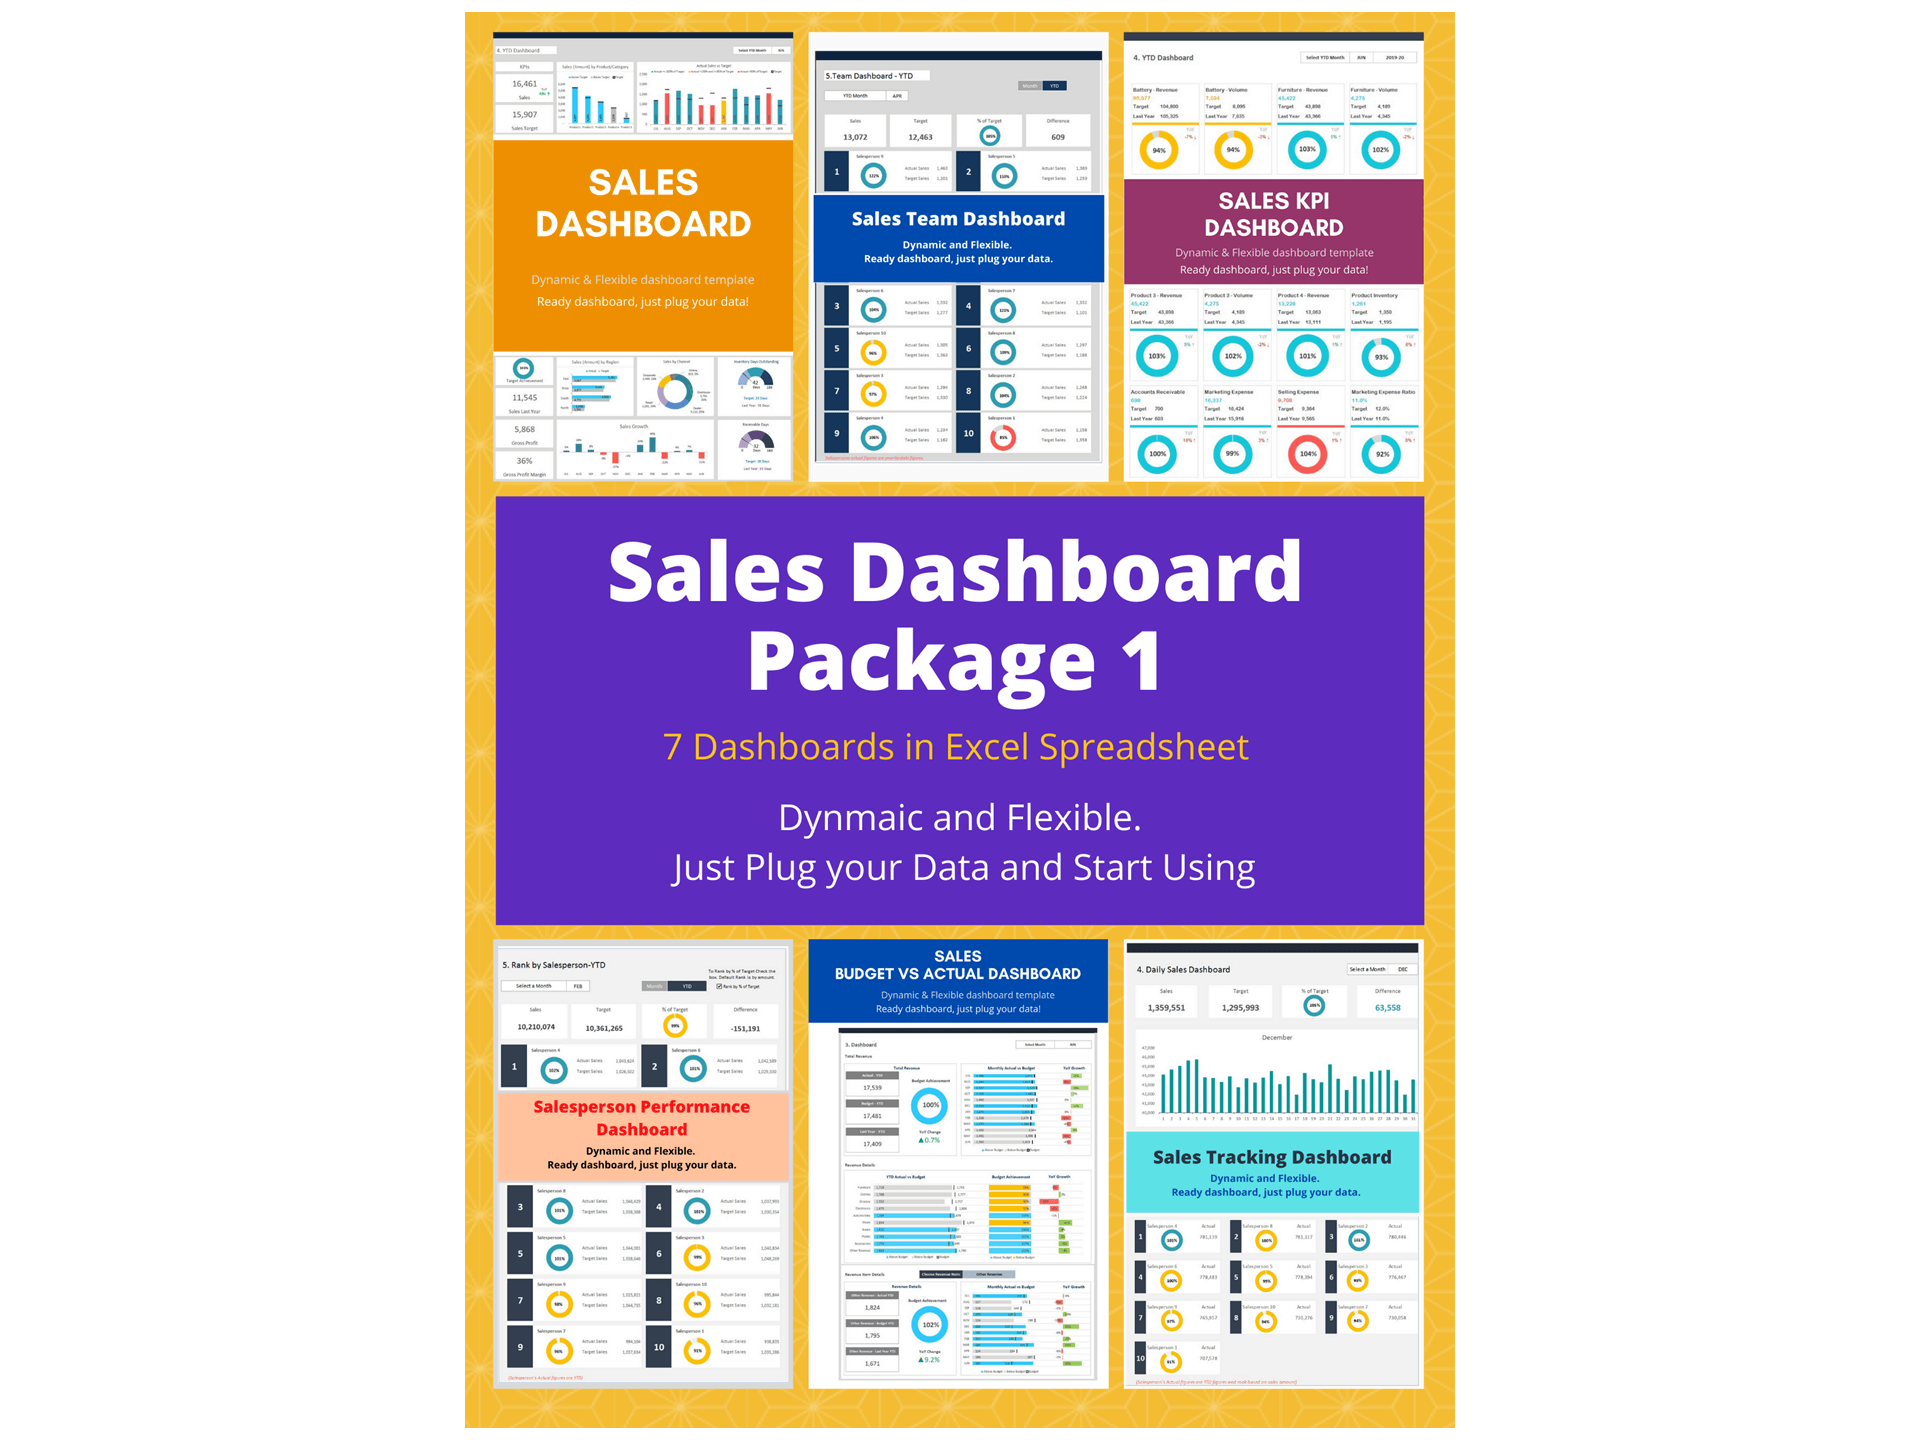
Sales Dashboard Excel Template and Google Sheets
The Sales Dashboard Excel Template is a powerful Dashboard in Excel designed to help businesses track and analyze their sales performance efficiently. This Sales Dashboard provides a clear visual overview of important sales metrics such as total revenue, sales by product, regional performance, and monthly sales trends.
As a comprehensive Sales KPI Dashboard, the template allows managers to monitor key performance indicators including sales growth, target achievement, average deal value, and sales conversion rates. By presenting these metrics through charts and summarized tables, the dashboard helps decision-makers quickly understand sales performance and identify opportunities for improvement.
The template is built as a Dynamic Dashboard, meaning that charts and performance indicators automatically update when new sales data is entered. This feature ensures accurate and up-to-date reporting without complex manual updates.
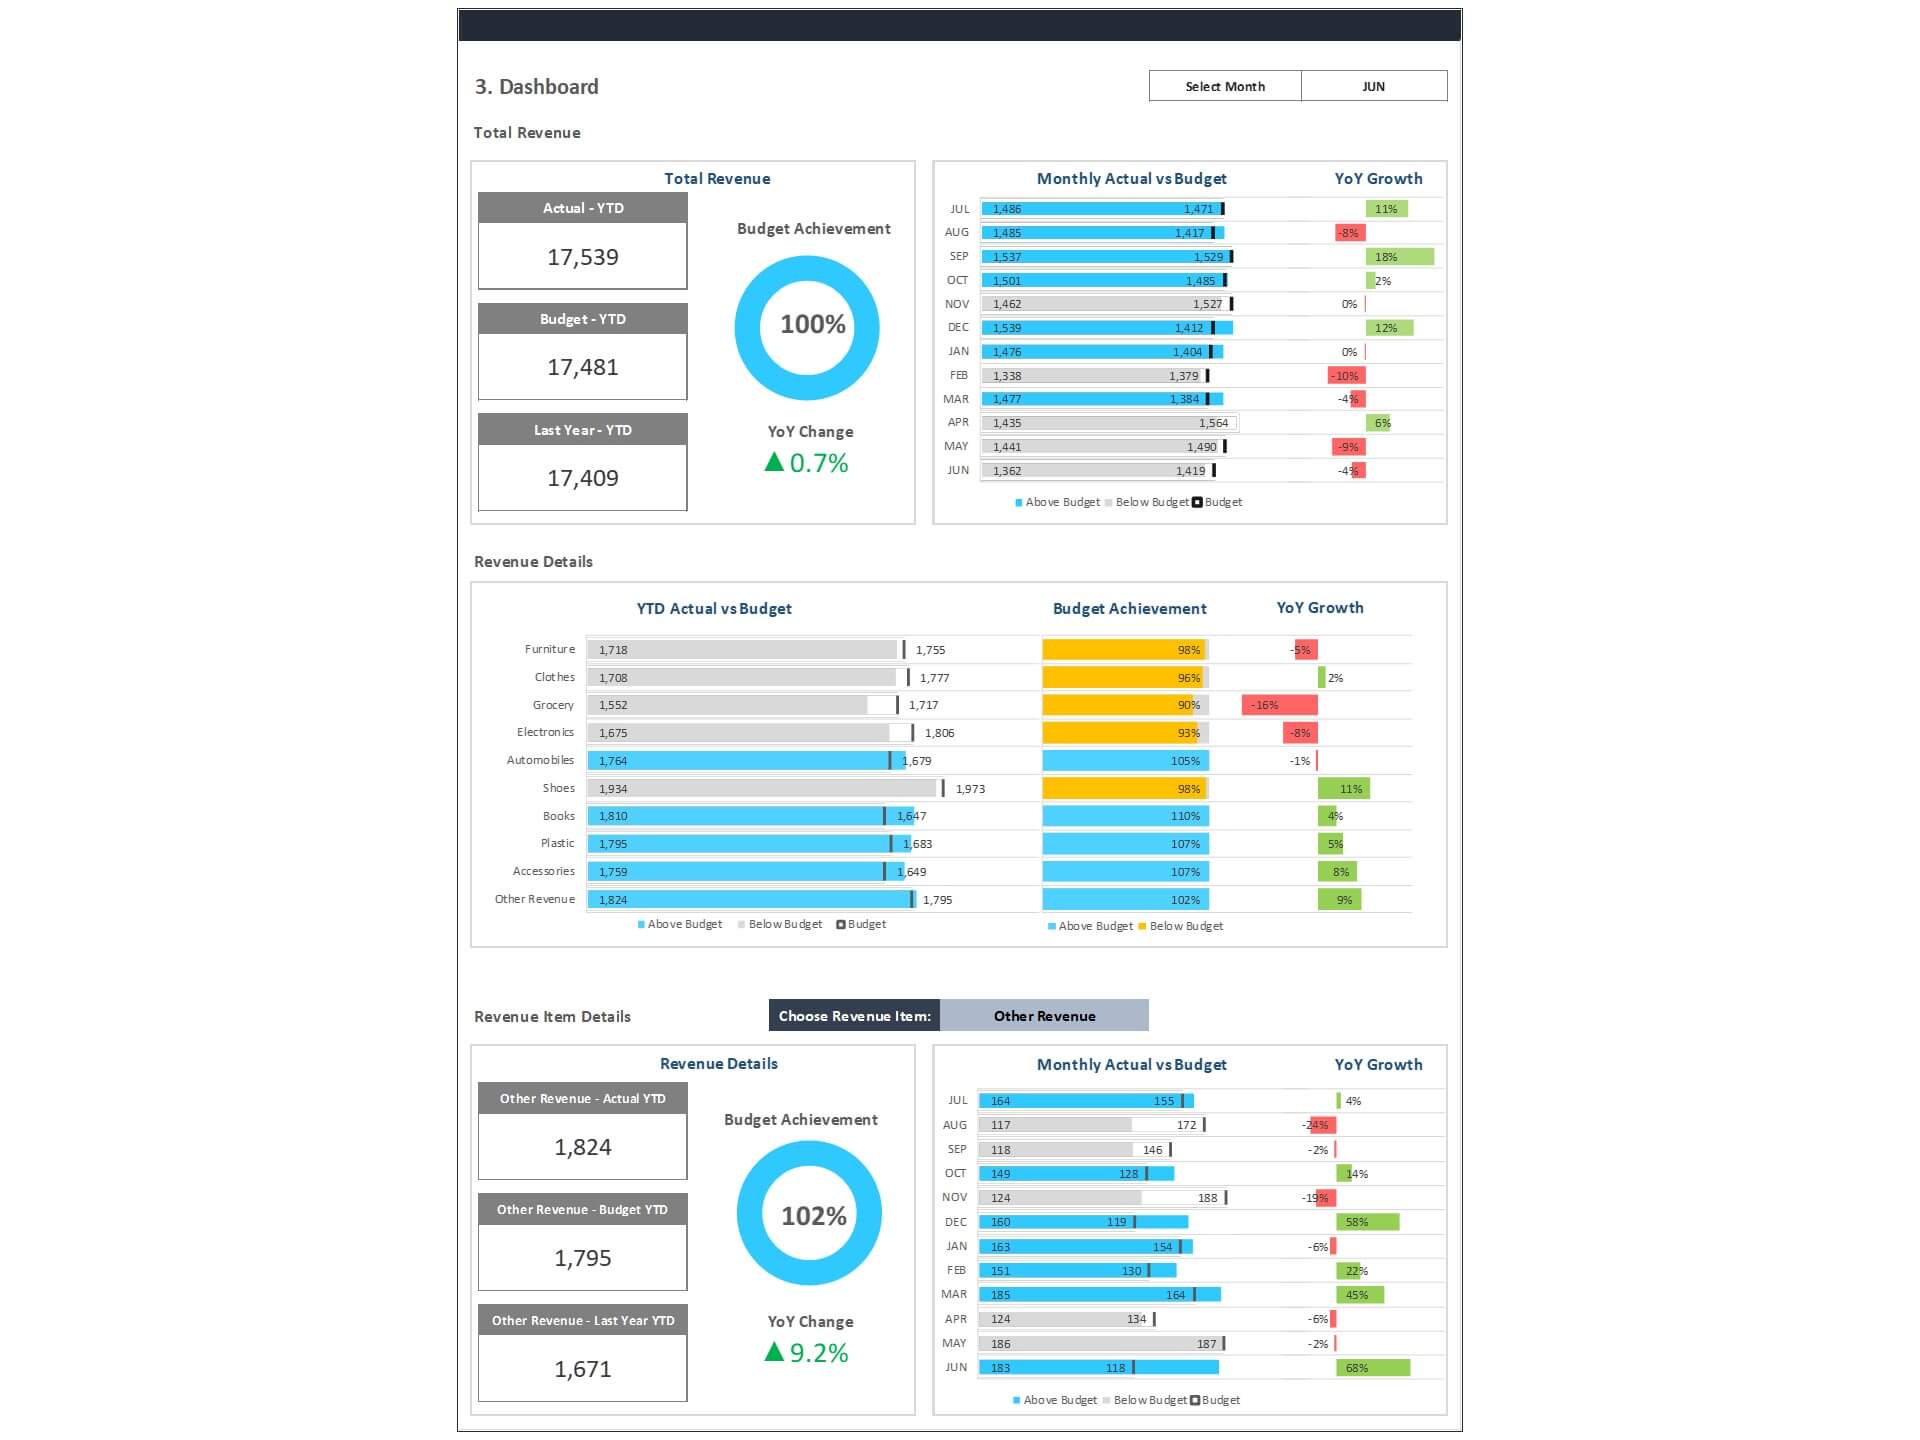
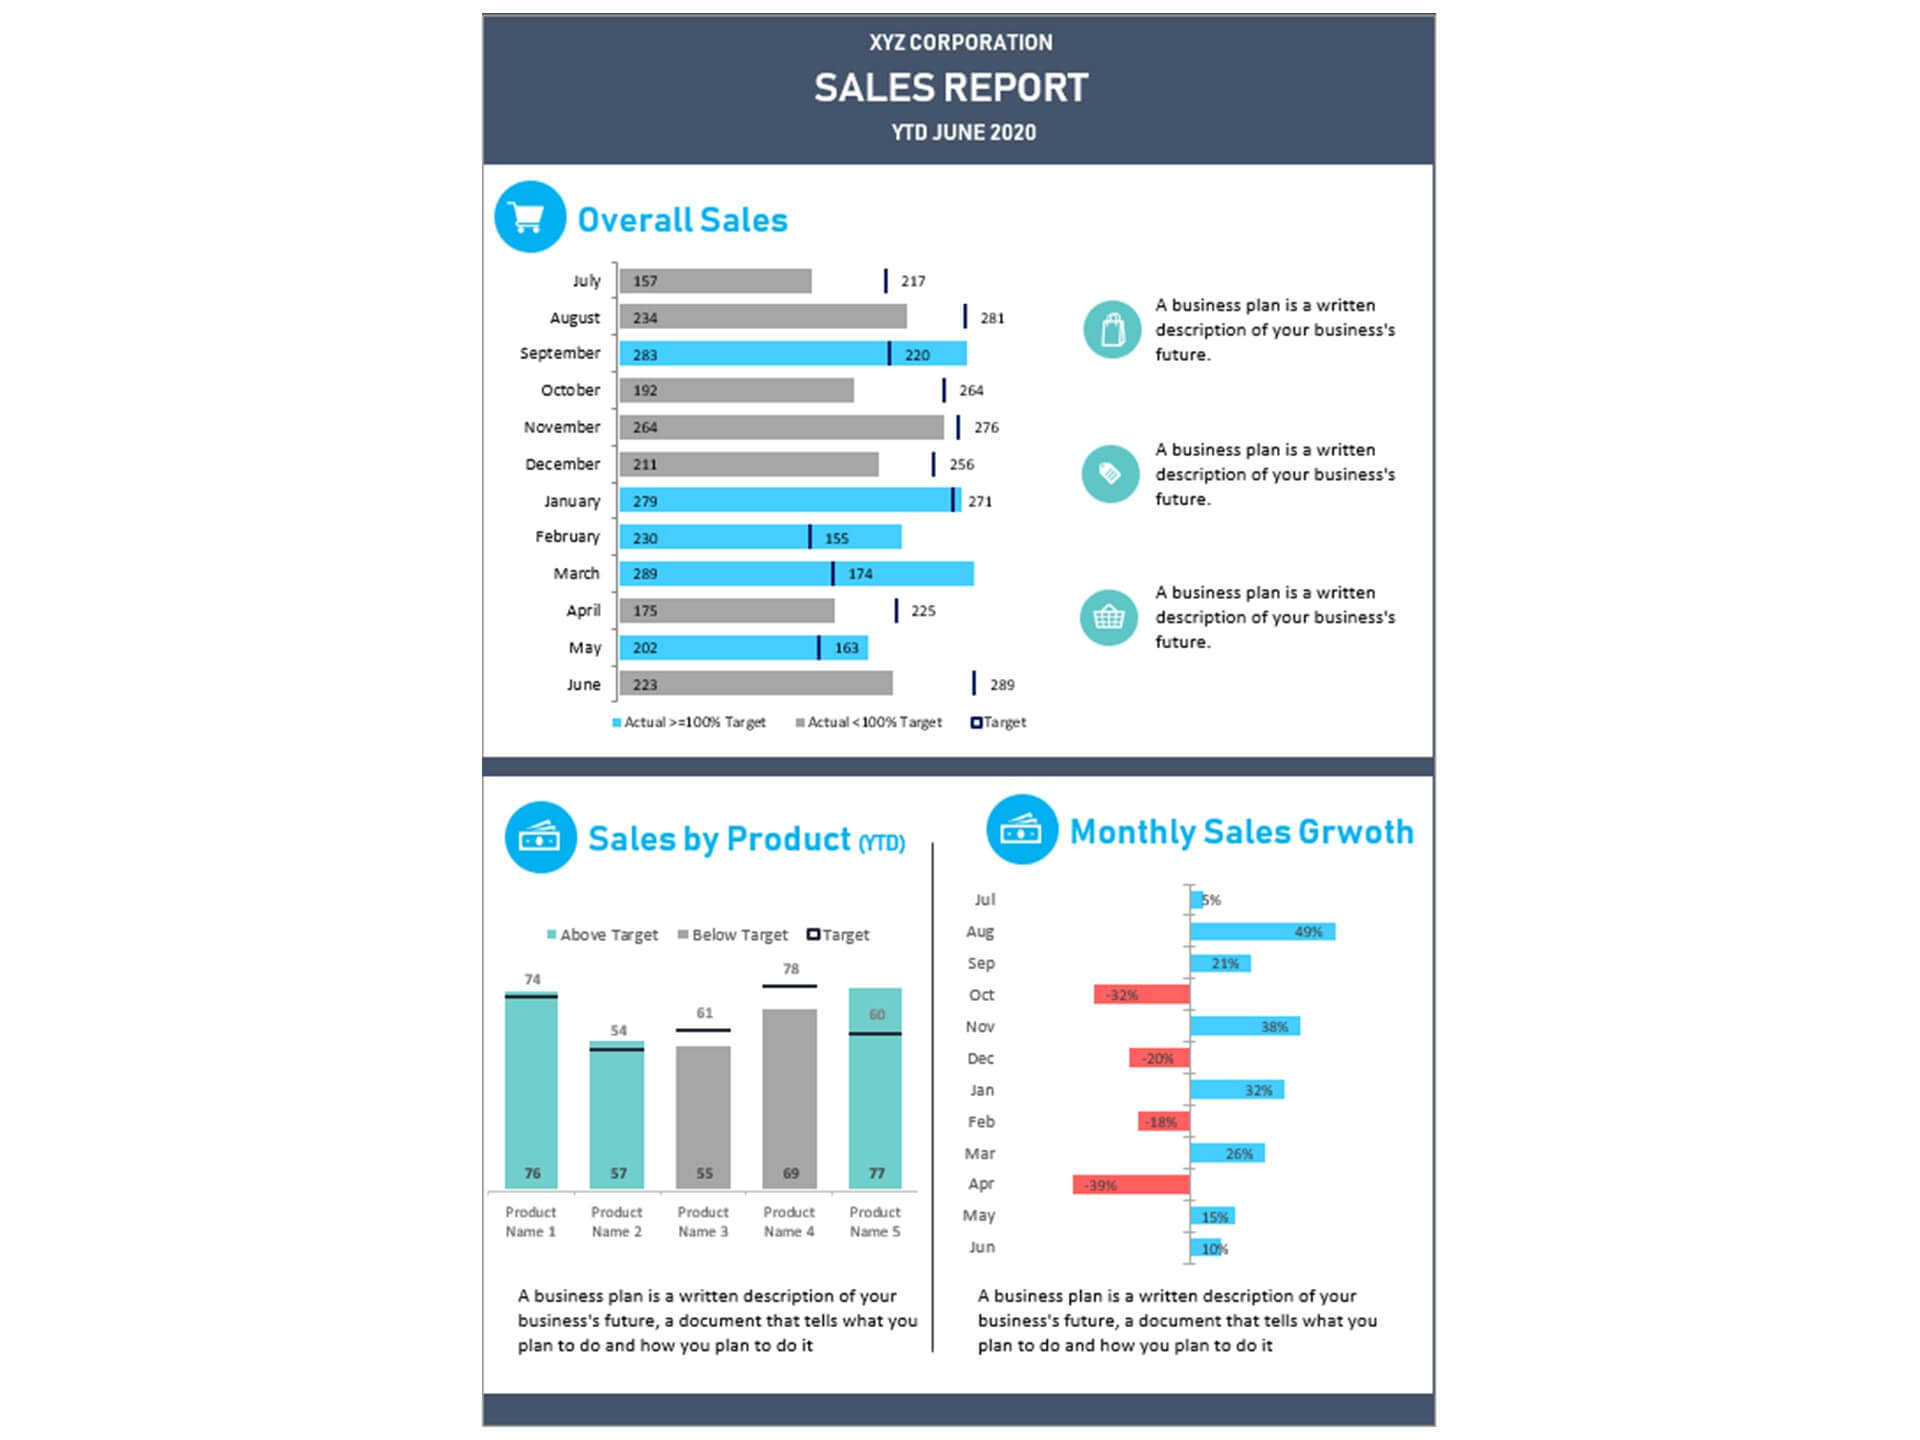
The sales dashboard template in Excel depicts a visual representation of sales results in order to boost performance, create accountability and monitor progresses. The data-driven process assists to take a judicious decision. The sales dashboard template allows you to track sales based on product/category, region, and channel.
Understanding Sales Dashboard
A sales dashboard is an interactive tool that visually displays key sales data, simplifying complex information into actionable insights. It aggregates various metrics and KPIs, presenting them in an easily digestible format, often through dynamic charts and graphs. Sales dashboards come in different types:
-
Strategic Dashboards: Provide high-level insights, focusing on long-term strategies and objectives. They help in understanding market trends and overall business health.
-
Operational Dashboards: Designed for day-to-day use, they track real-time data to monitor ongoing sales activities, allowing quick responses to immediate challenges.
-
Analytical Dashboards: These are used for deep analysis, exploring historical data to identify patterns and forecast future trends.
The role of a sales dashboard in decision-making cannot be overstated. It provides a clear and concise view of performance metrics, helping managers and teams make informed, data-driven decisions. By analyzing current sales figures against targets, identifying top-performing products, and pinpointing areas needing improvement, sales dashboards become indispensable tools in shaping business strategies.
Key Components of the Effective Sales Dashboard
An effective sales dashboard comprises several critical elements:
-
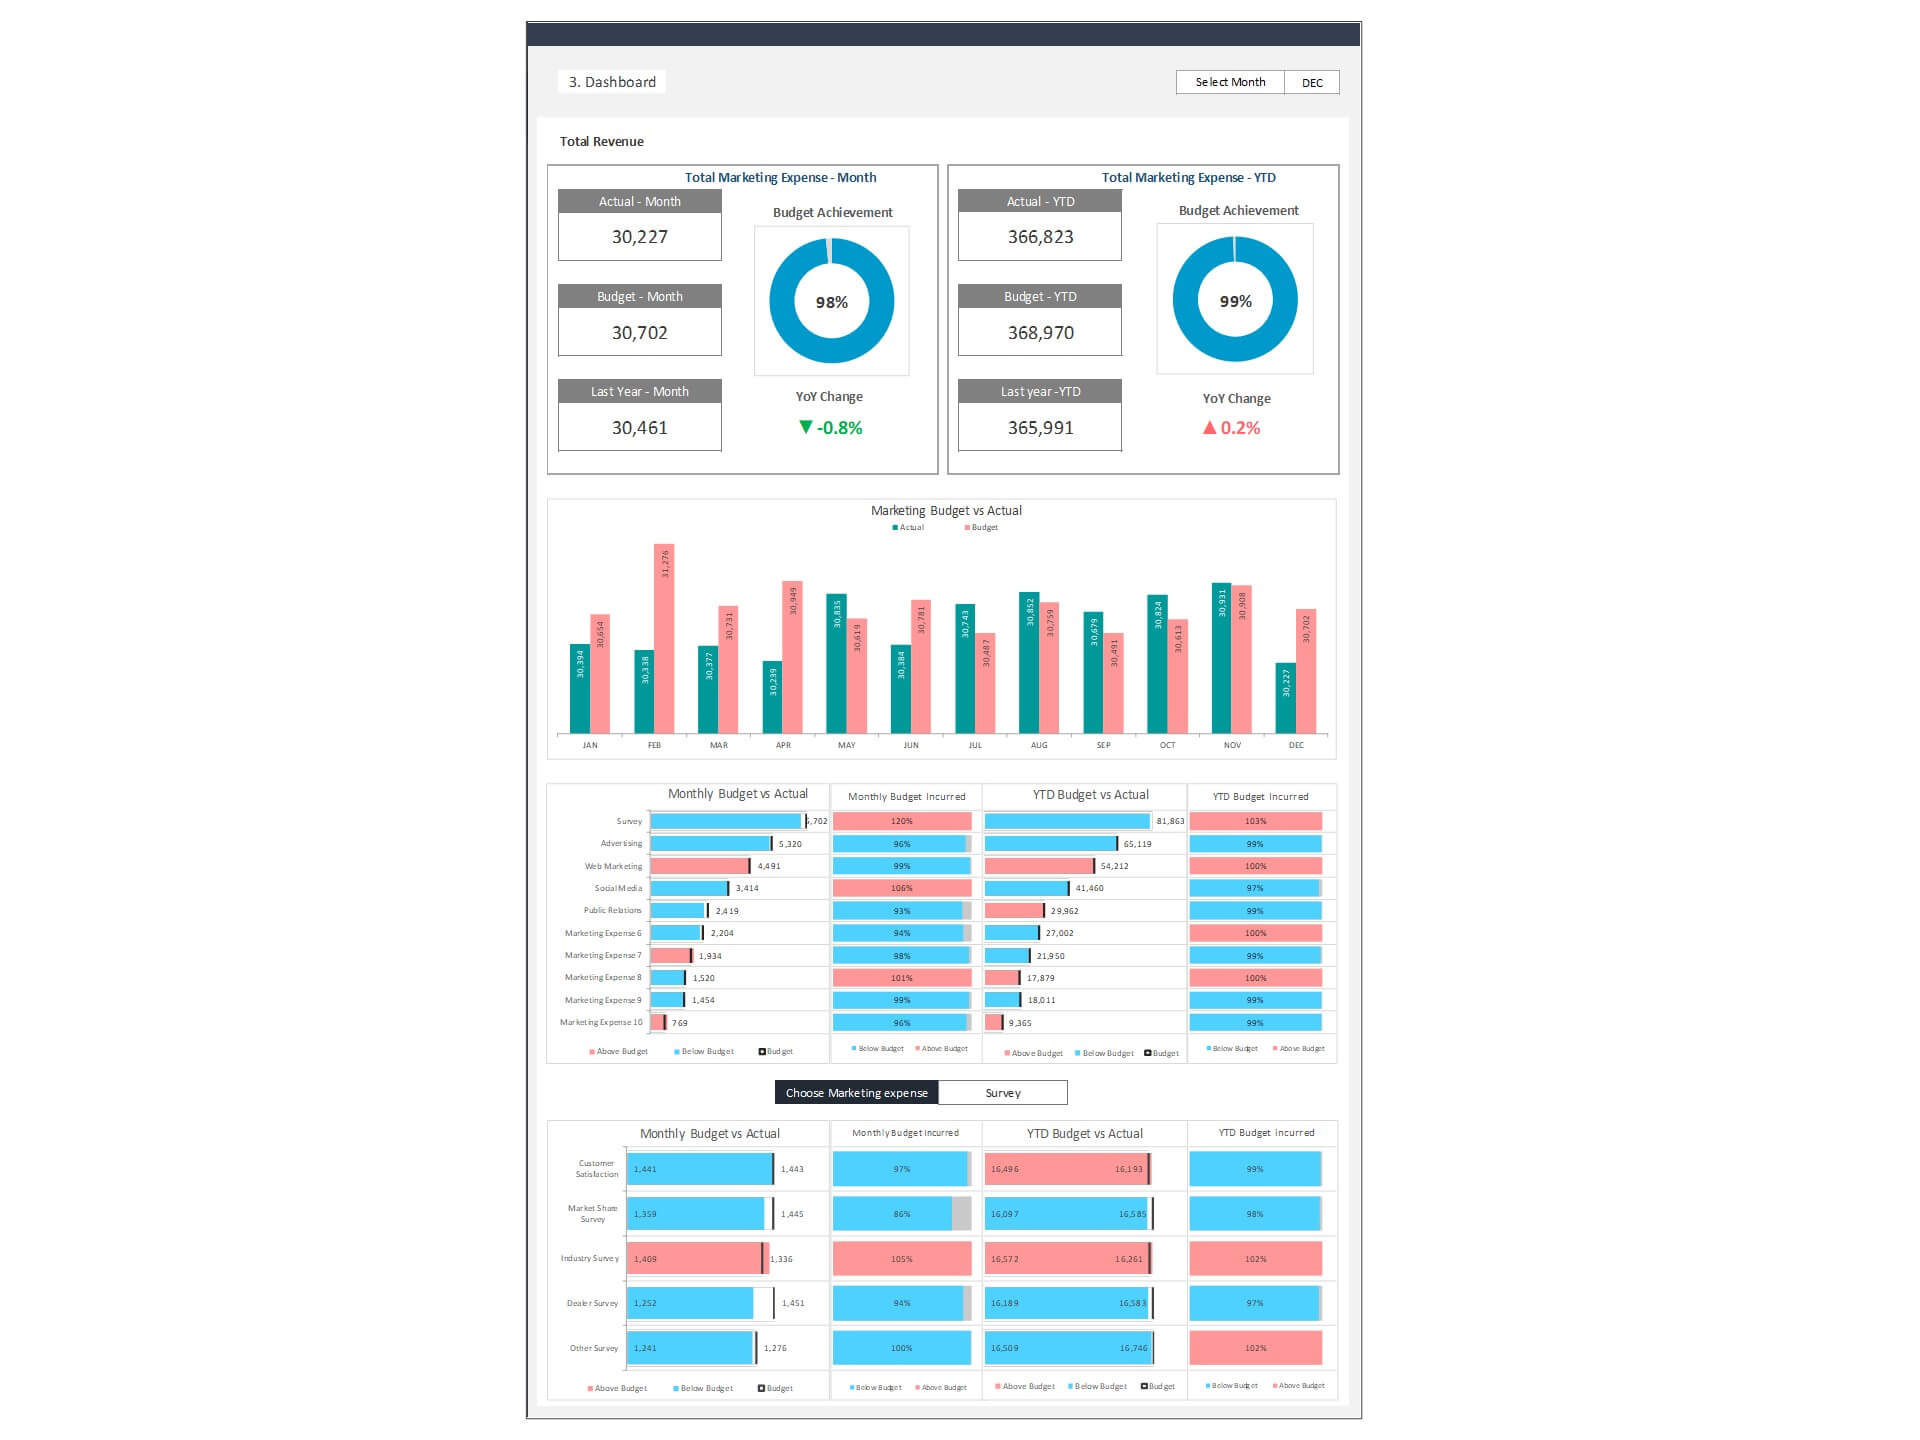
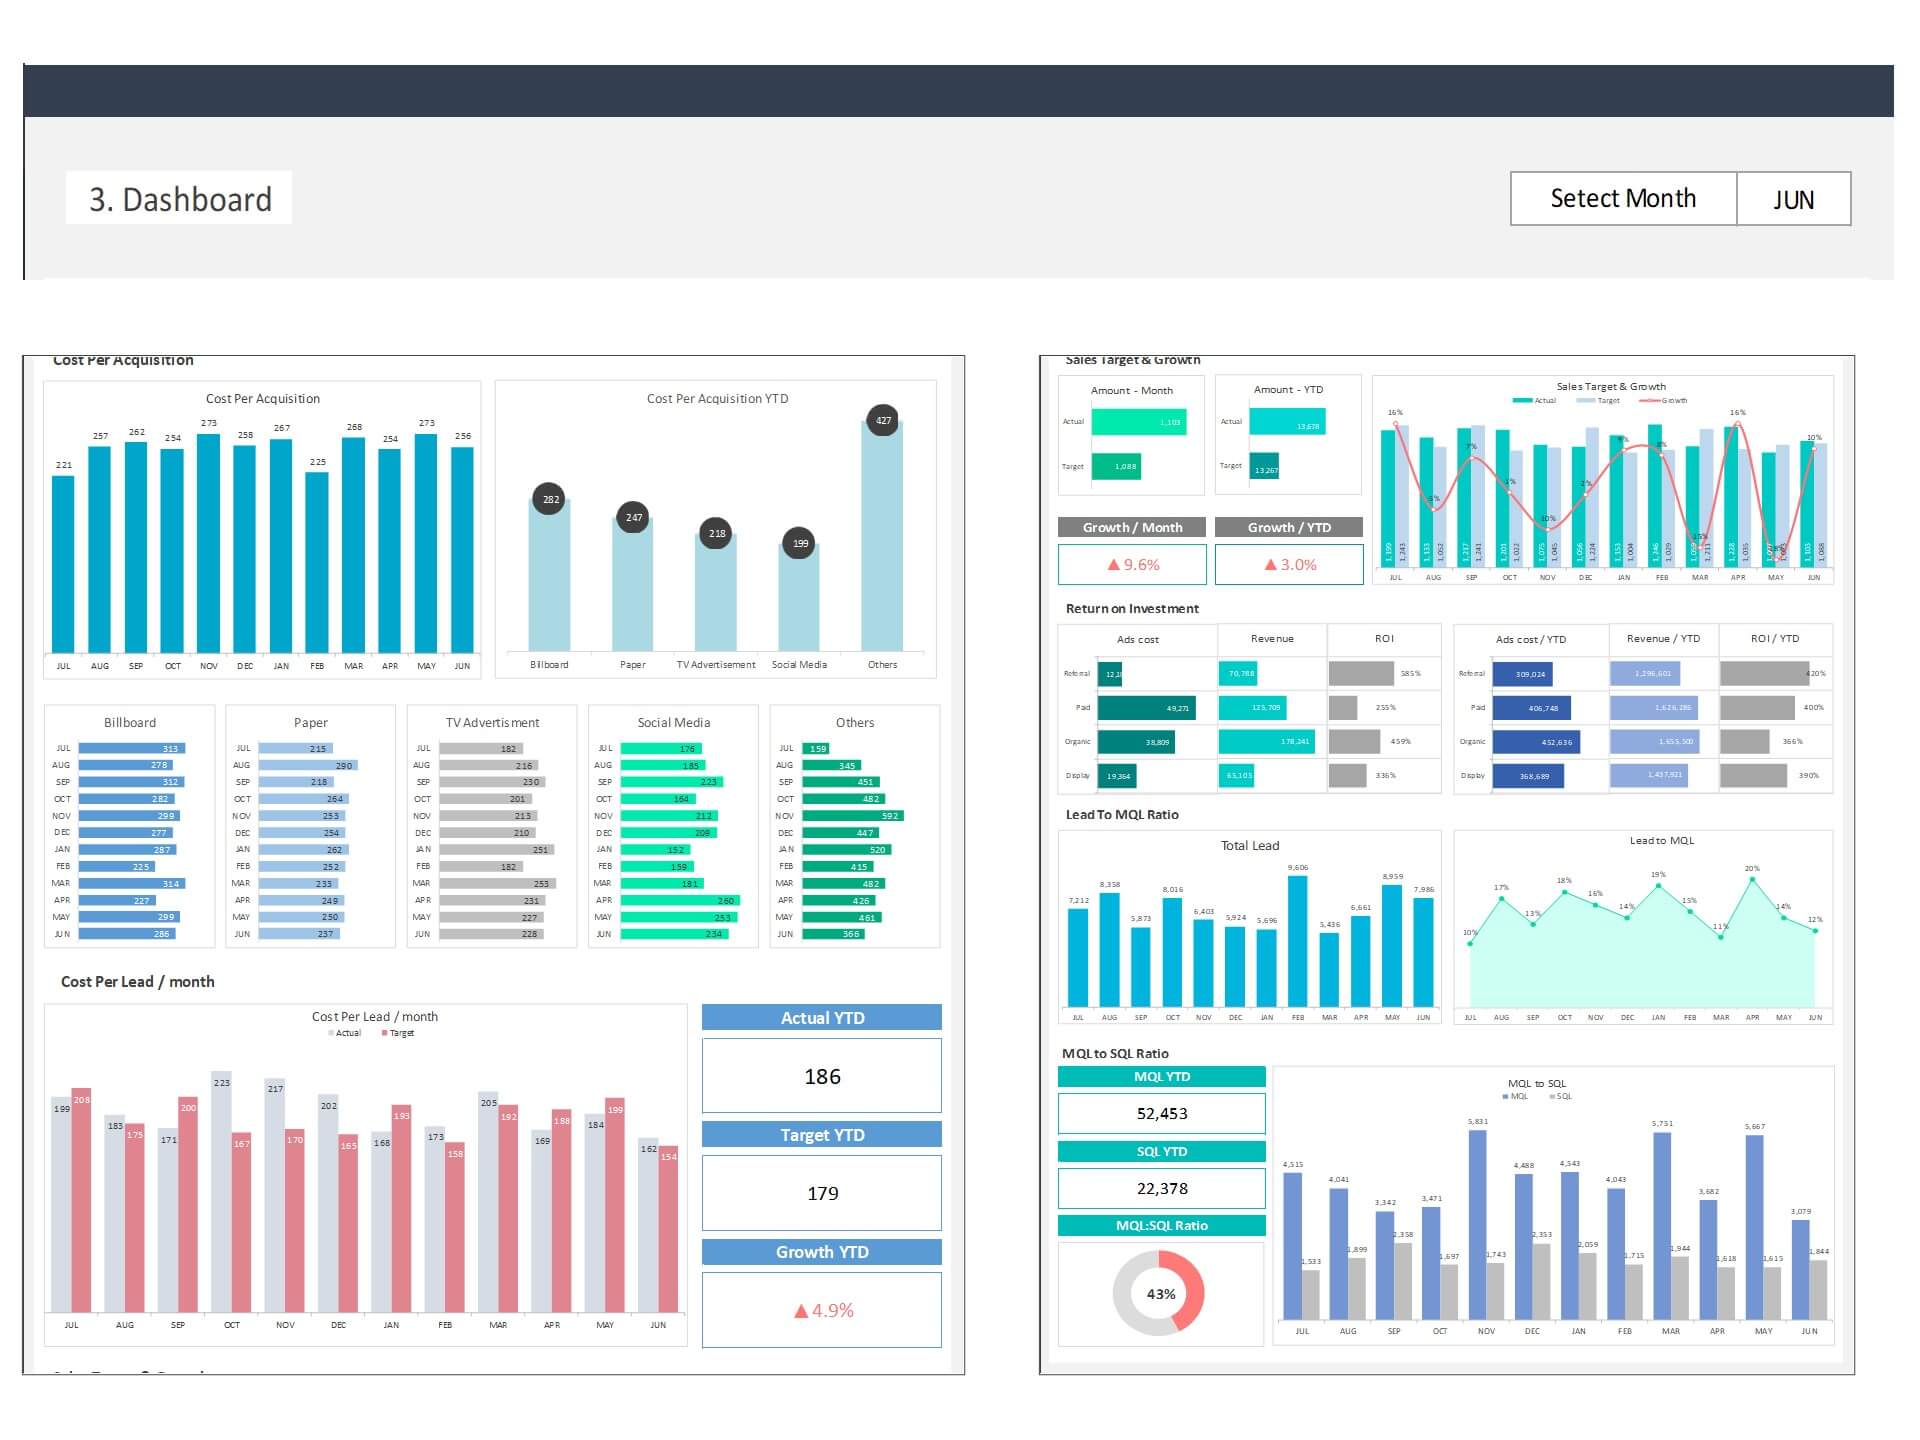
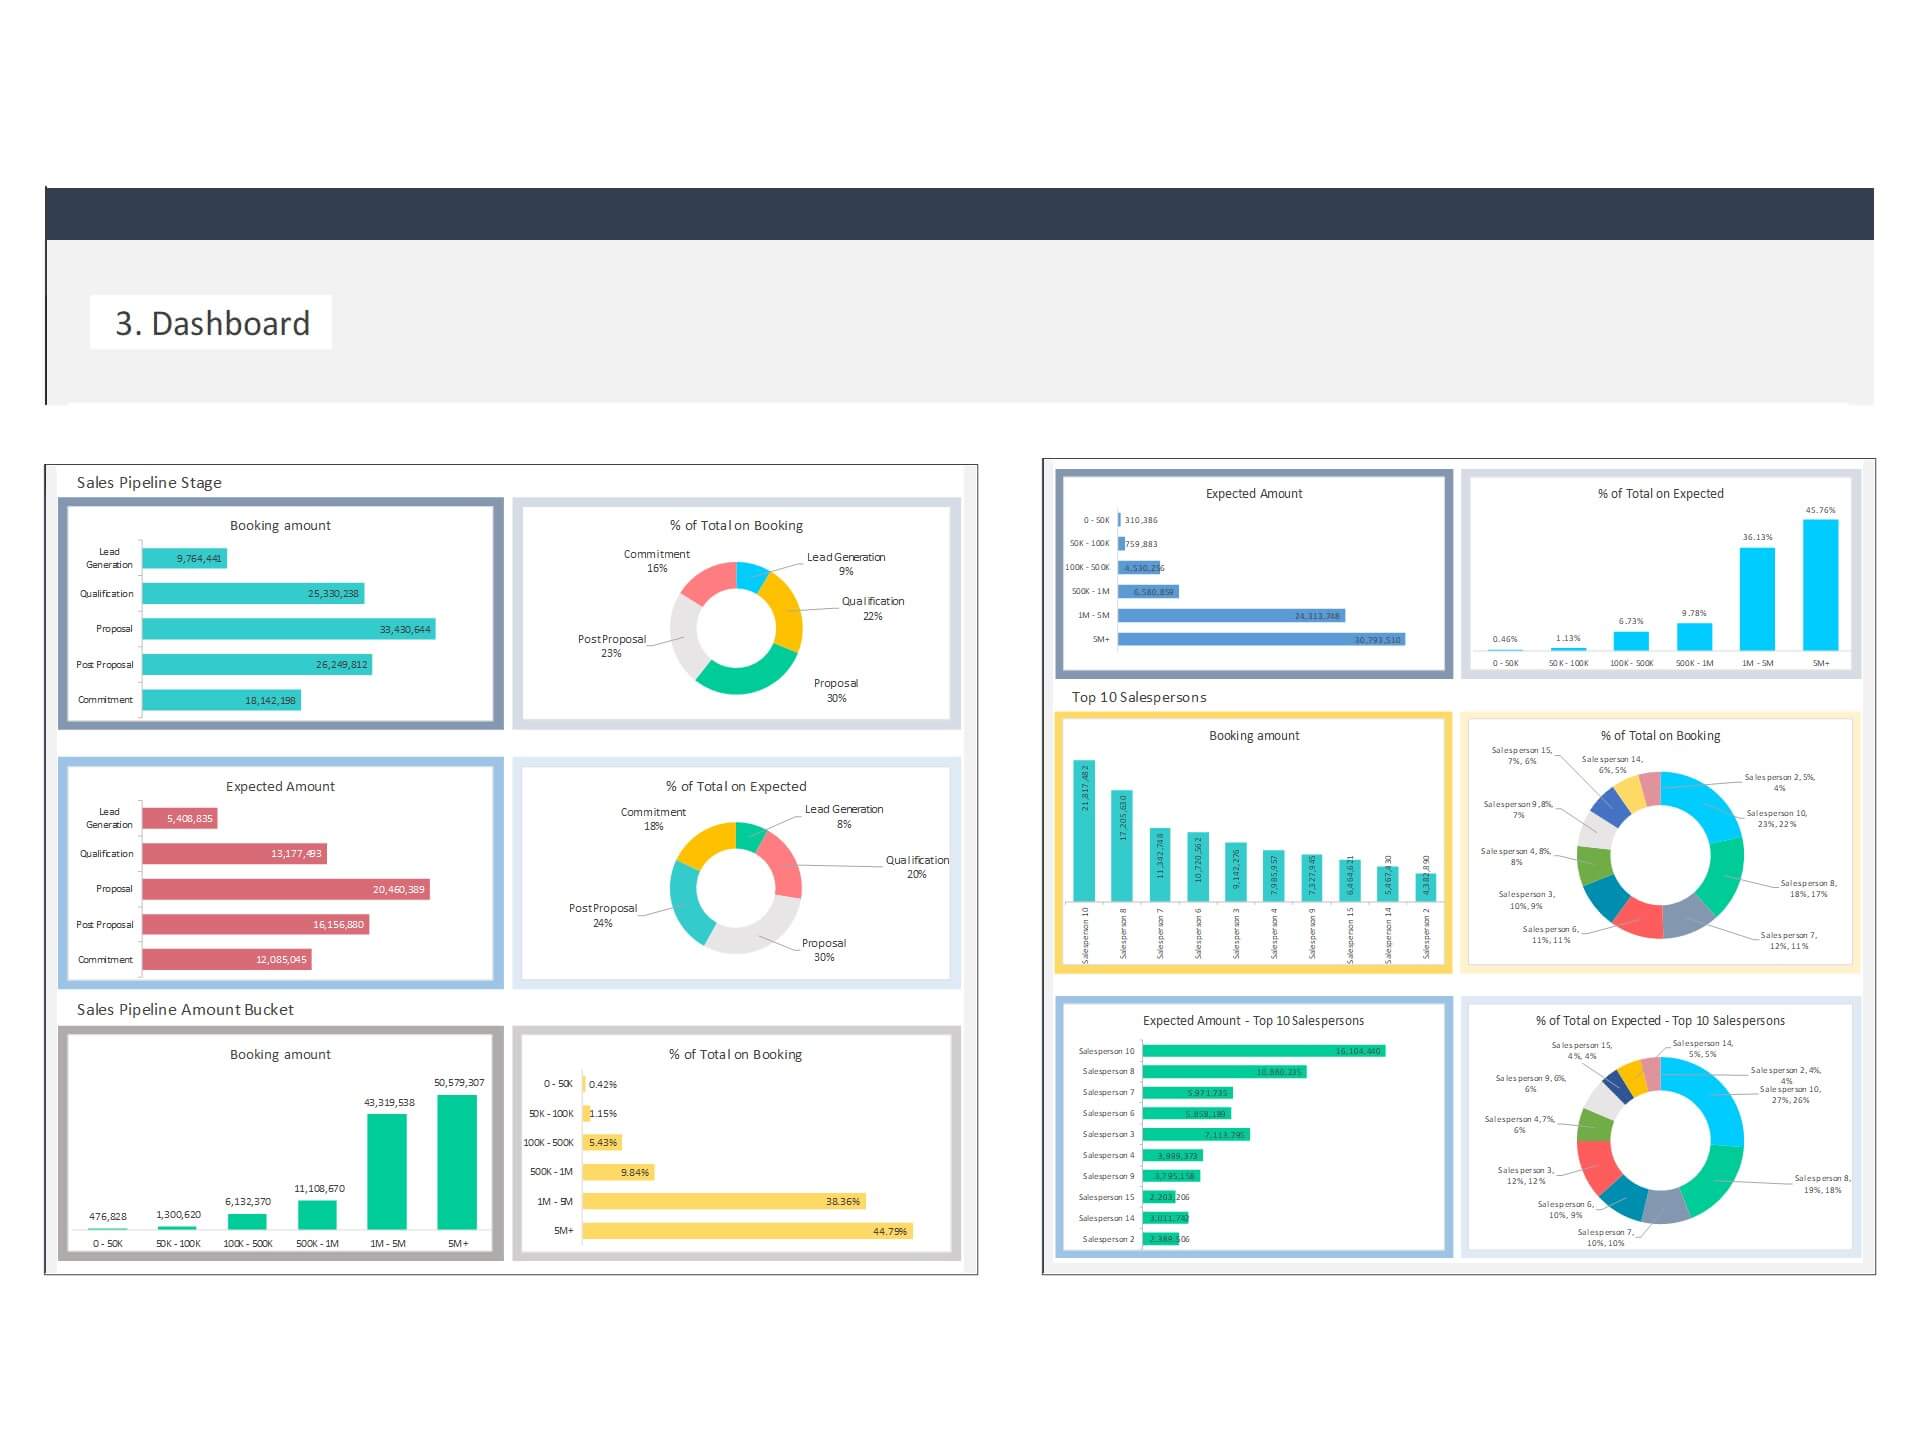
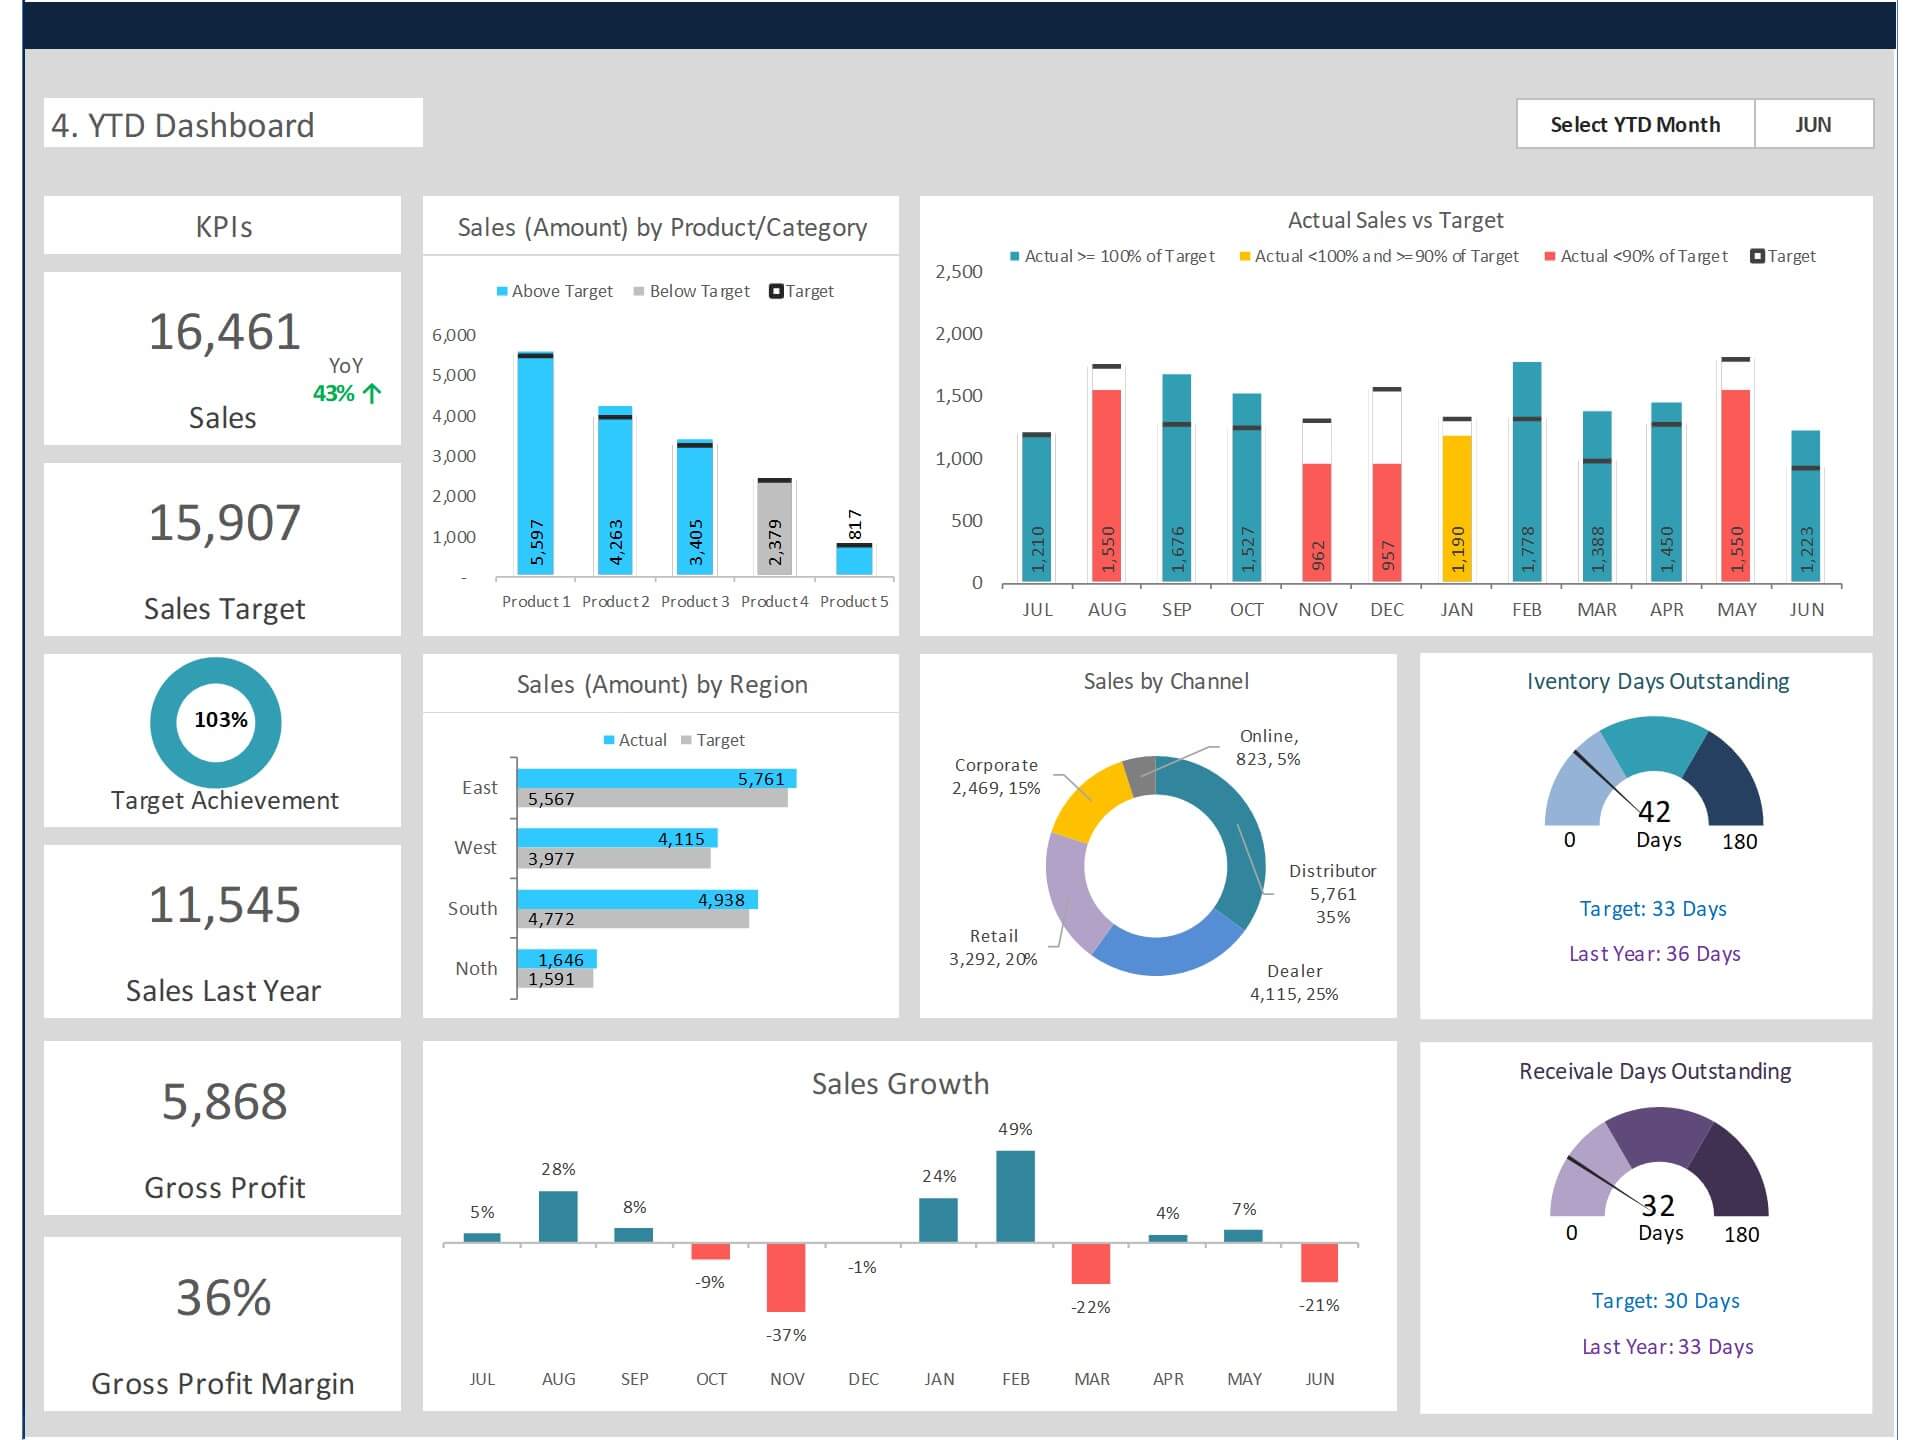
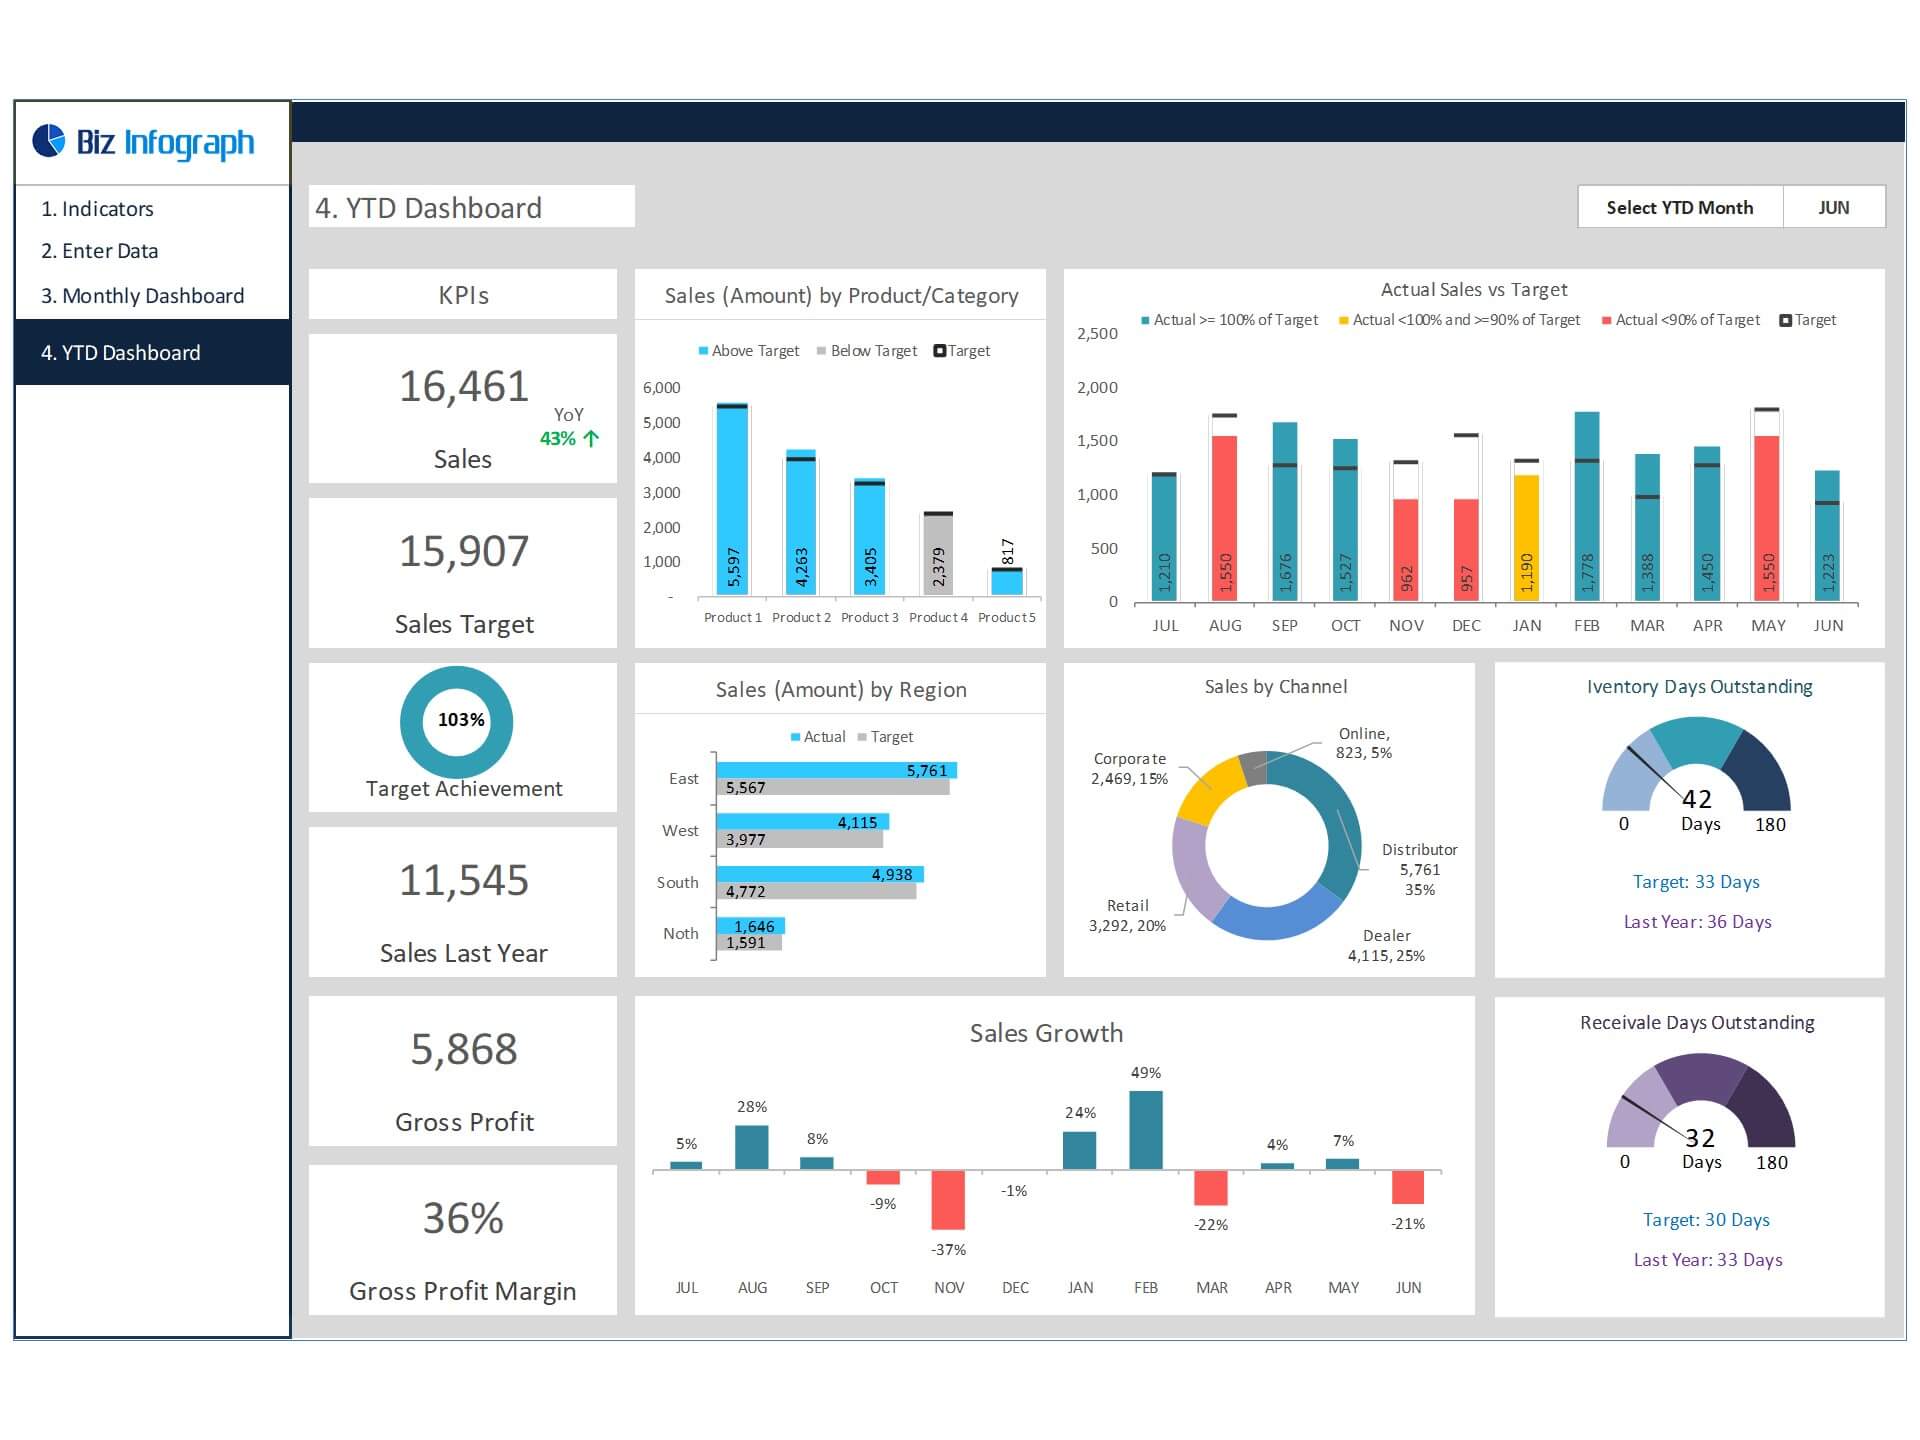
Essential Metrics and KPIs: These include Actual Sales, Budget Sales, Last Year Sales, Monthly Sales Achievement vs. Target, Sales by Product/Category, Sales by Region, Monthly Sales Growth, Inventory Days Outstanding, and Receivable Days Outstanding.
-
Real-time Data: This is crucial for making timely decisions. The ability to see up-to-date information allows for rapid response to market changes or internal issues.
-
Customization: A dashboard must be customizable to meet the specific needs of a business. Different organizations will prioritize different metrics based on their goals and operations.
-
Data Visual Elements: The use of charts, graphs, and color schemes is essential for making data accessible. A well-designed dashboard not only conveys information effectively but also engages the user, making data analysis less tedious.
Key Features of this Sales Dashboard Template
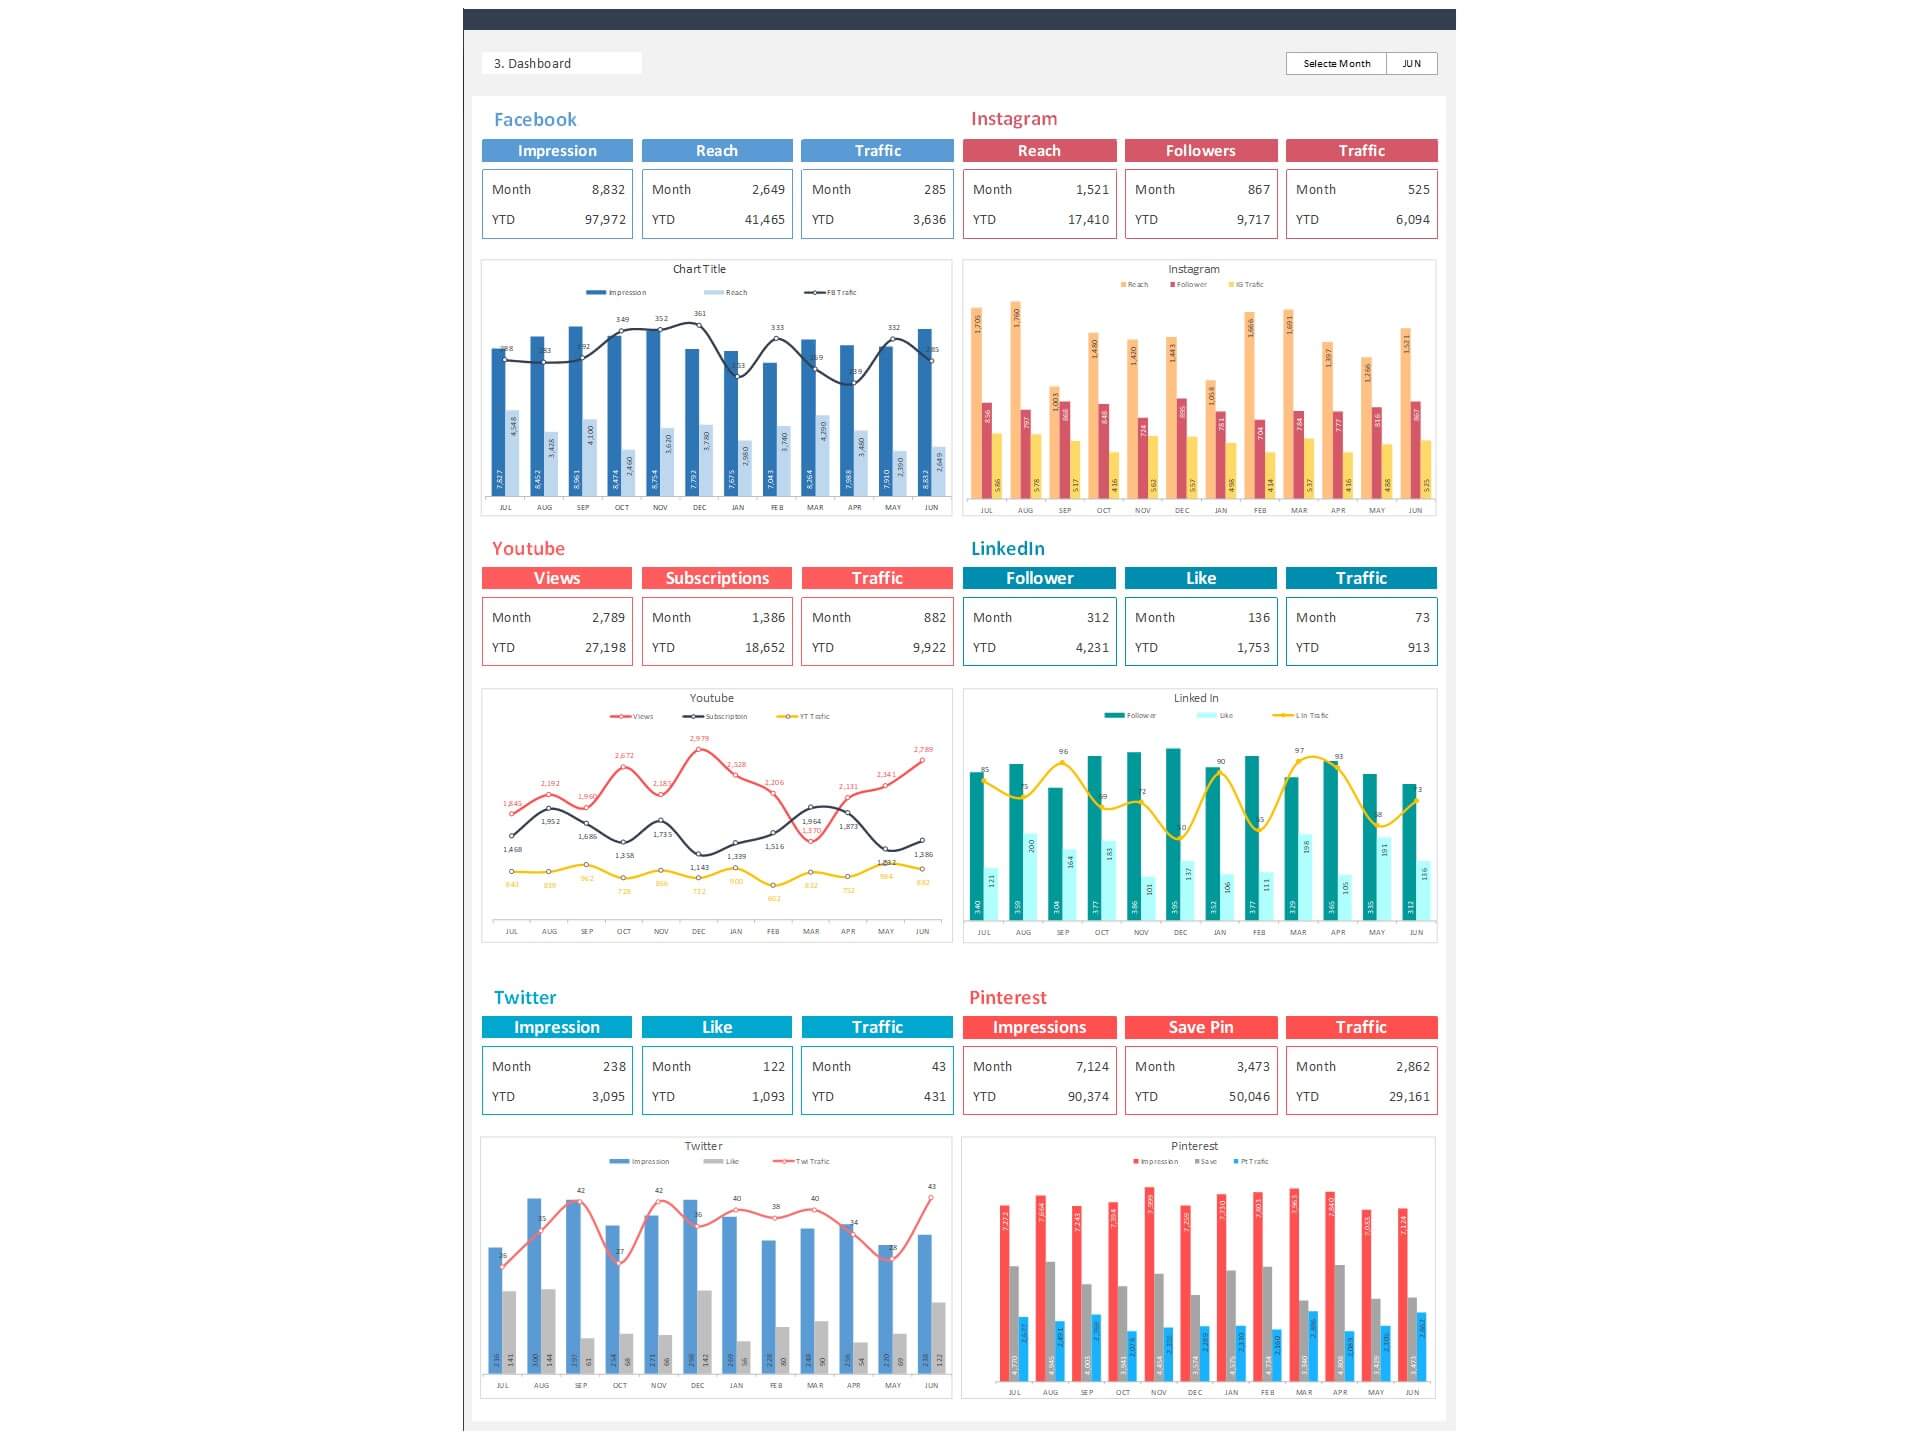
- Provides key sales insights for the CEO and sales team with details of total sales, sales by product/category, sales by channel, profitability, and receivables
- Visualize overall sales performance
- Fully editable, easy to use, template with sample data
- Eye-catching design and customizable
- Change the sample data with your data
- Spreadsheets ready for printing without Biz Infograph logo
- Consolidate key financial performance indicators in one dashboard
- No monthly fees
- Immediate download
- No VBA, no Macro
- No installation necessary
- Professionally designed
What is included in this sales dashboard template?
- Just plug your data, the dashboard will be ready instantly and start using.
- A text file which contains a password to view and edit the formula
- A guide to unlocking all the elements in the dashboard
Professional Support:
- Video tutorial guide on how to navigate and use Sales Dashboard Template
- Professional service to customize dashboard template in excel as per business need
- Help and support in post-purchase
- Payment secured by Stripe and PayPal (no PayPal account needed)
A brief guide to using the dashboard template:
- Open the dashboard template
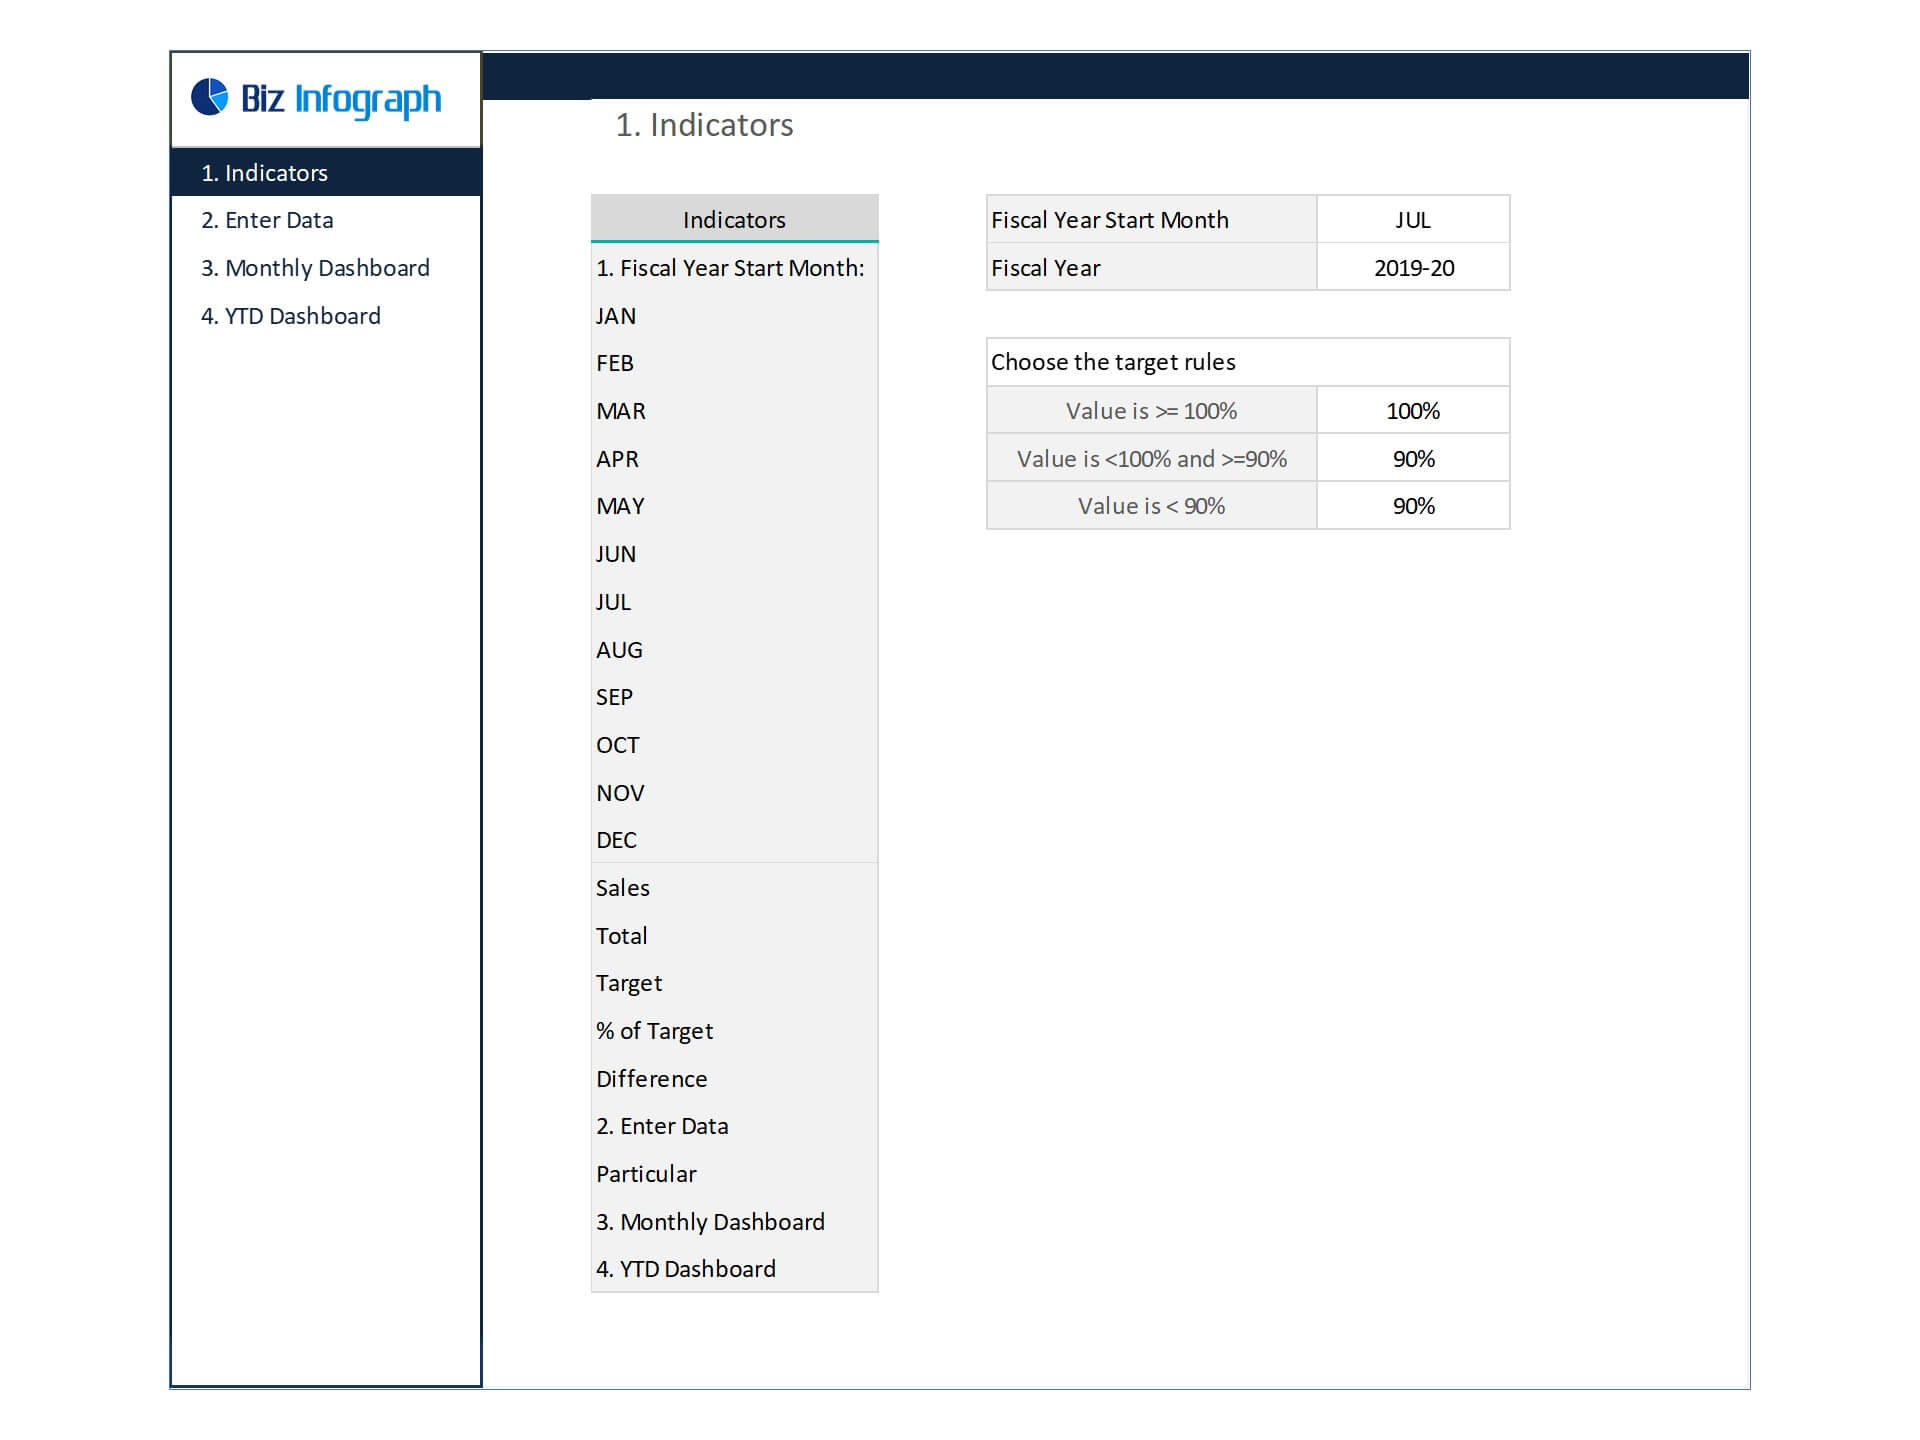
- Go to ‘Indicators’ menu – choose the start month of the fiscal year (i.e. Jan, Feb, Jul, etc.)
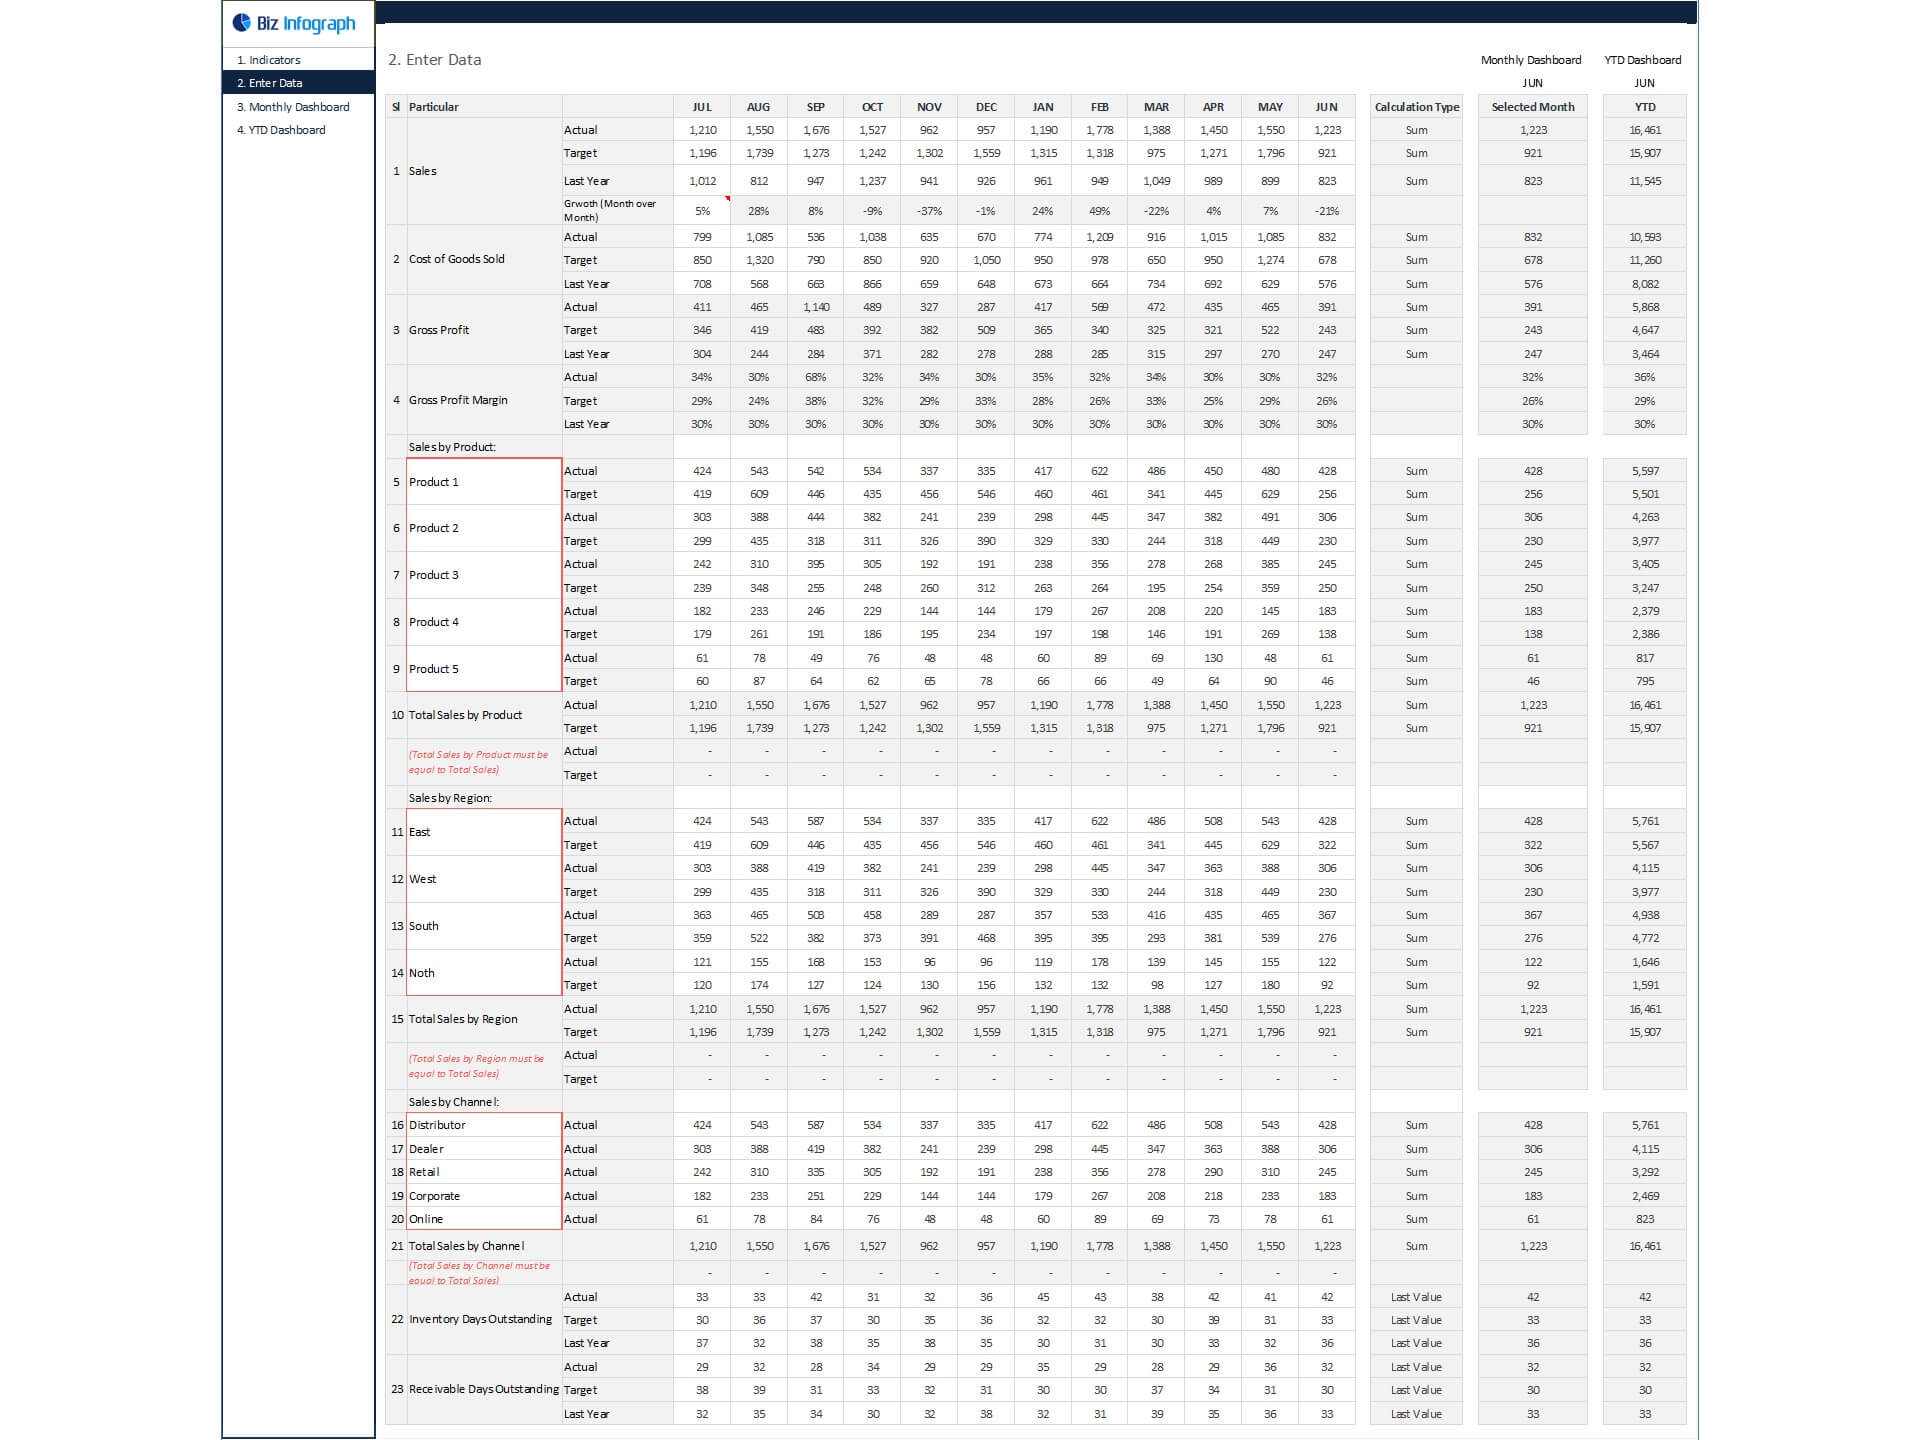
- Go to the ‘Enter Data’ menu – remove the sample data and give your actual data in the respective cells. Formula cells are locked, and you cannot edit it without a password.
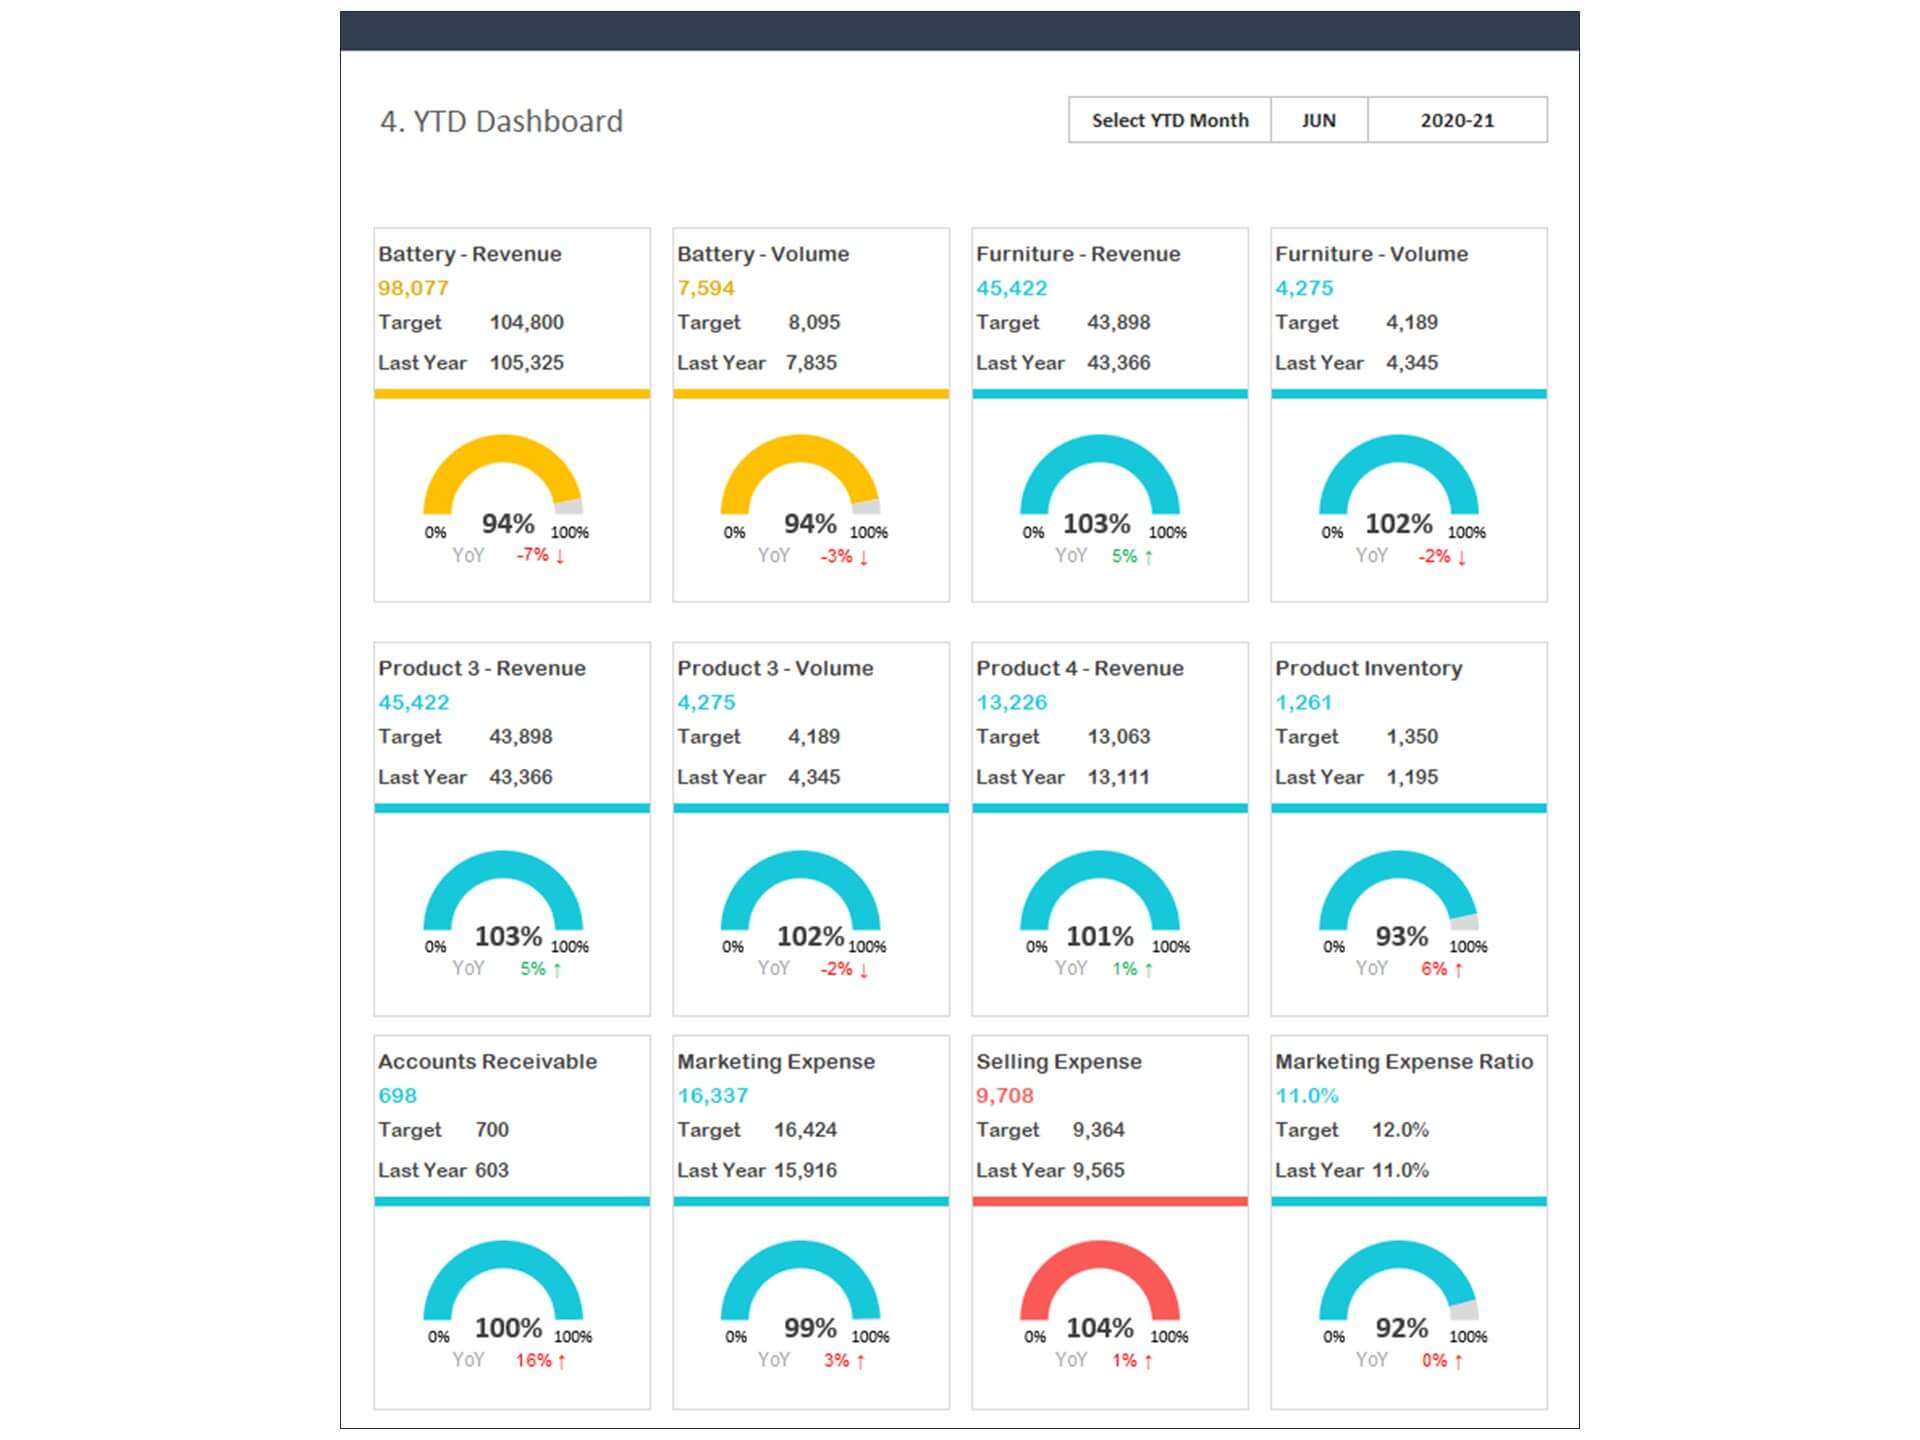
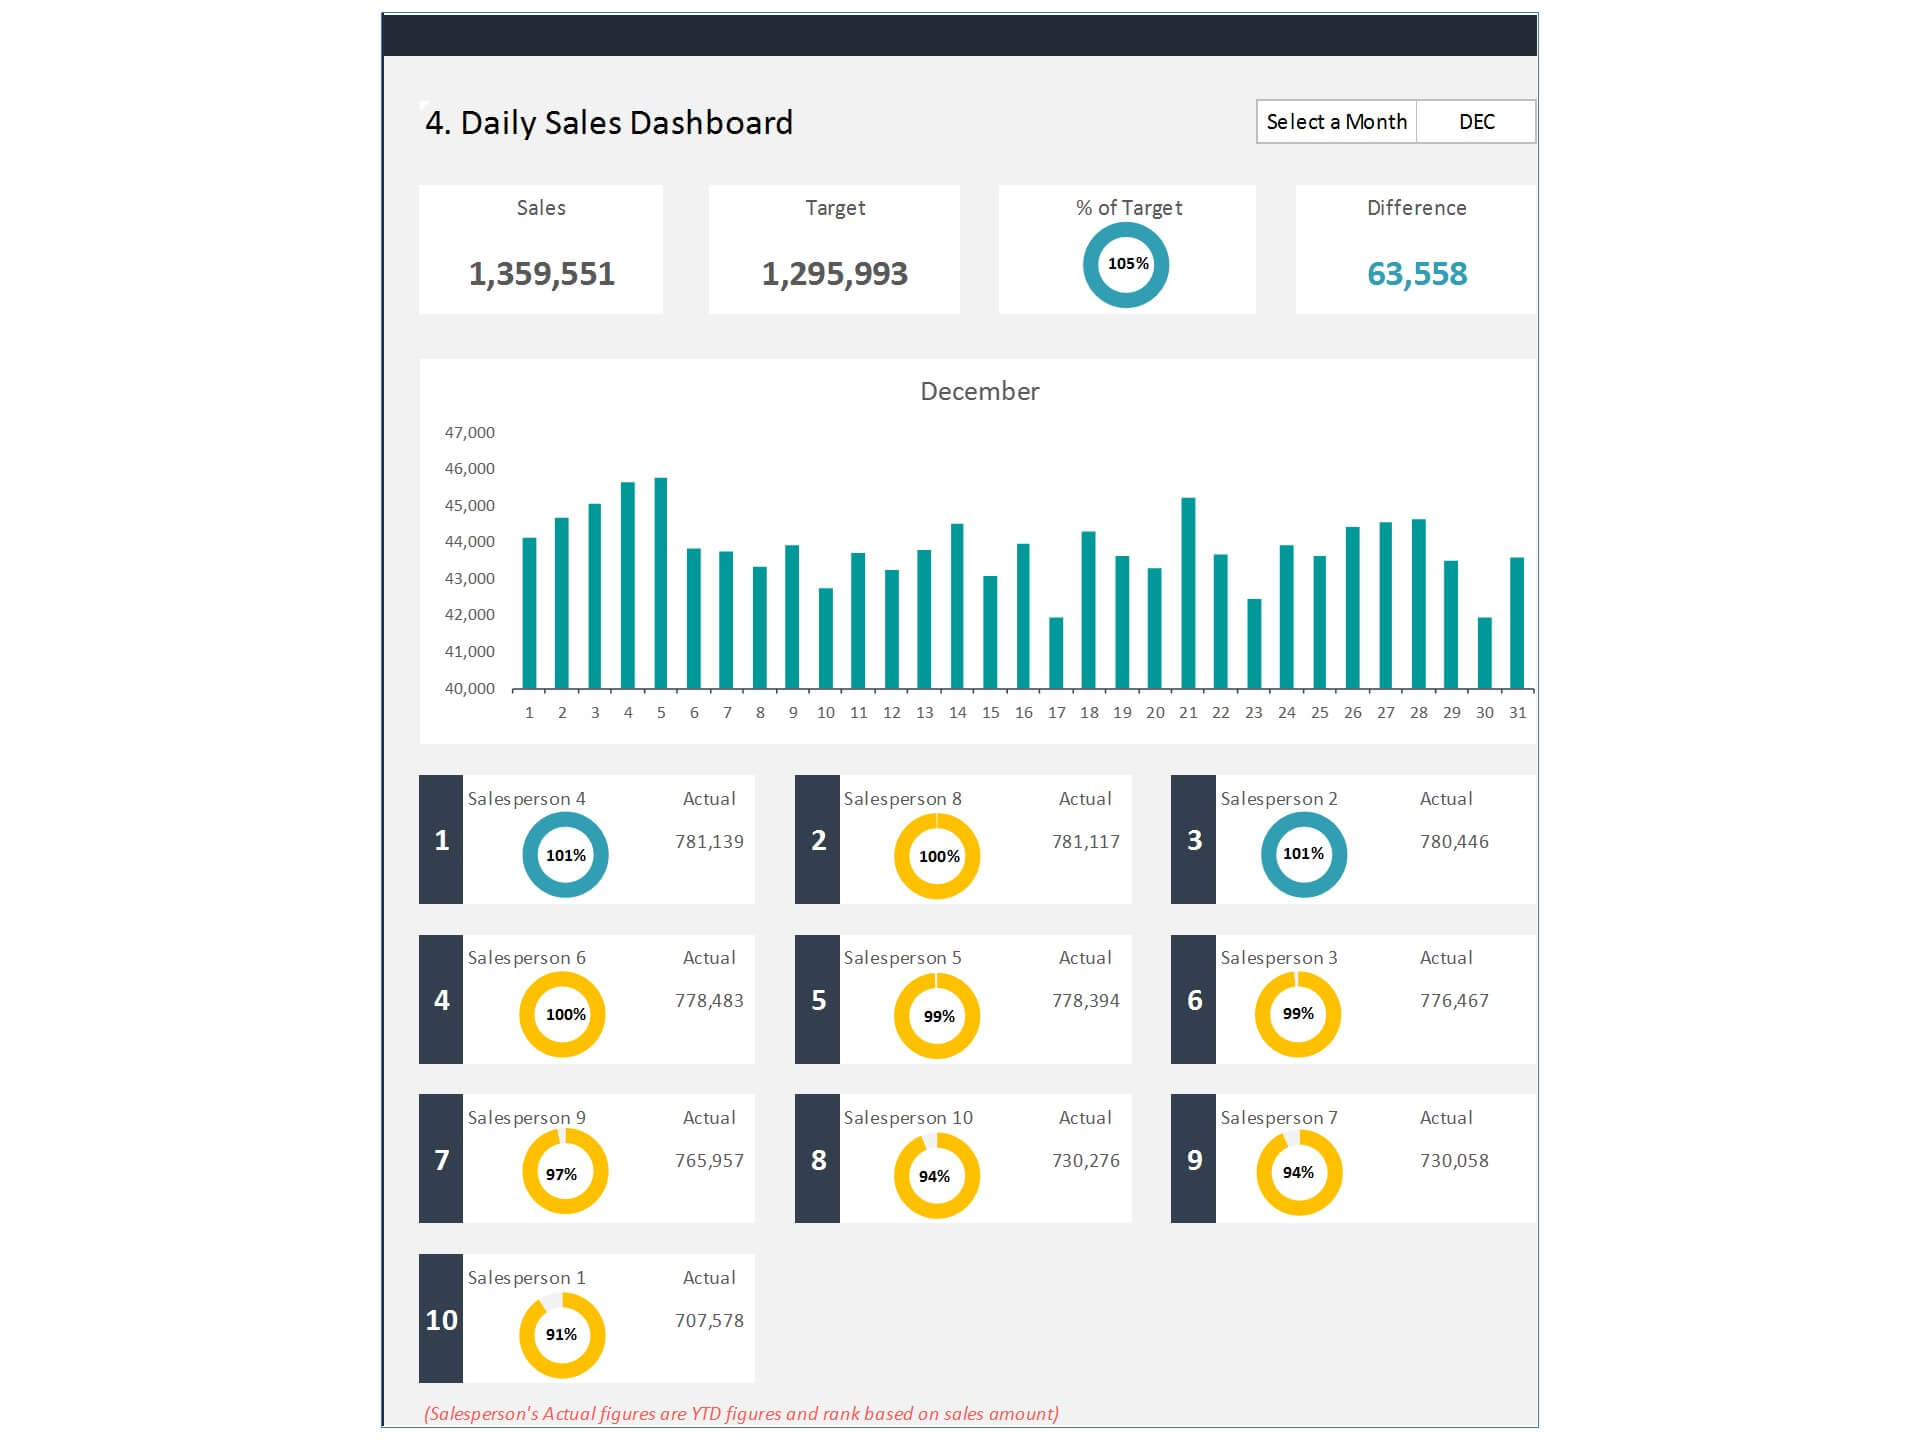
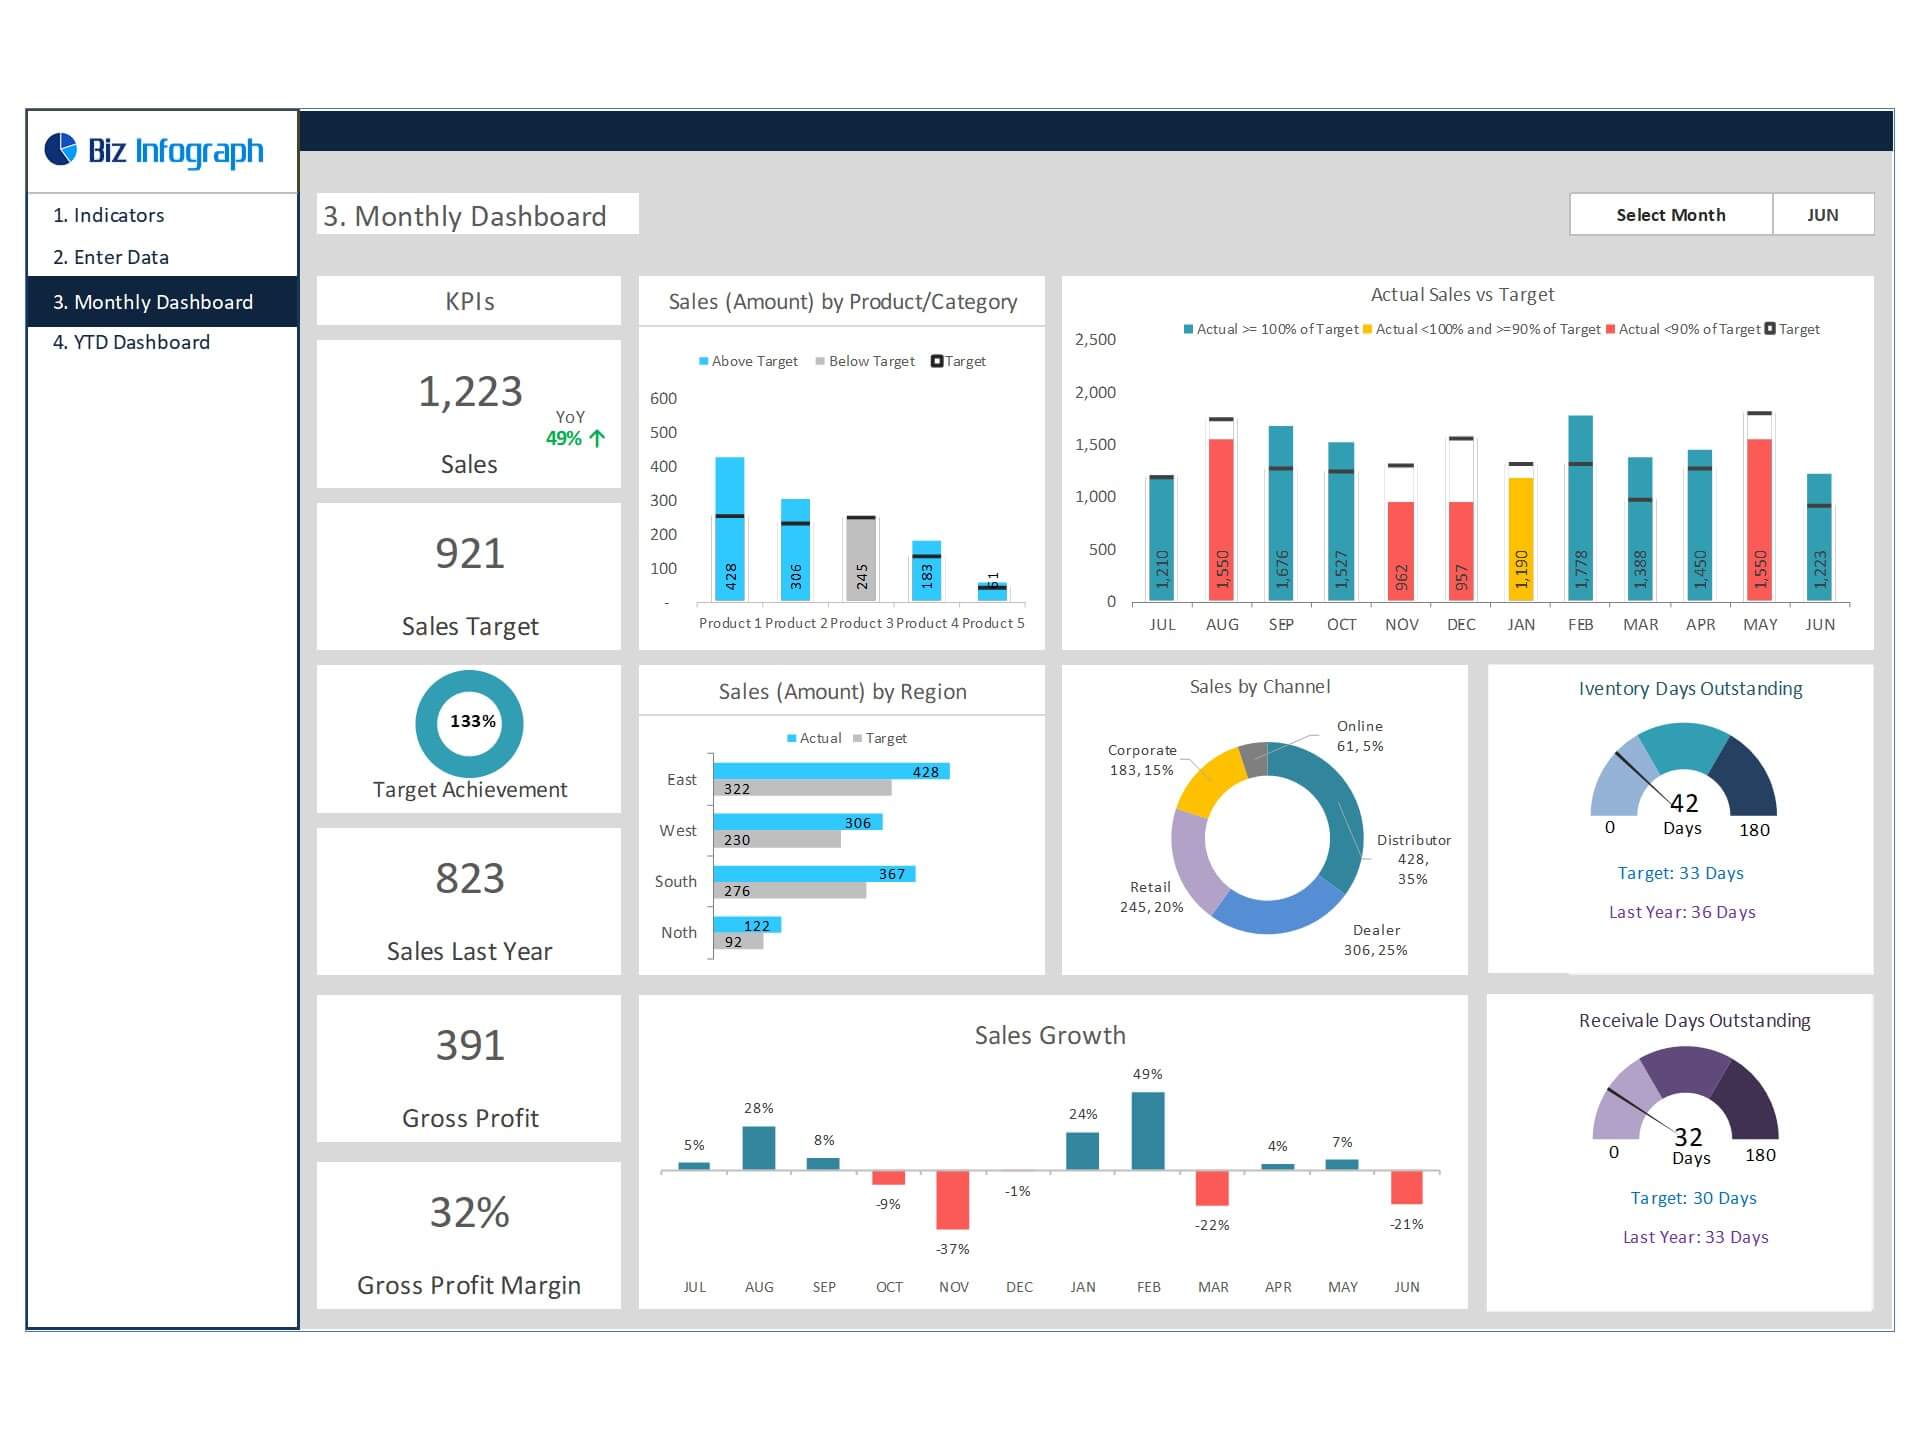
- Go to the ‘Monthly Dashboard’ menu – select the month name from the drop-down to see the monthly picture of performance indicators
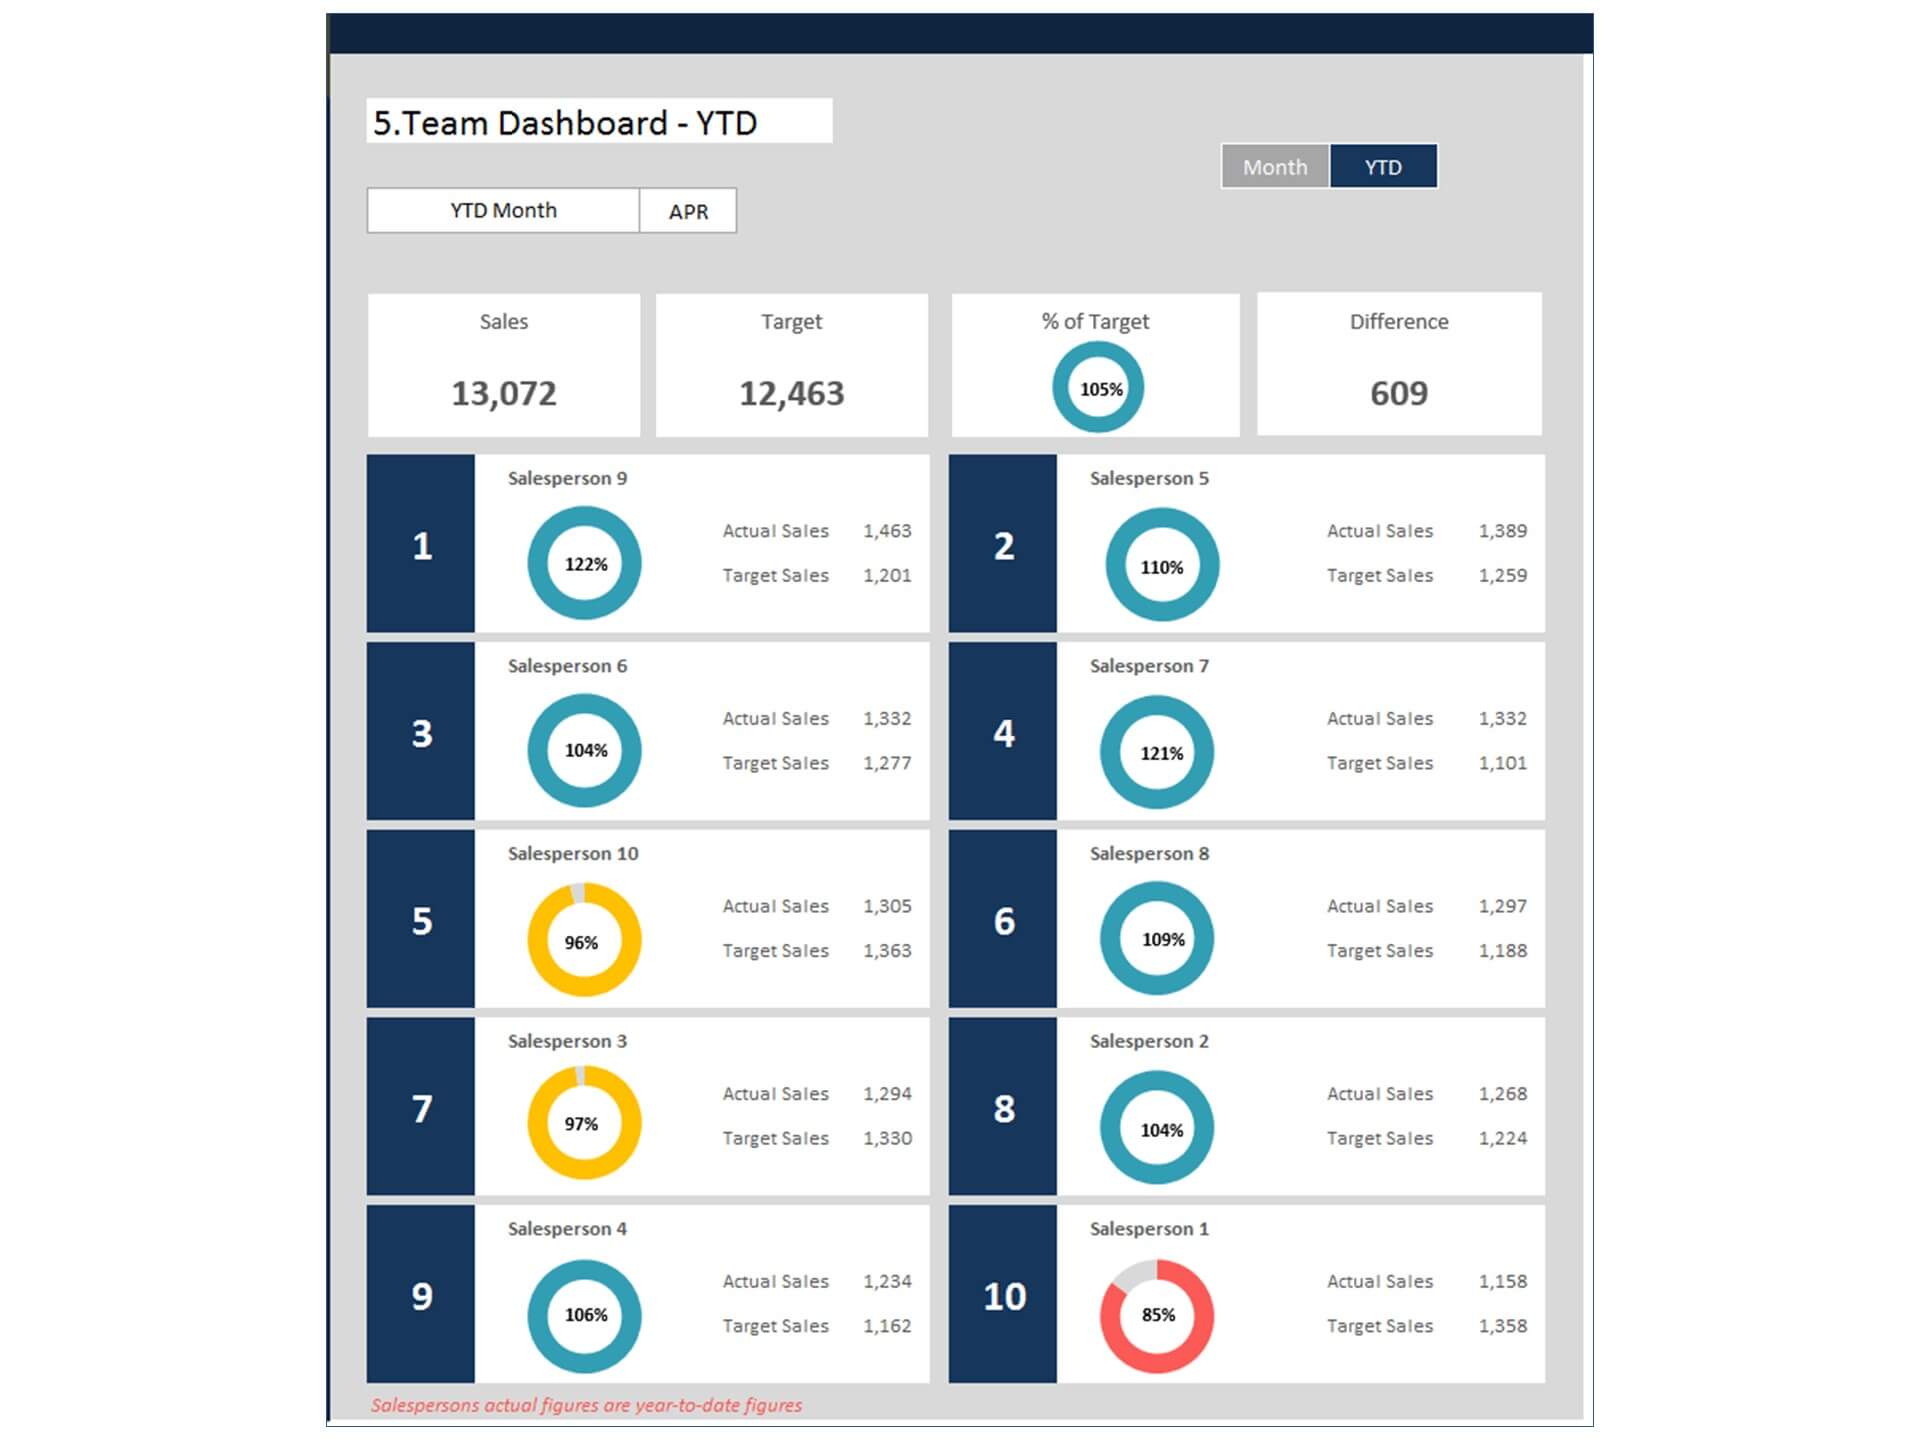
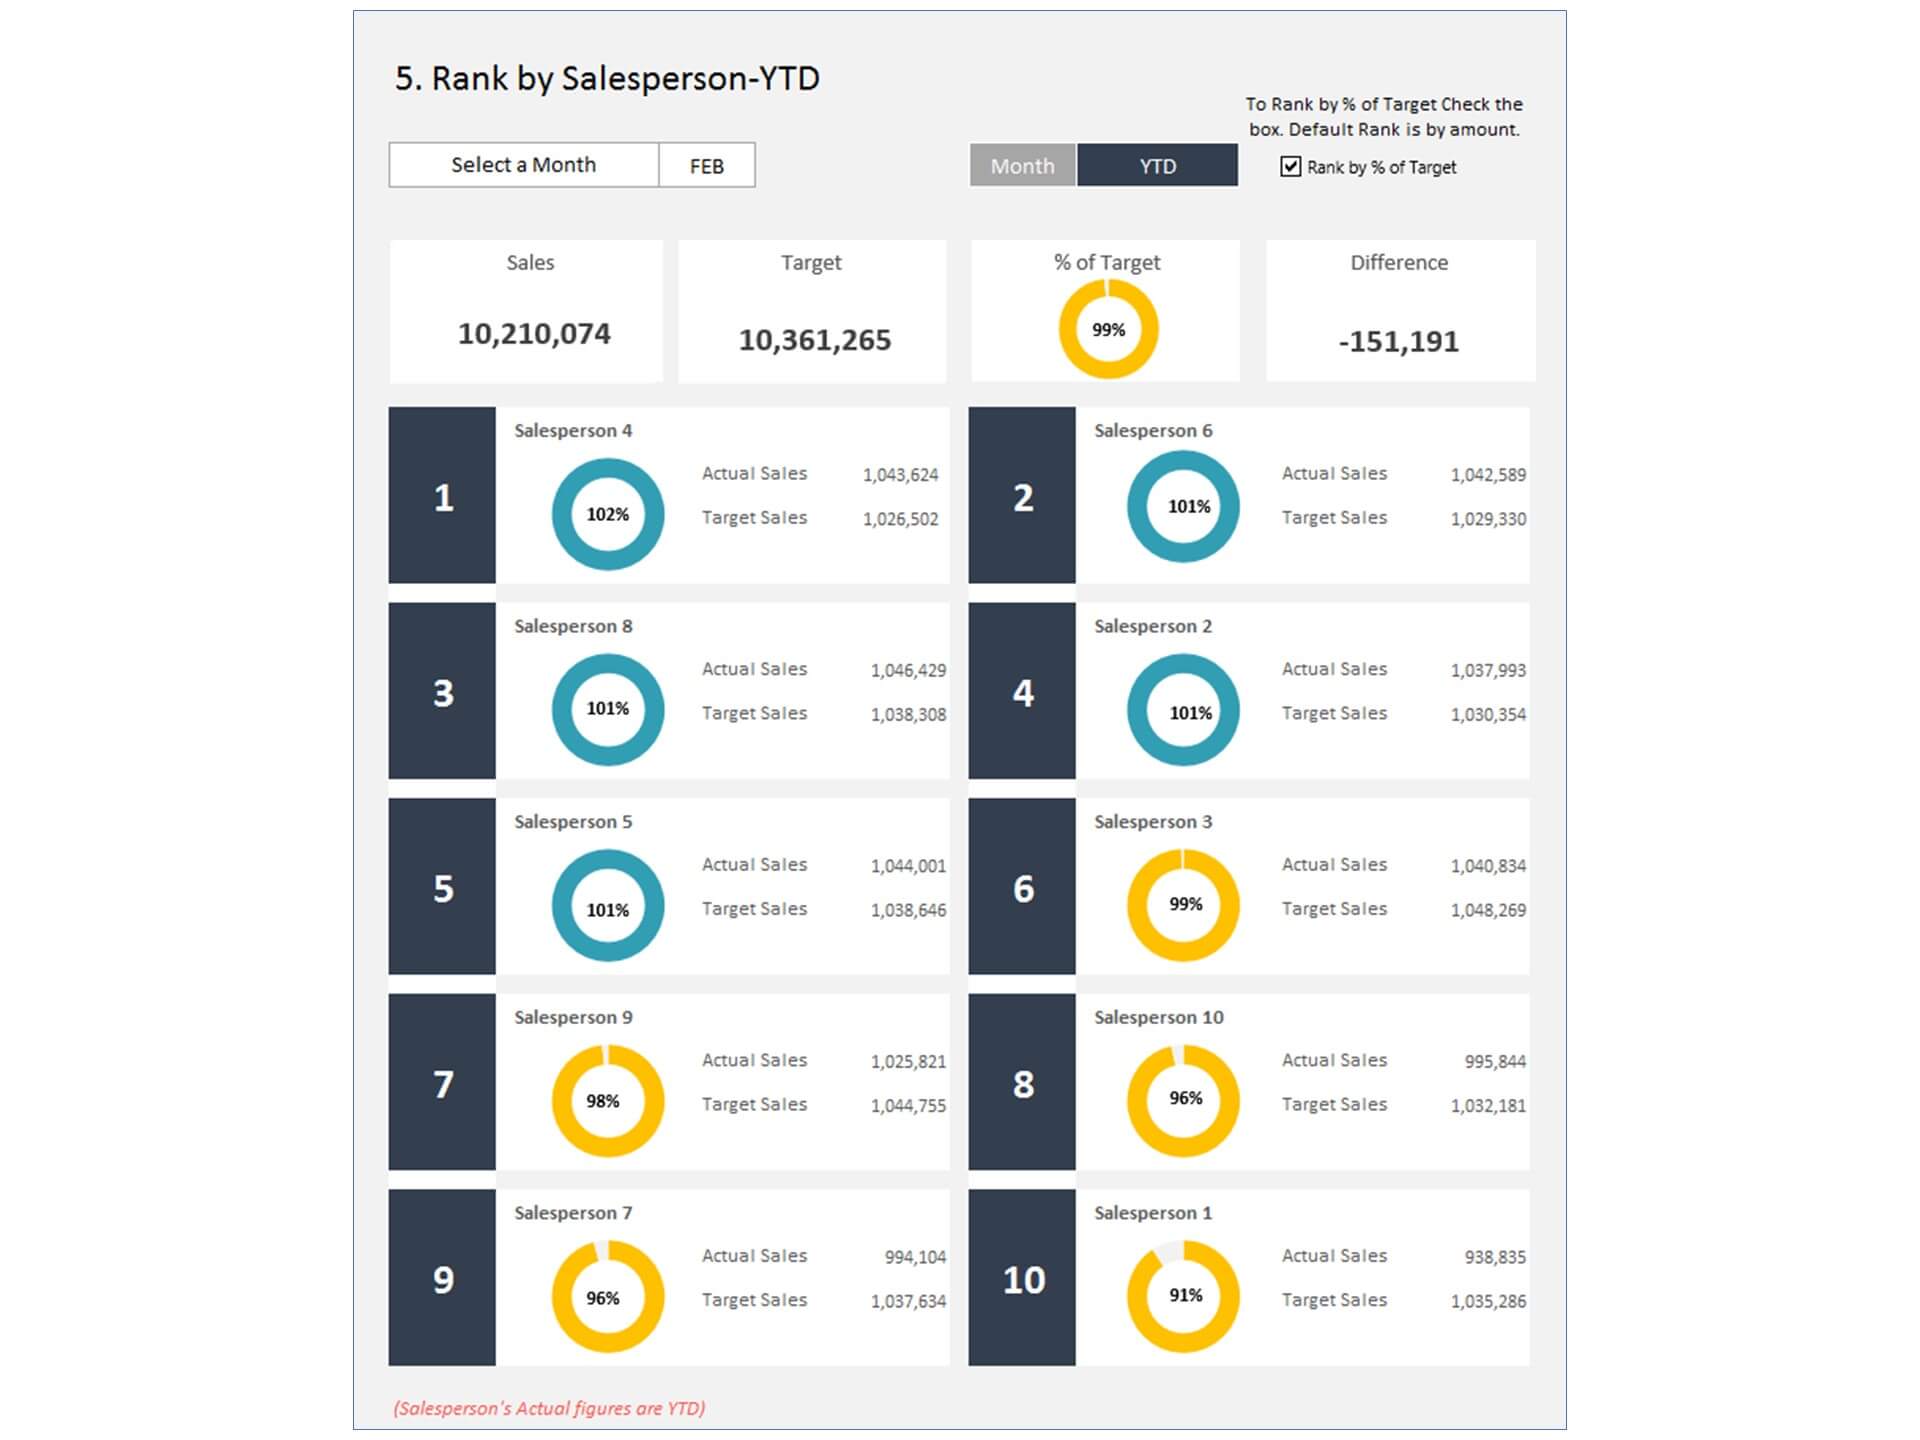
- Go to ‘YTD Dashboard’ menu - select month name from the drop-down to see the year-to-date picture of performance indicators
- Each page is ready for printing – just press CTRL+P
This Excel dashboard template is password-protected to avoid mistakes, such as accidentally deleting formulas. When you completed the purchase, the password will be available.
For ready-to-use Dashboard Templates: