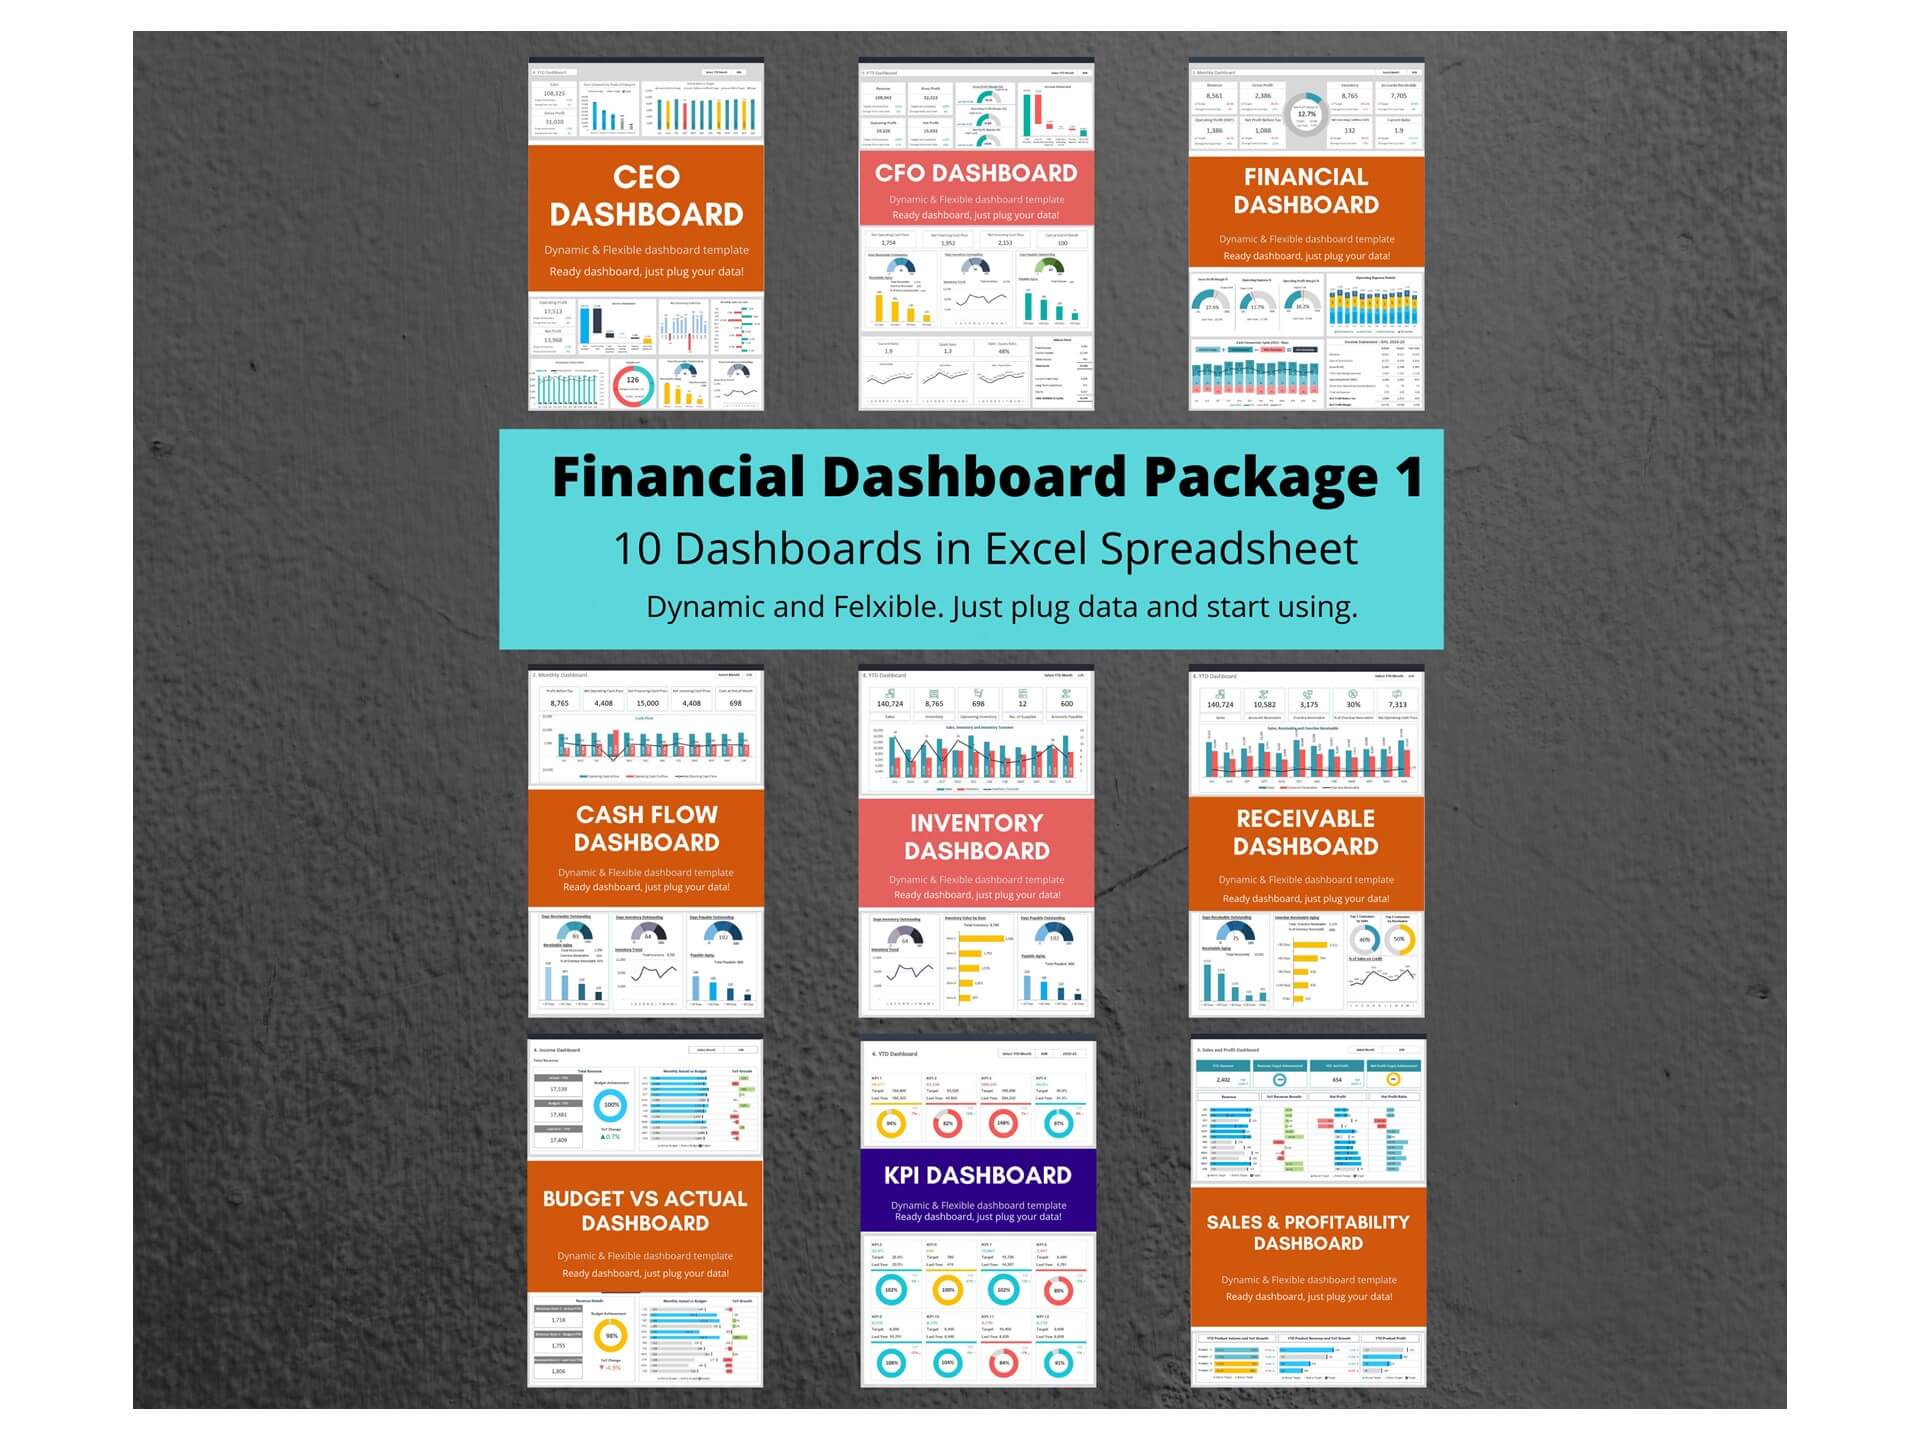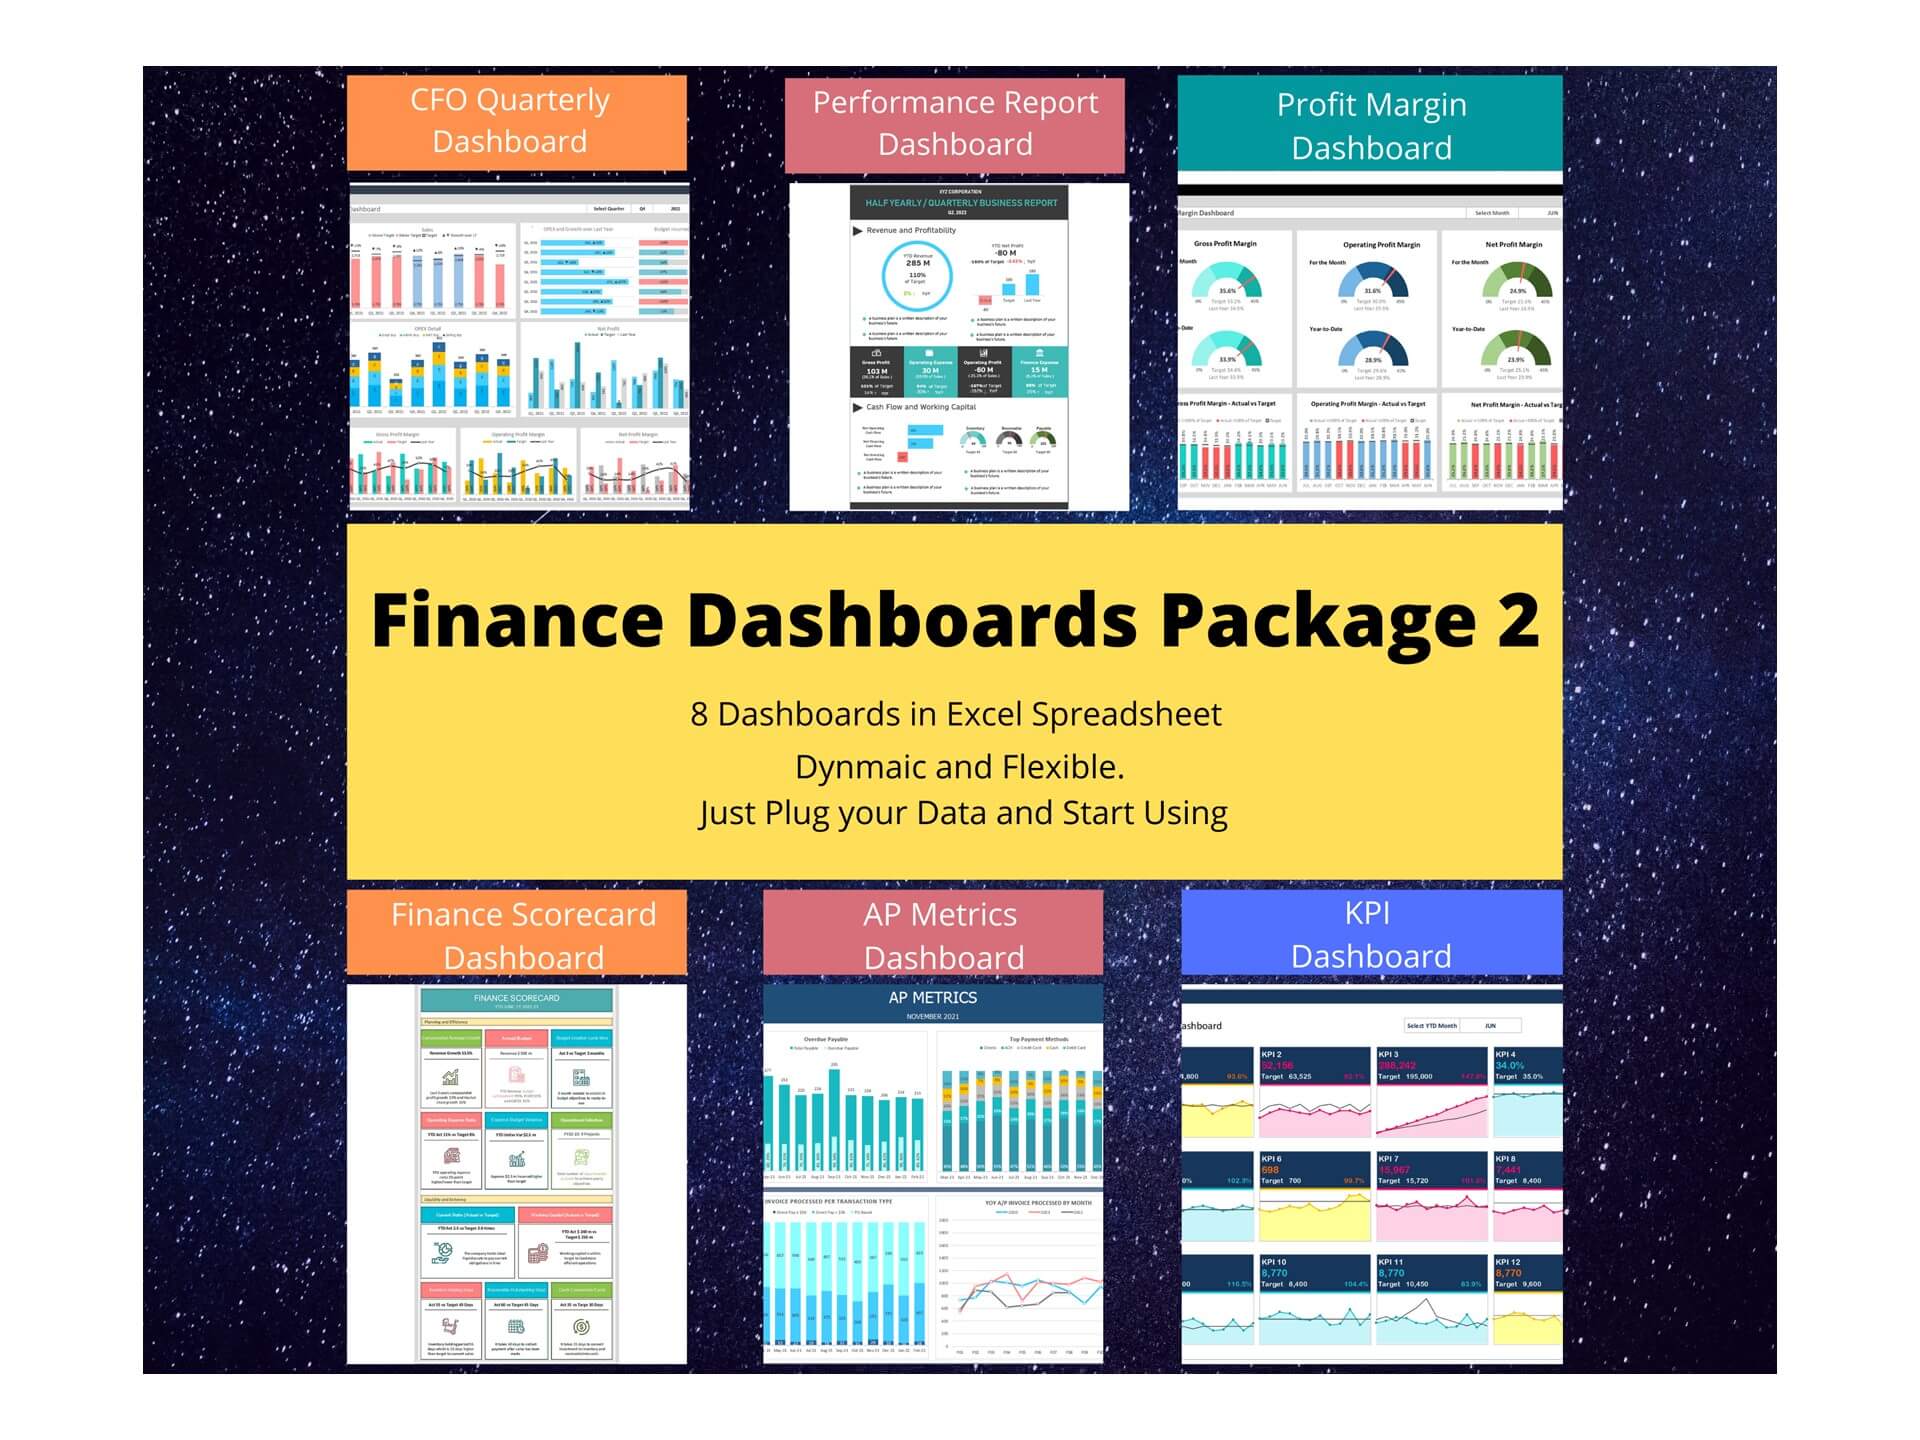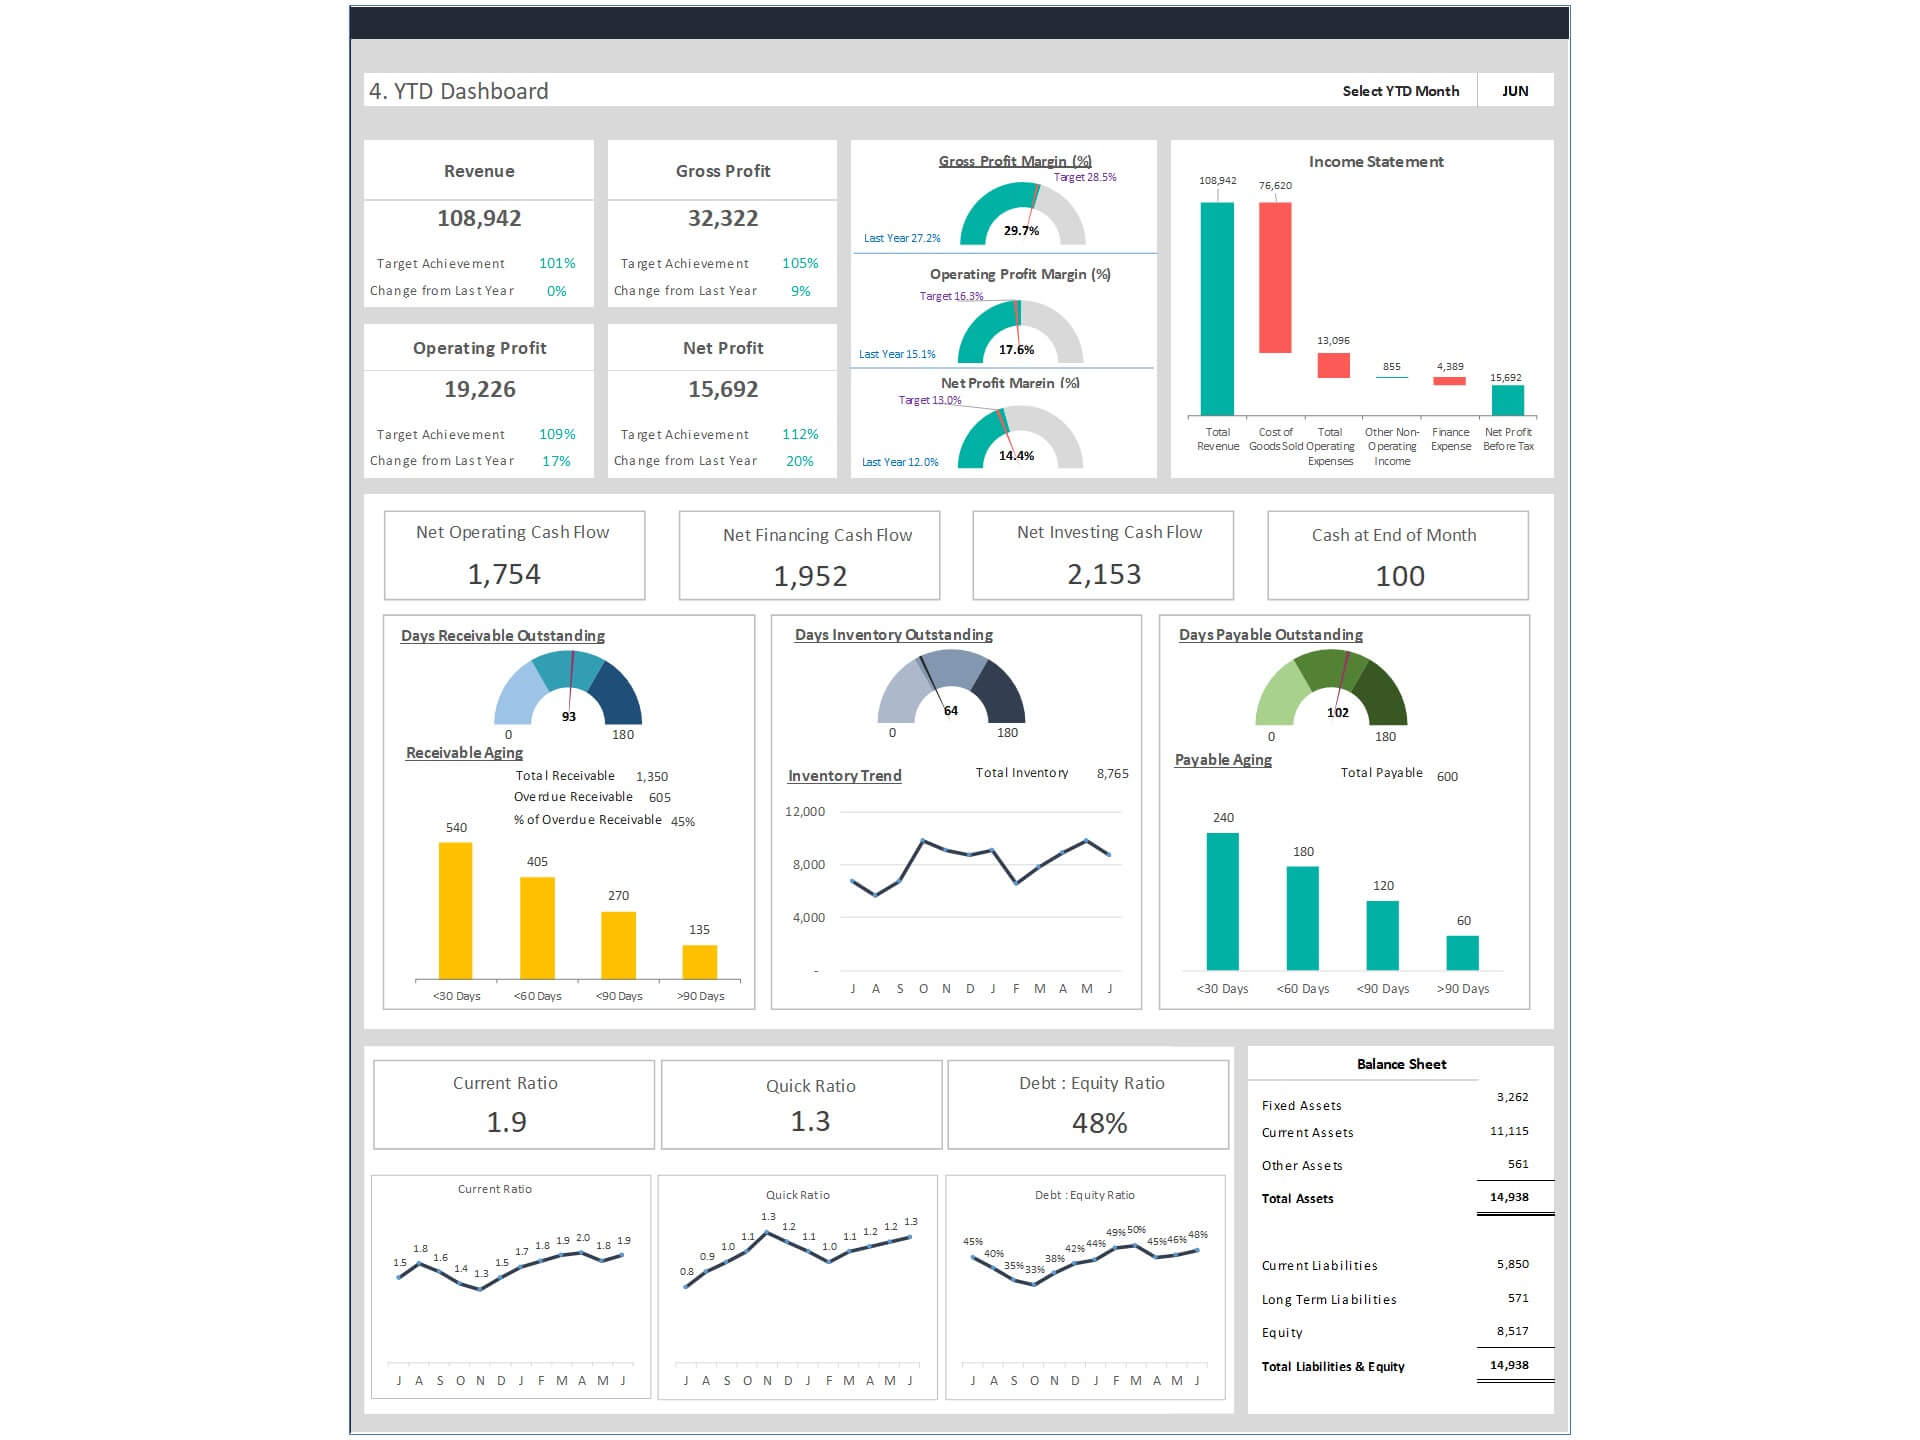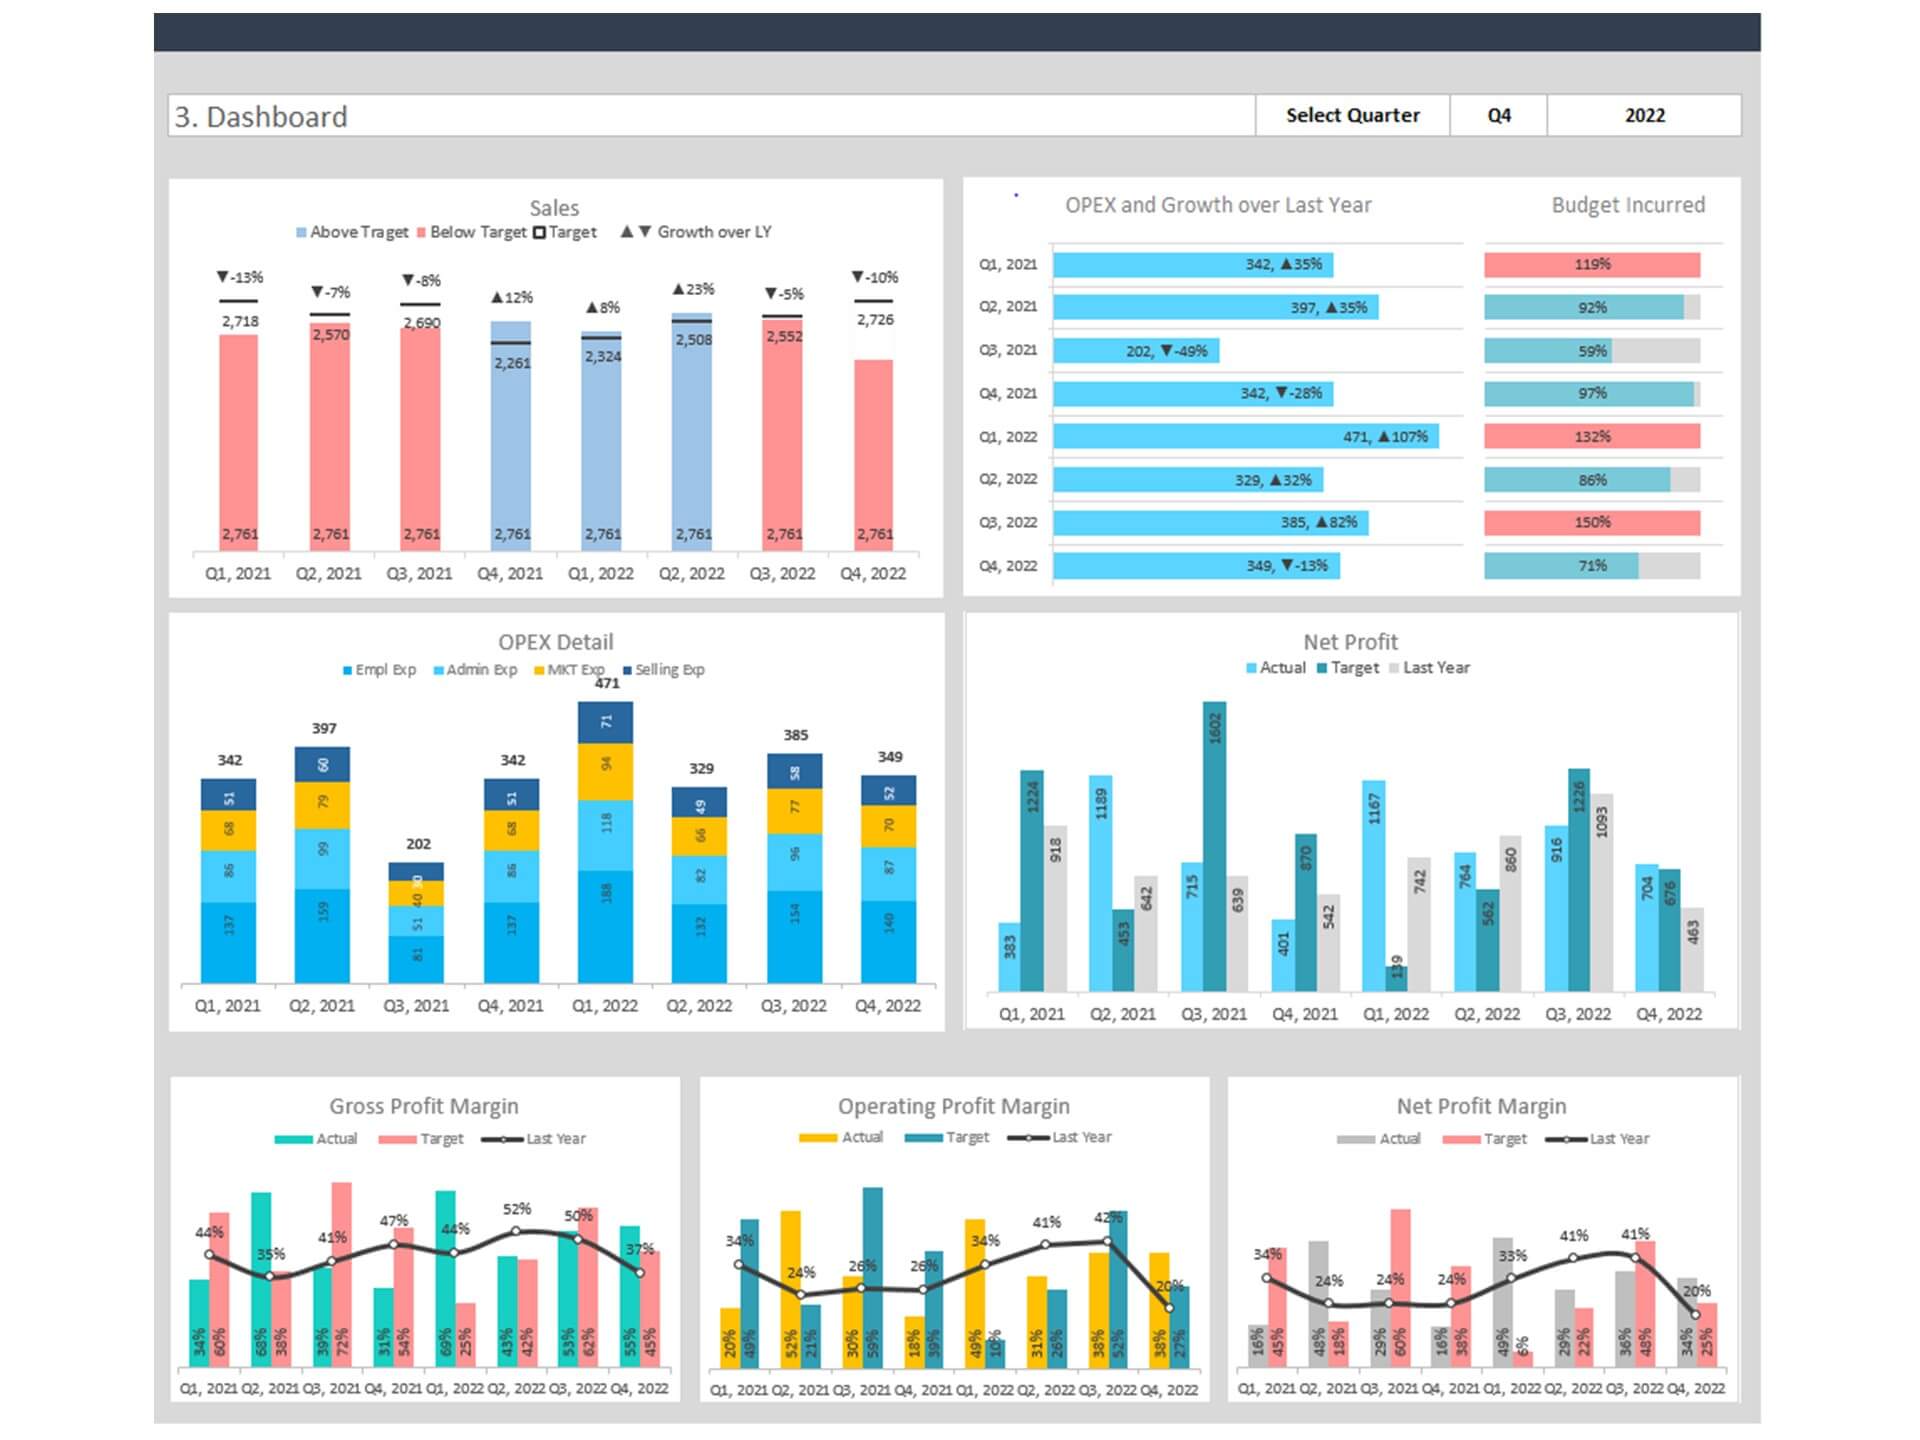
30 CFO KPI Dashboard is an Excel Template that will help you properly organize major financial indicators in single view and present the most important financial information to your team in a simple and beautiful way. The major responsibilities of the Chief Financial Officer (CFO) are to improve the financial health of an organization including compliant reporting, liquidity, and return on investment.
The objective of the CFO KPI Dashboard is to give CFOs at-a-glance clear picture into financial performance across the organization. The CFO is responsible for every aspect of finance from profitability, cash flow, leverage, working capital, and financing. To gain a wider vision, the CFO needs to embrace the power of digital data with the right tools like a professionally designed CFO Dashboard.
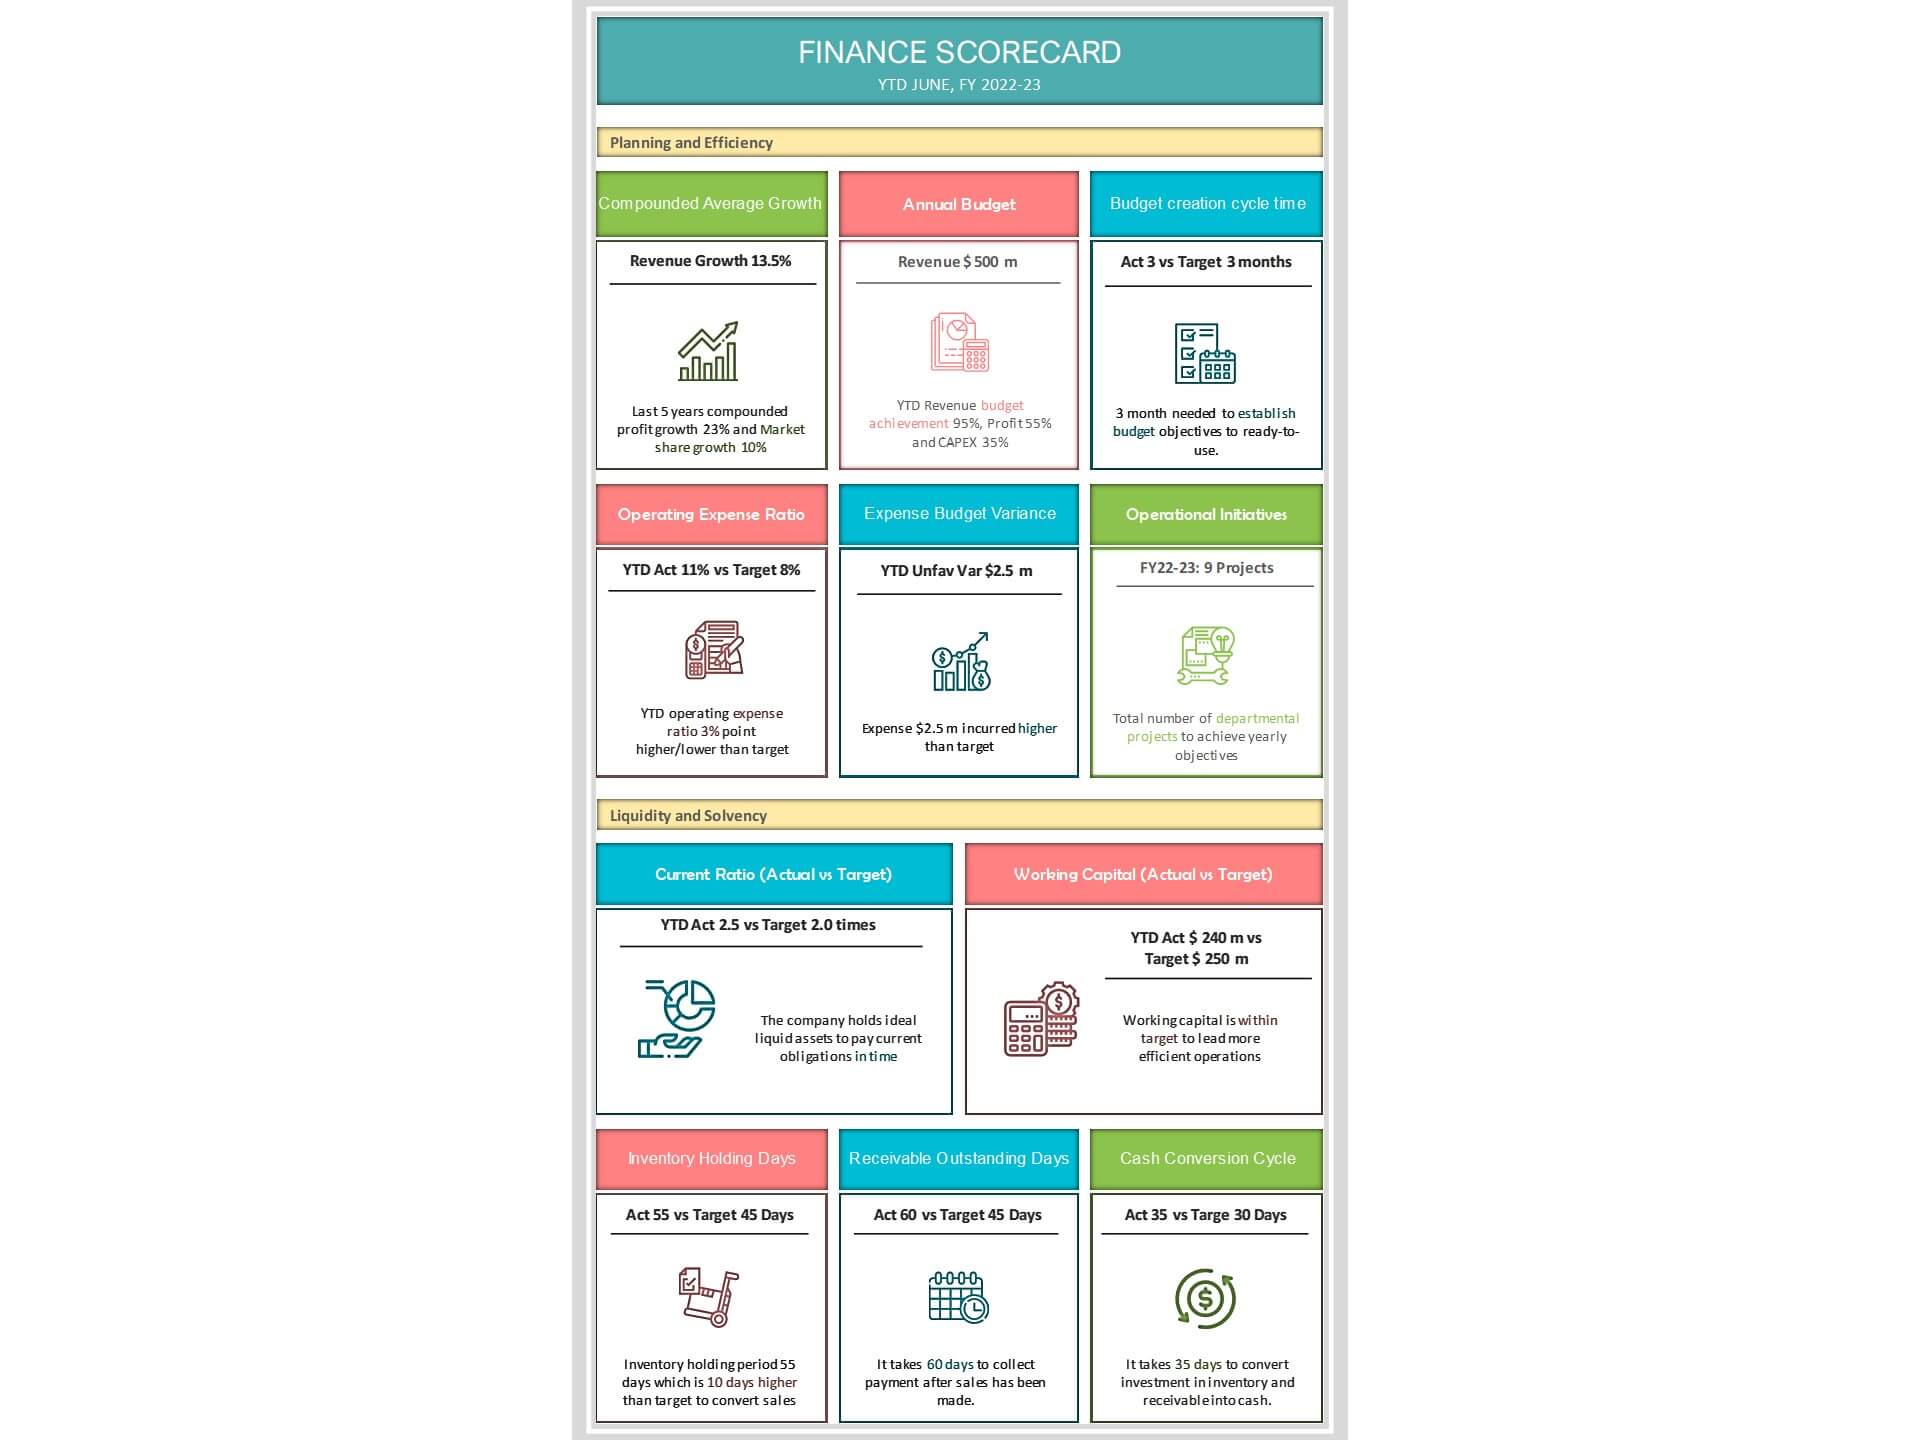
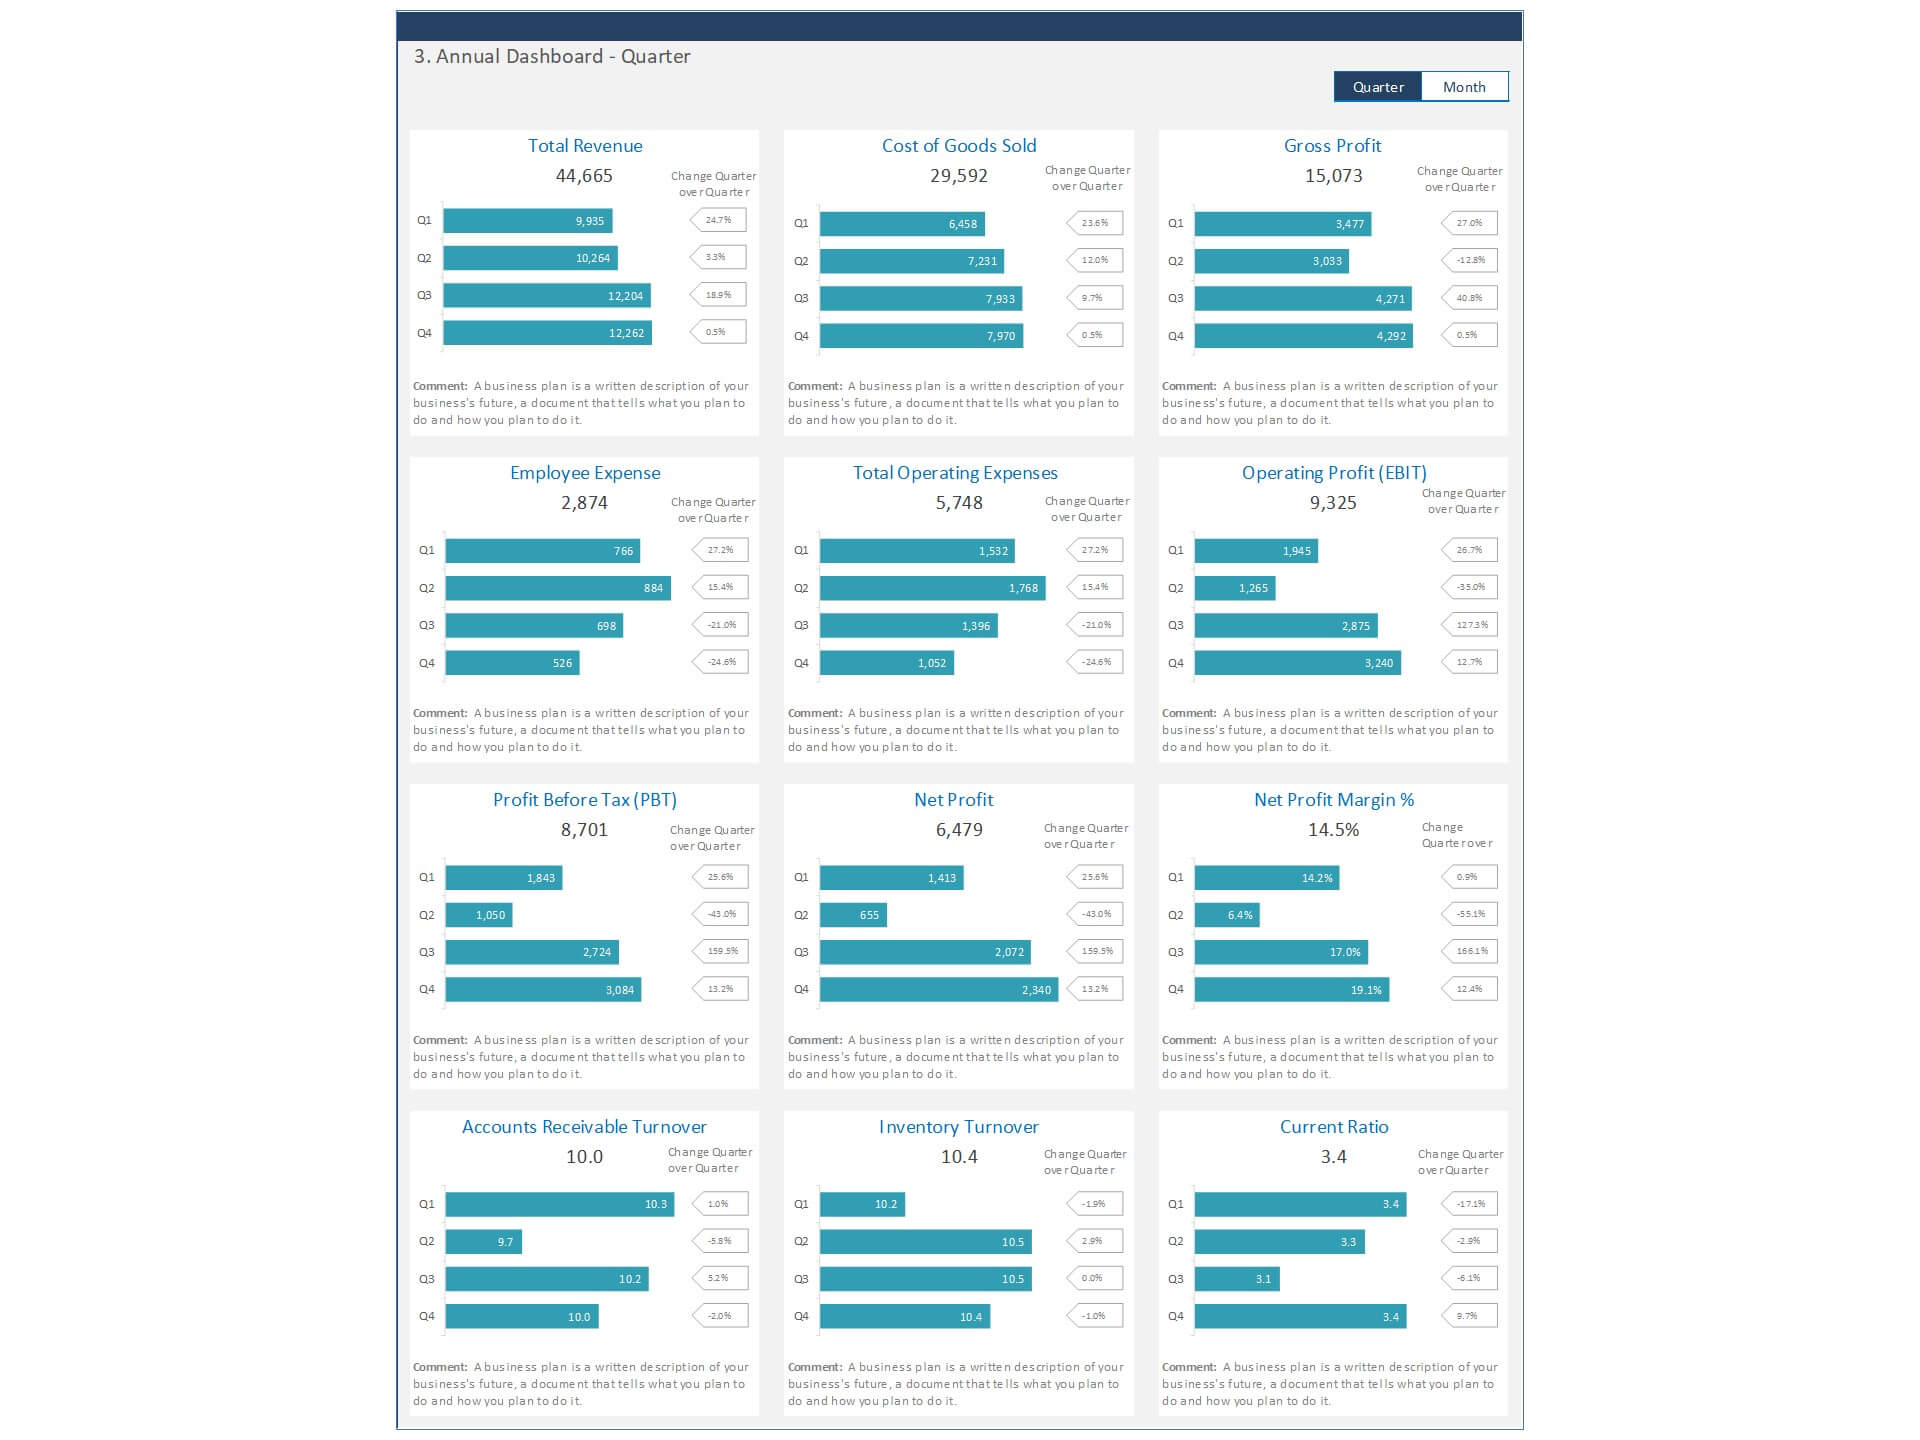
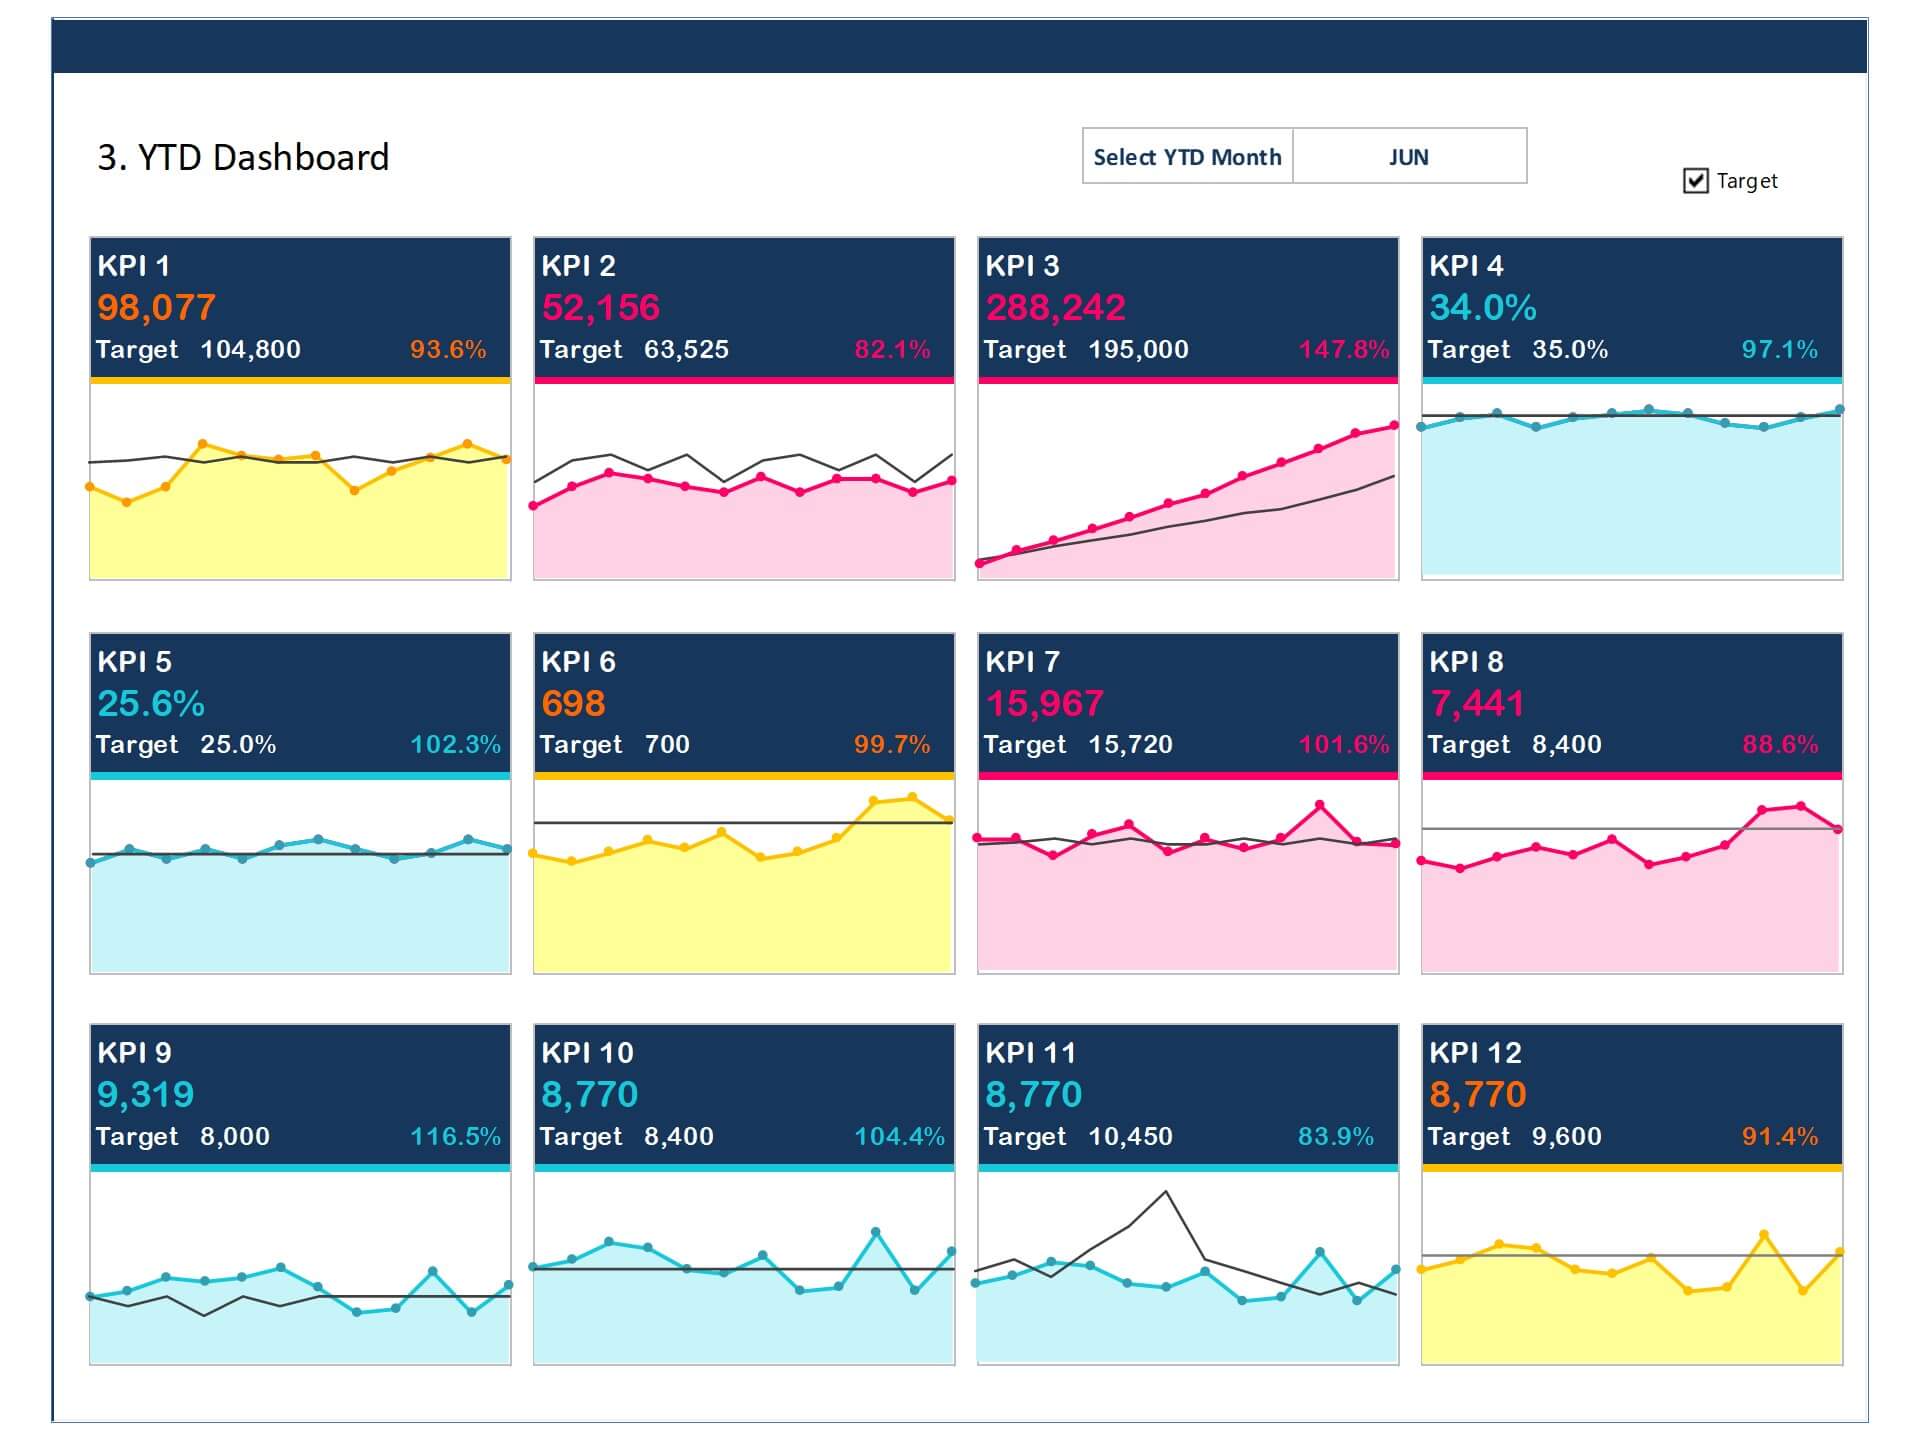
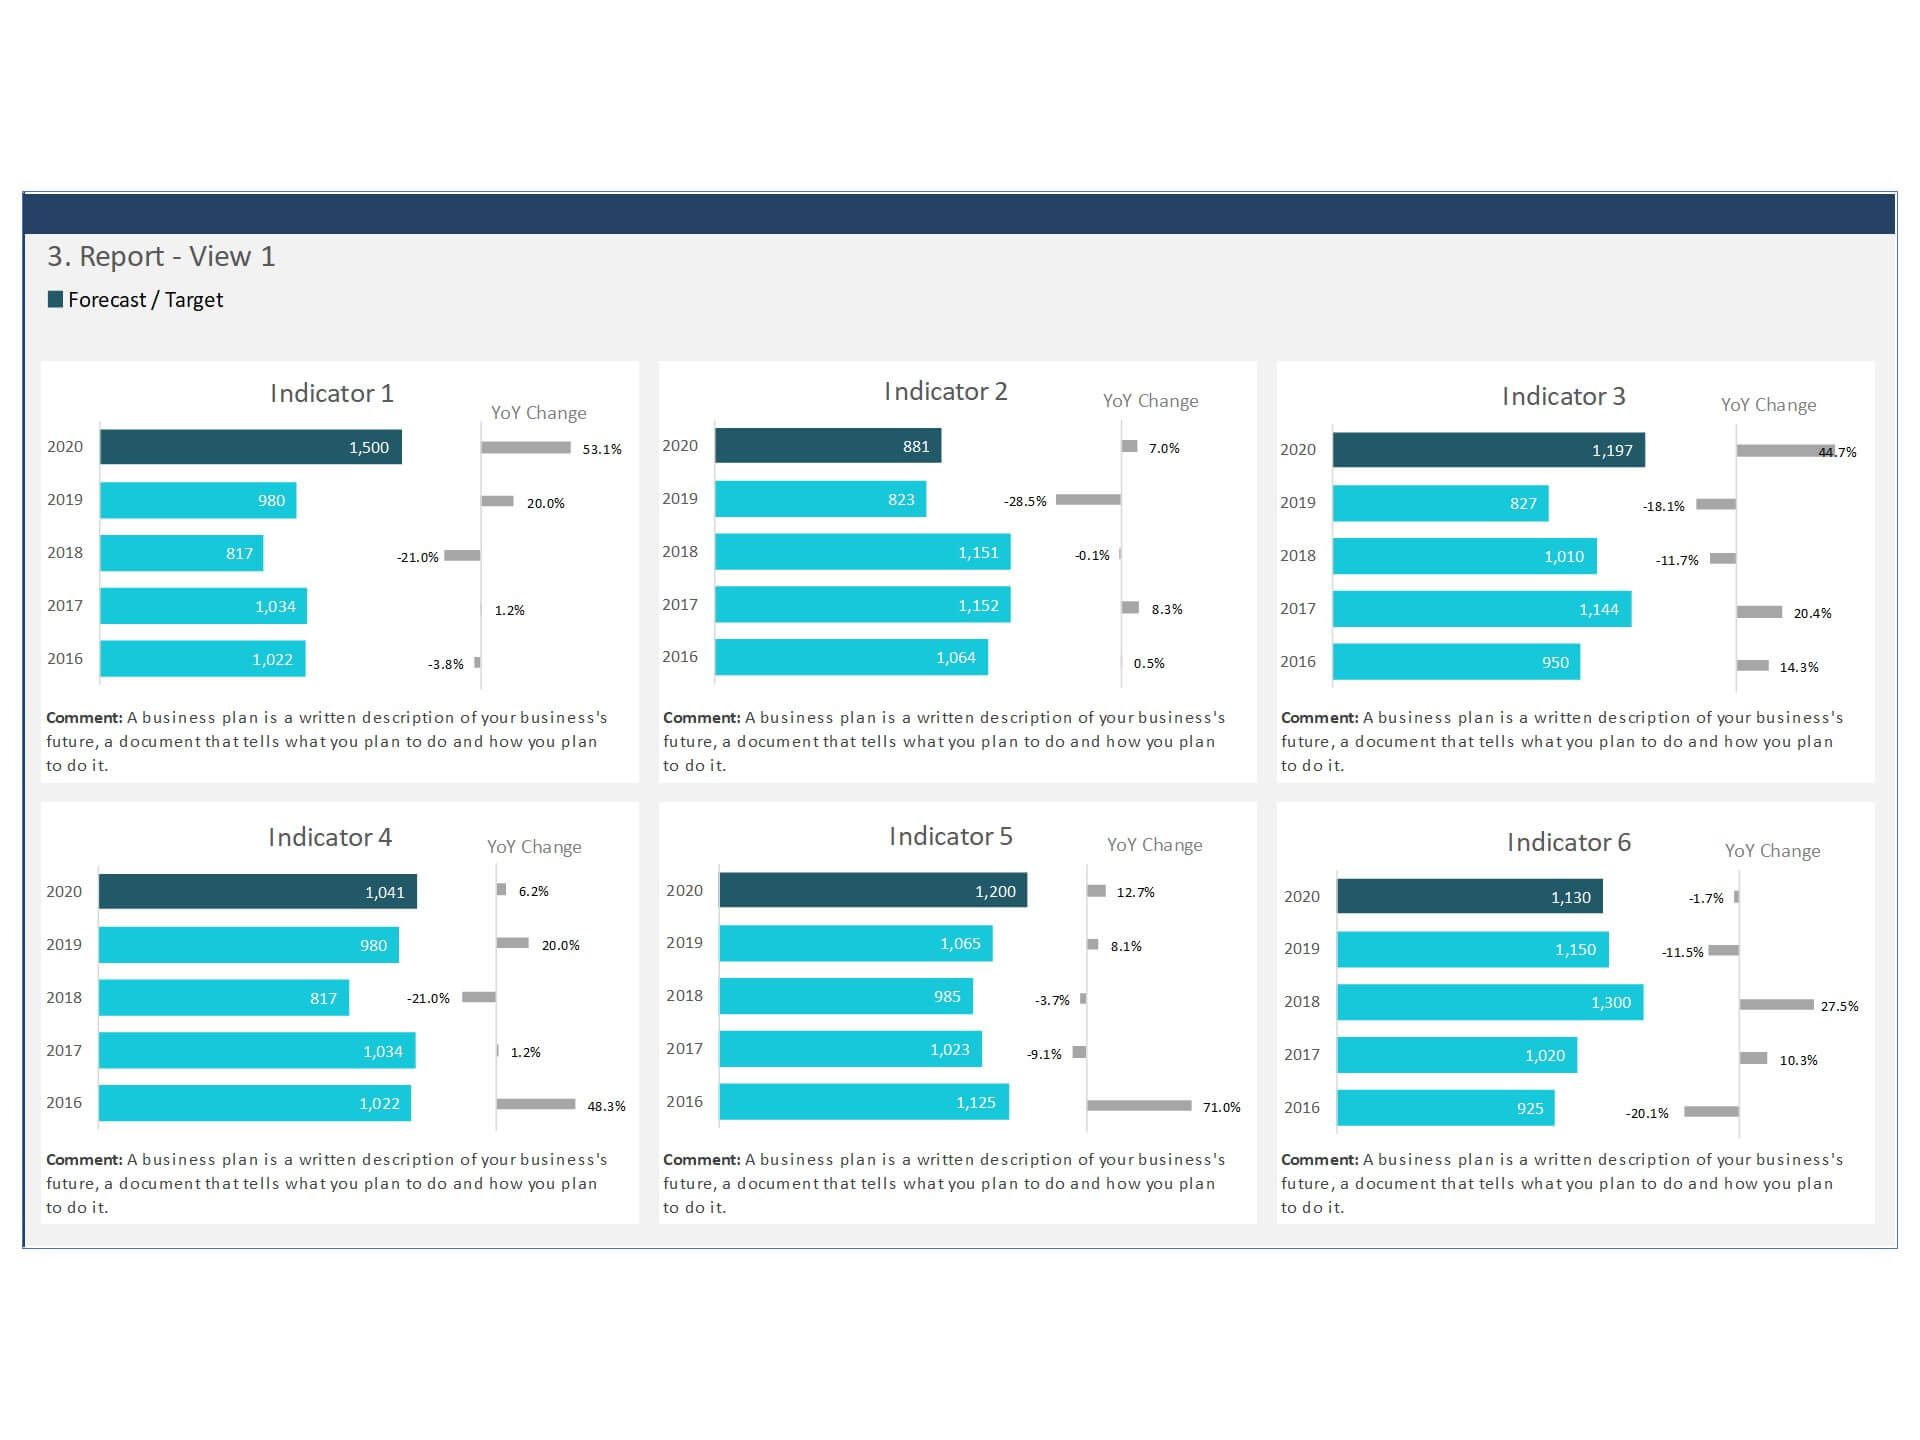
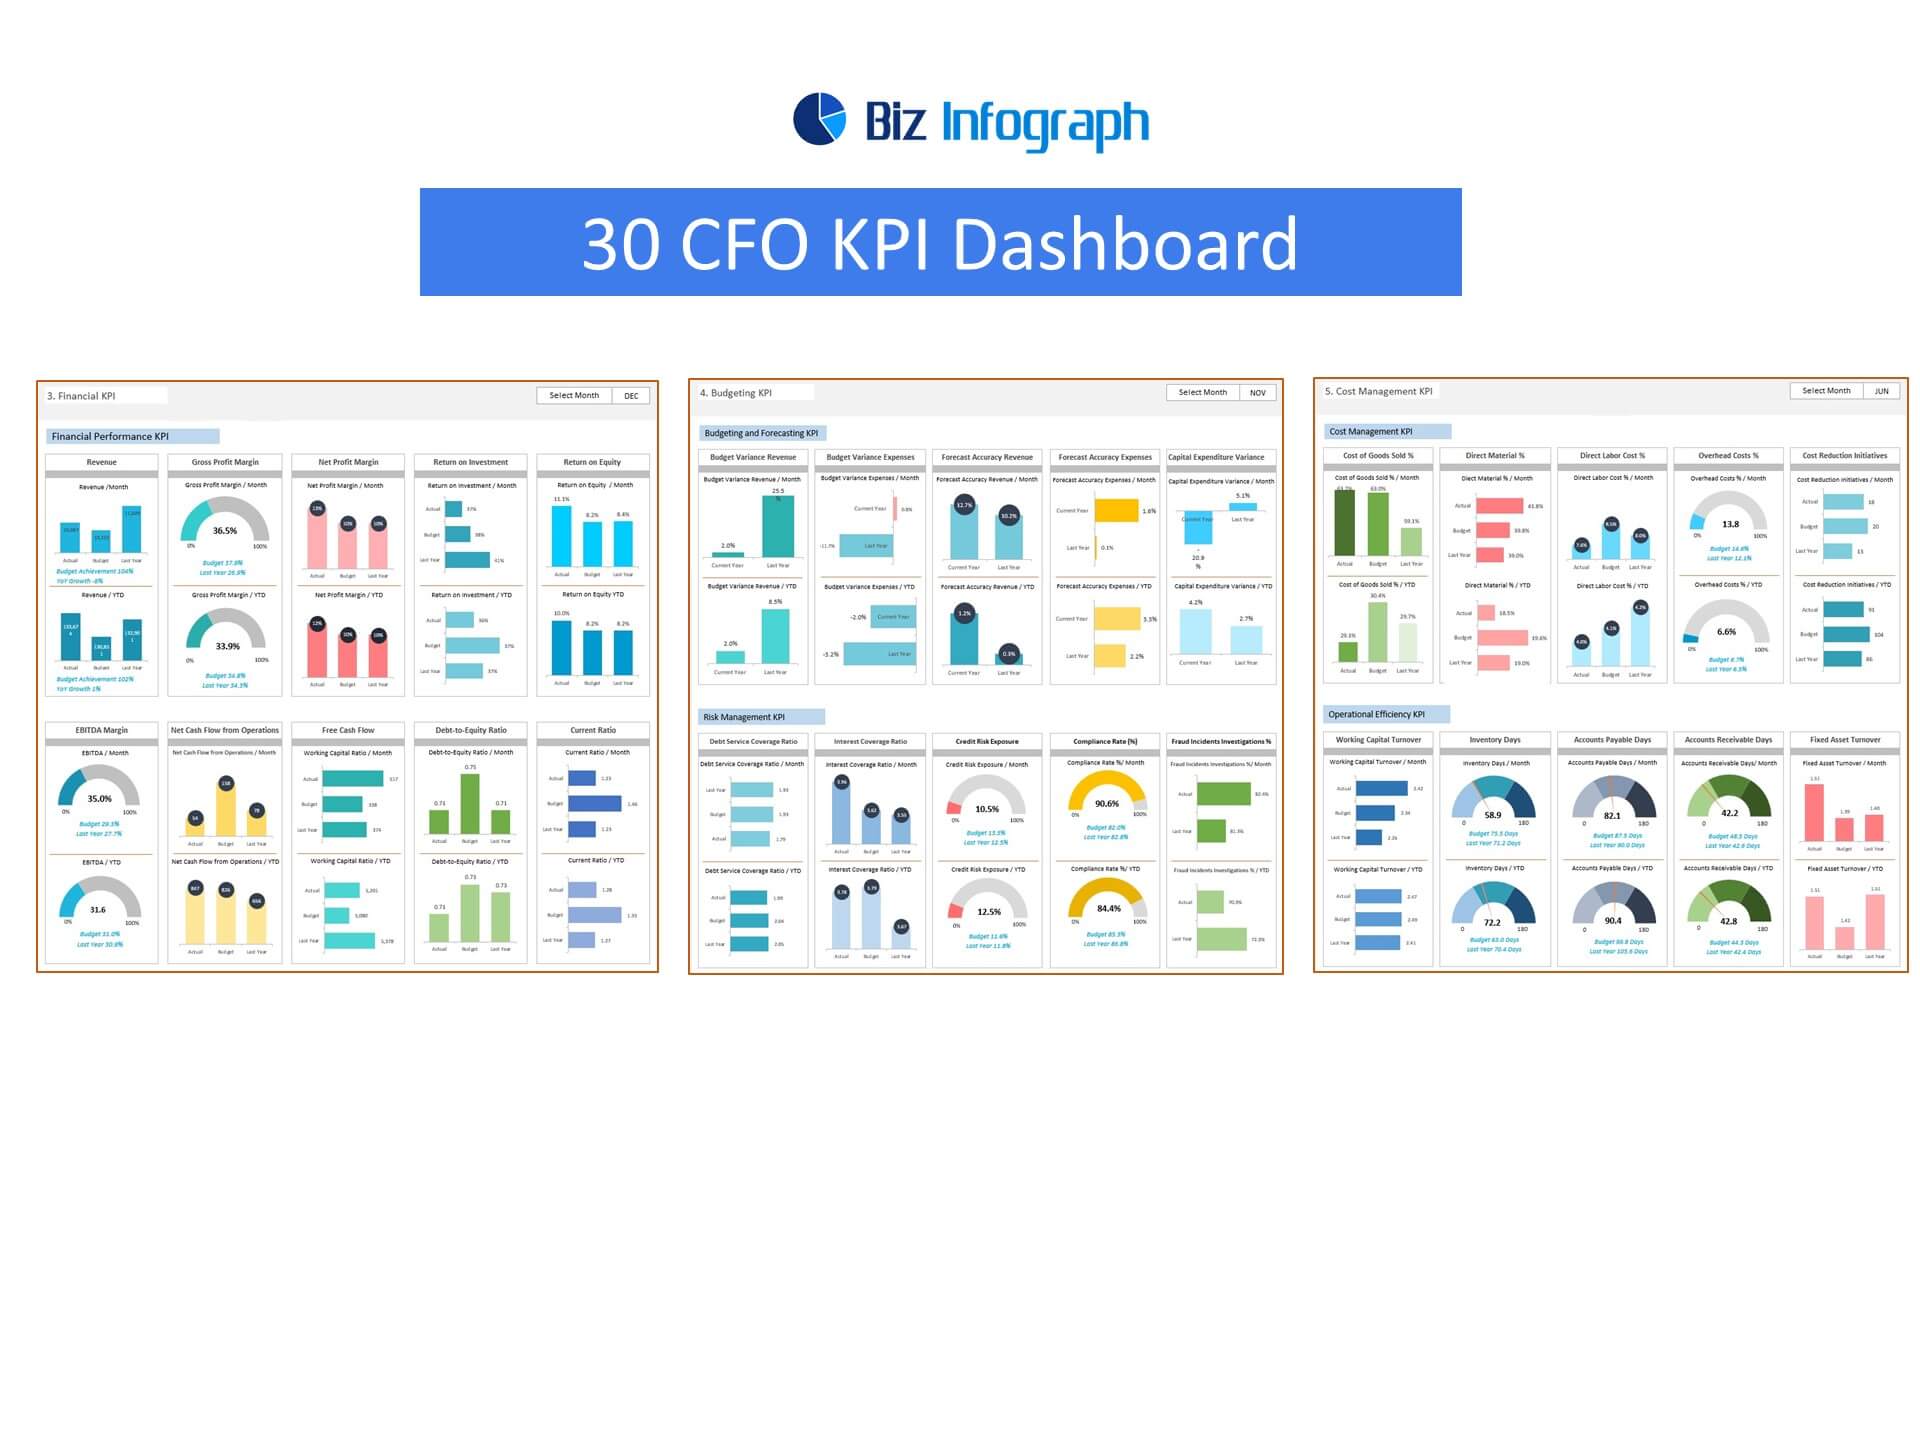
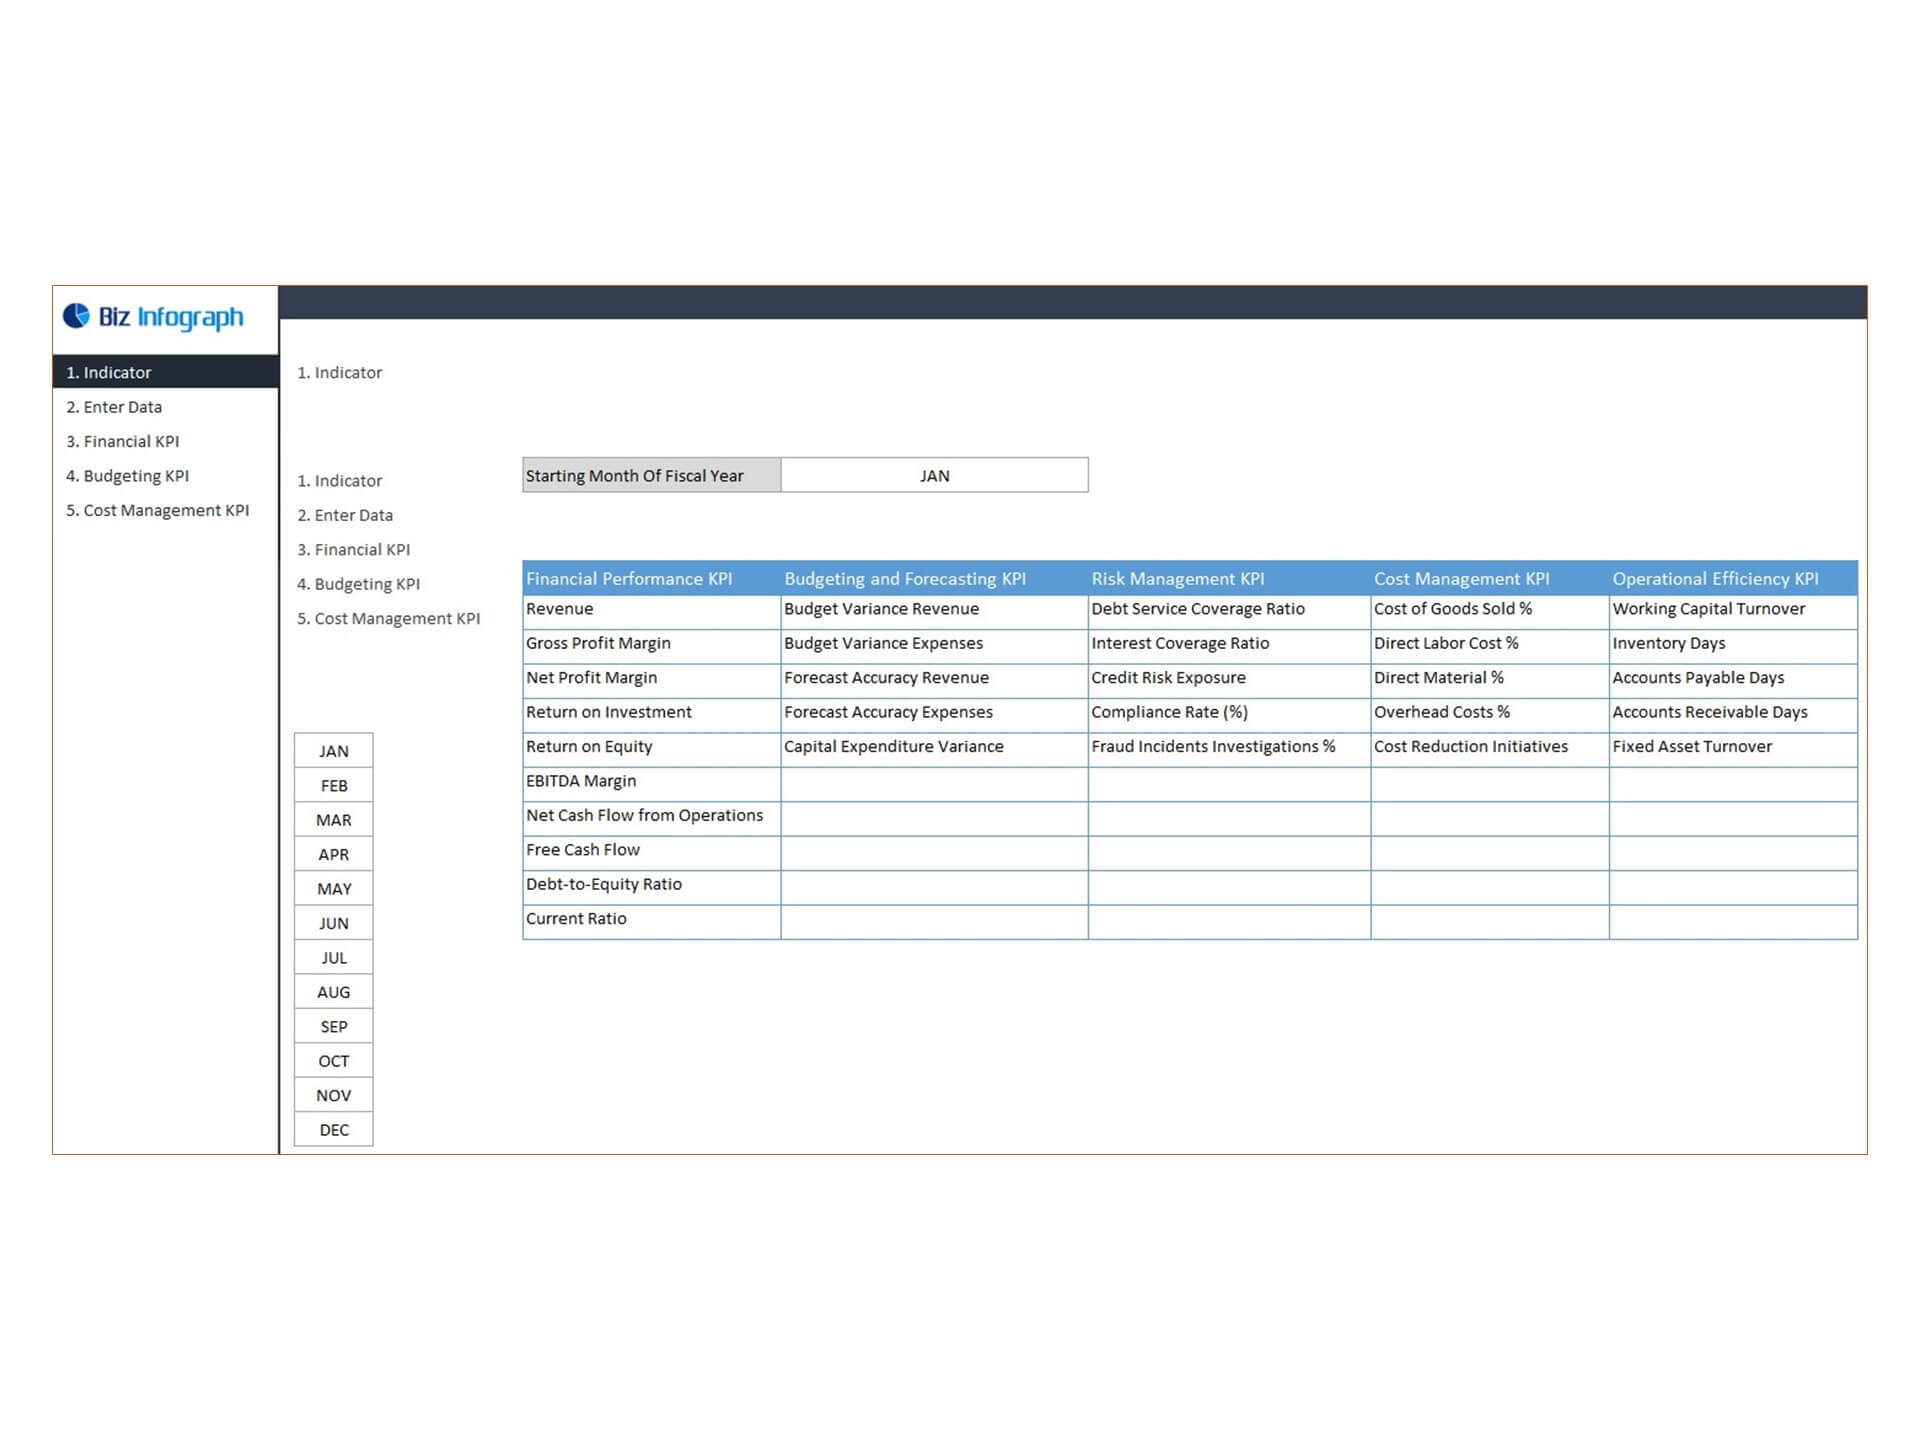
CFO KPI Dashboard helps to enhance the strategical as well as analytical efforts related to major financial aspects of your organization. Major KPIs and metrics covered in CFO Dashboard template:
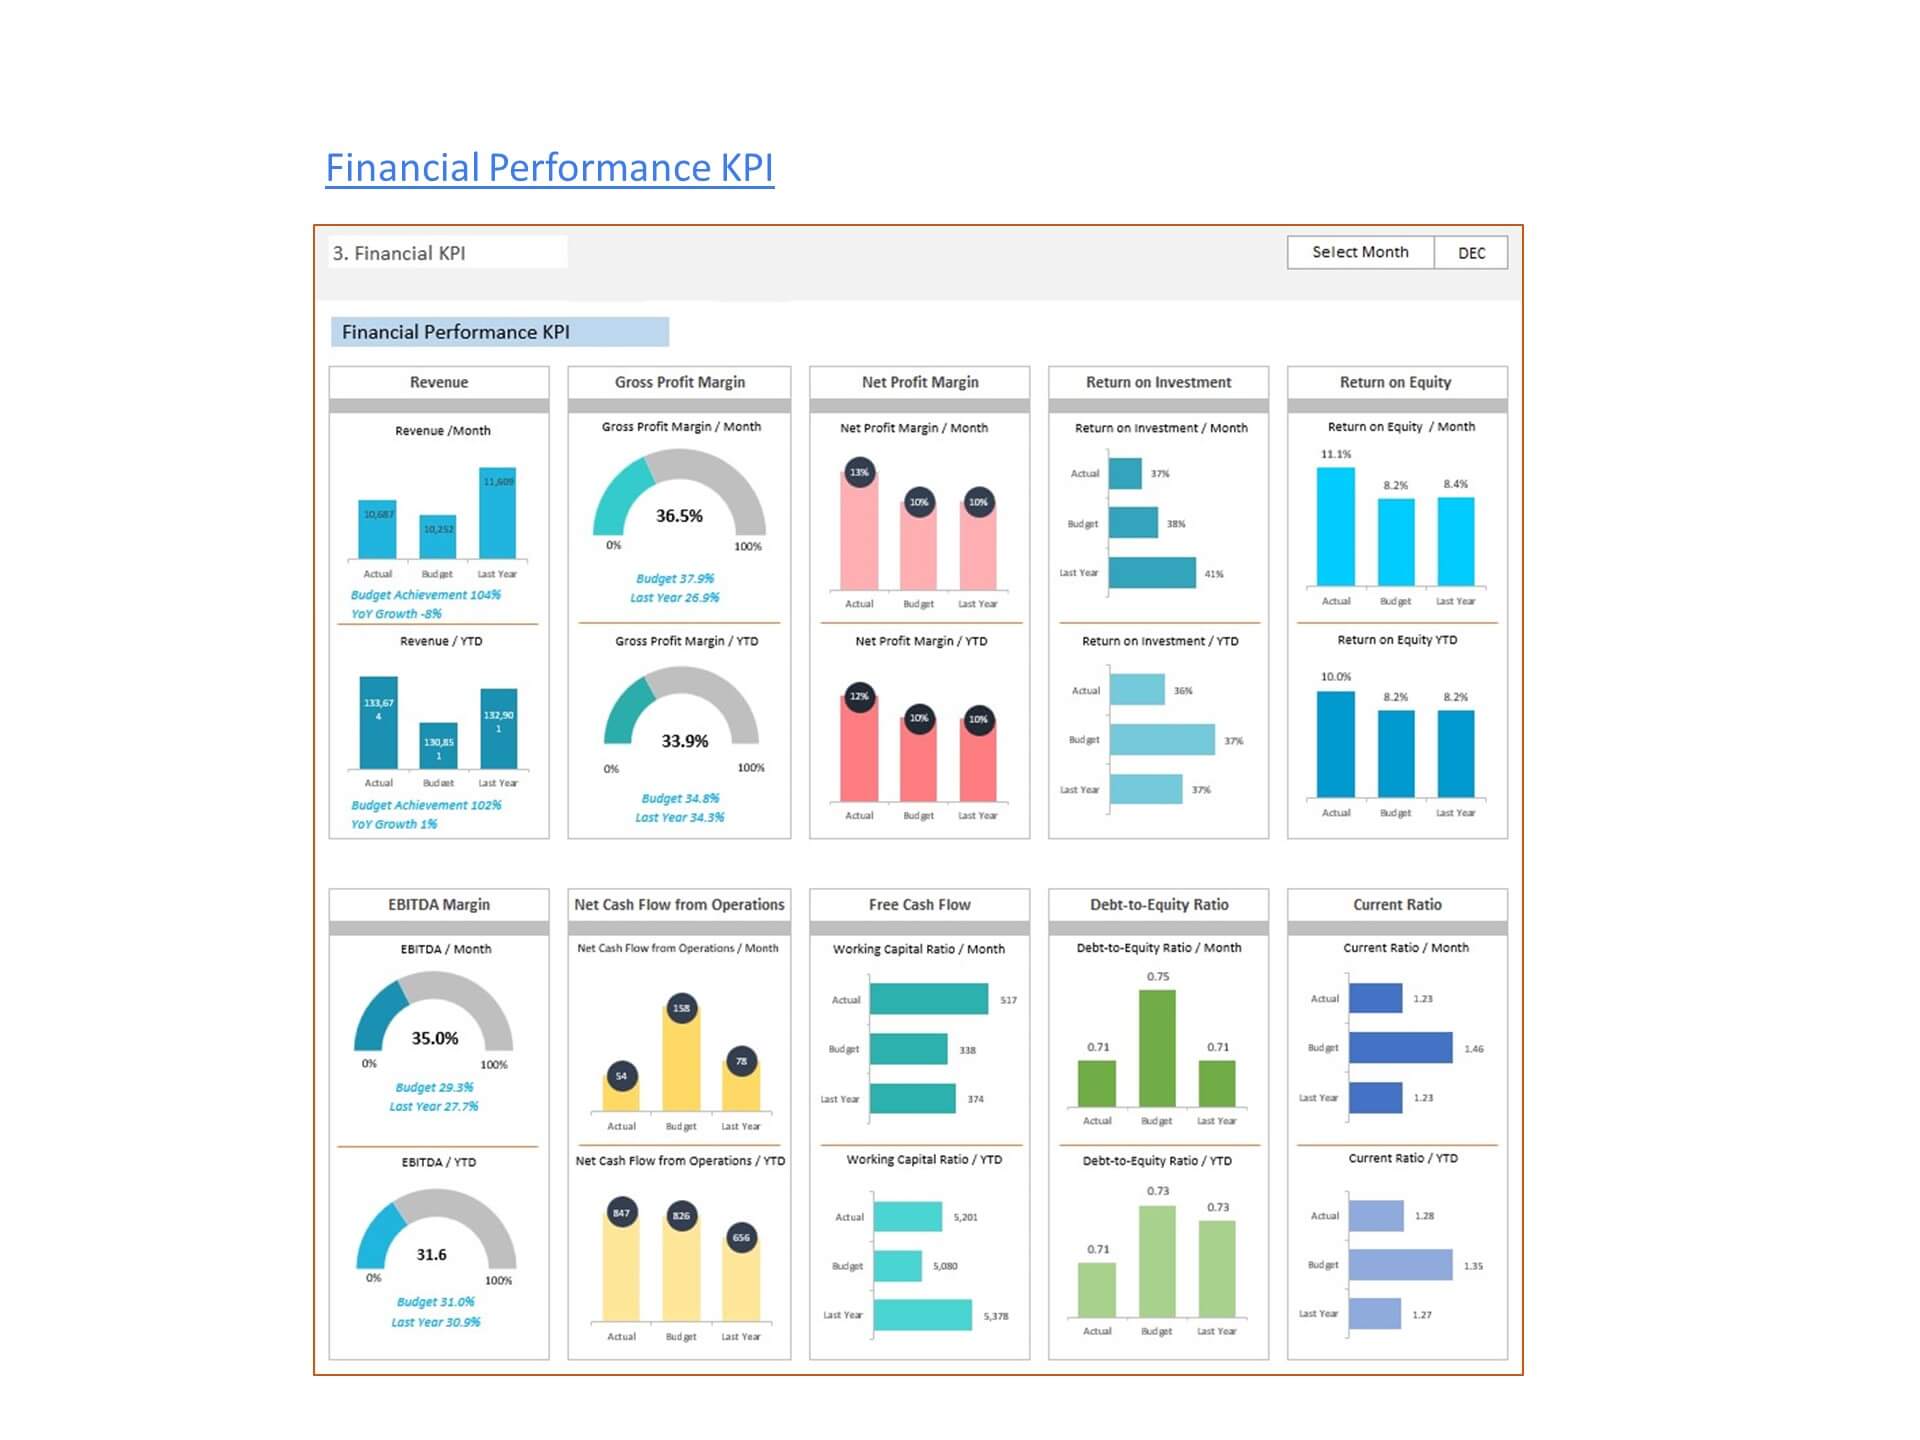
- Financial Performance KPI
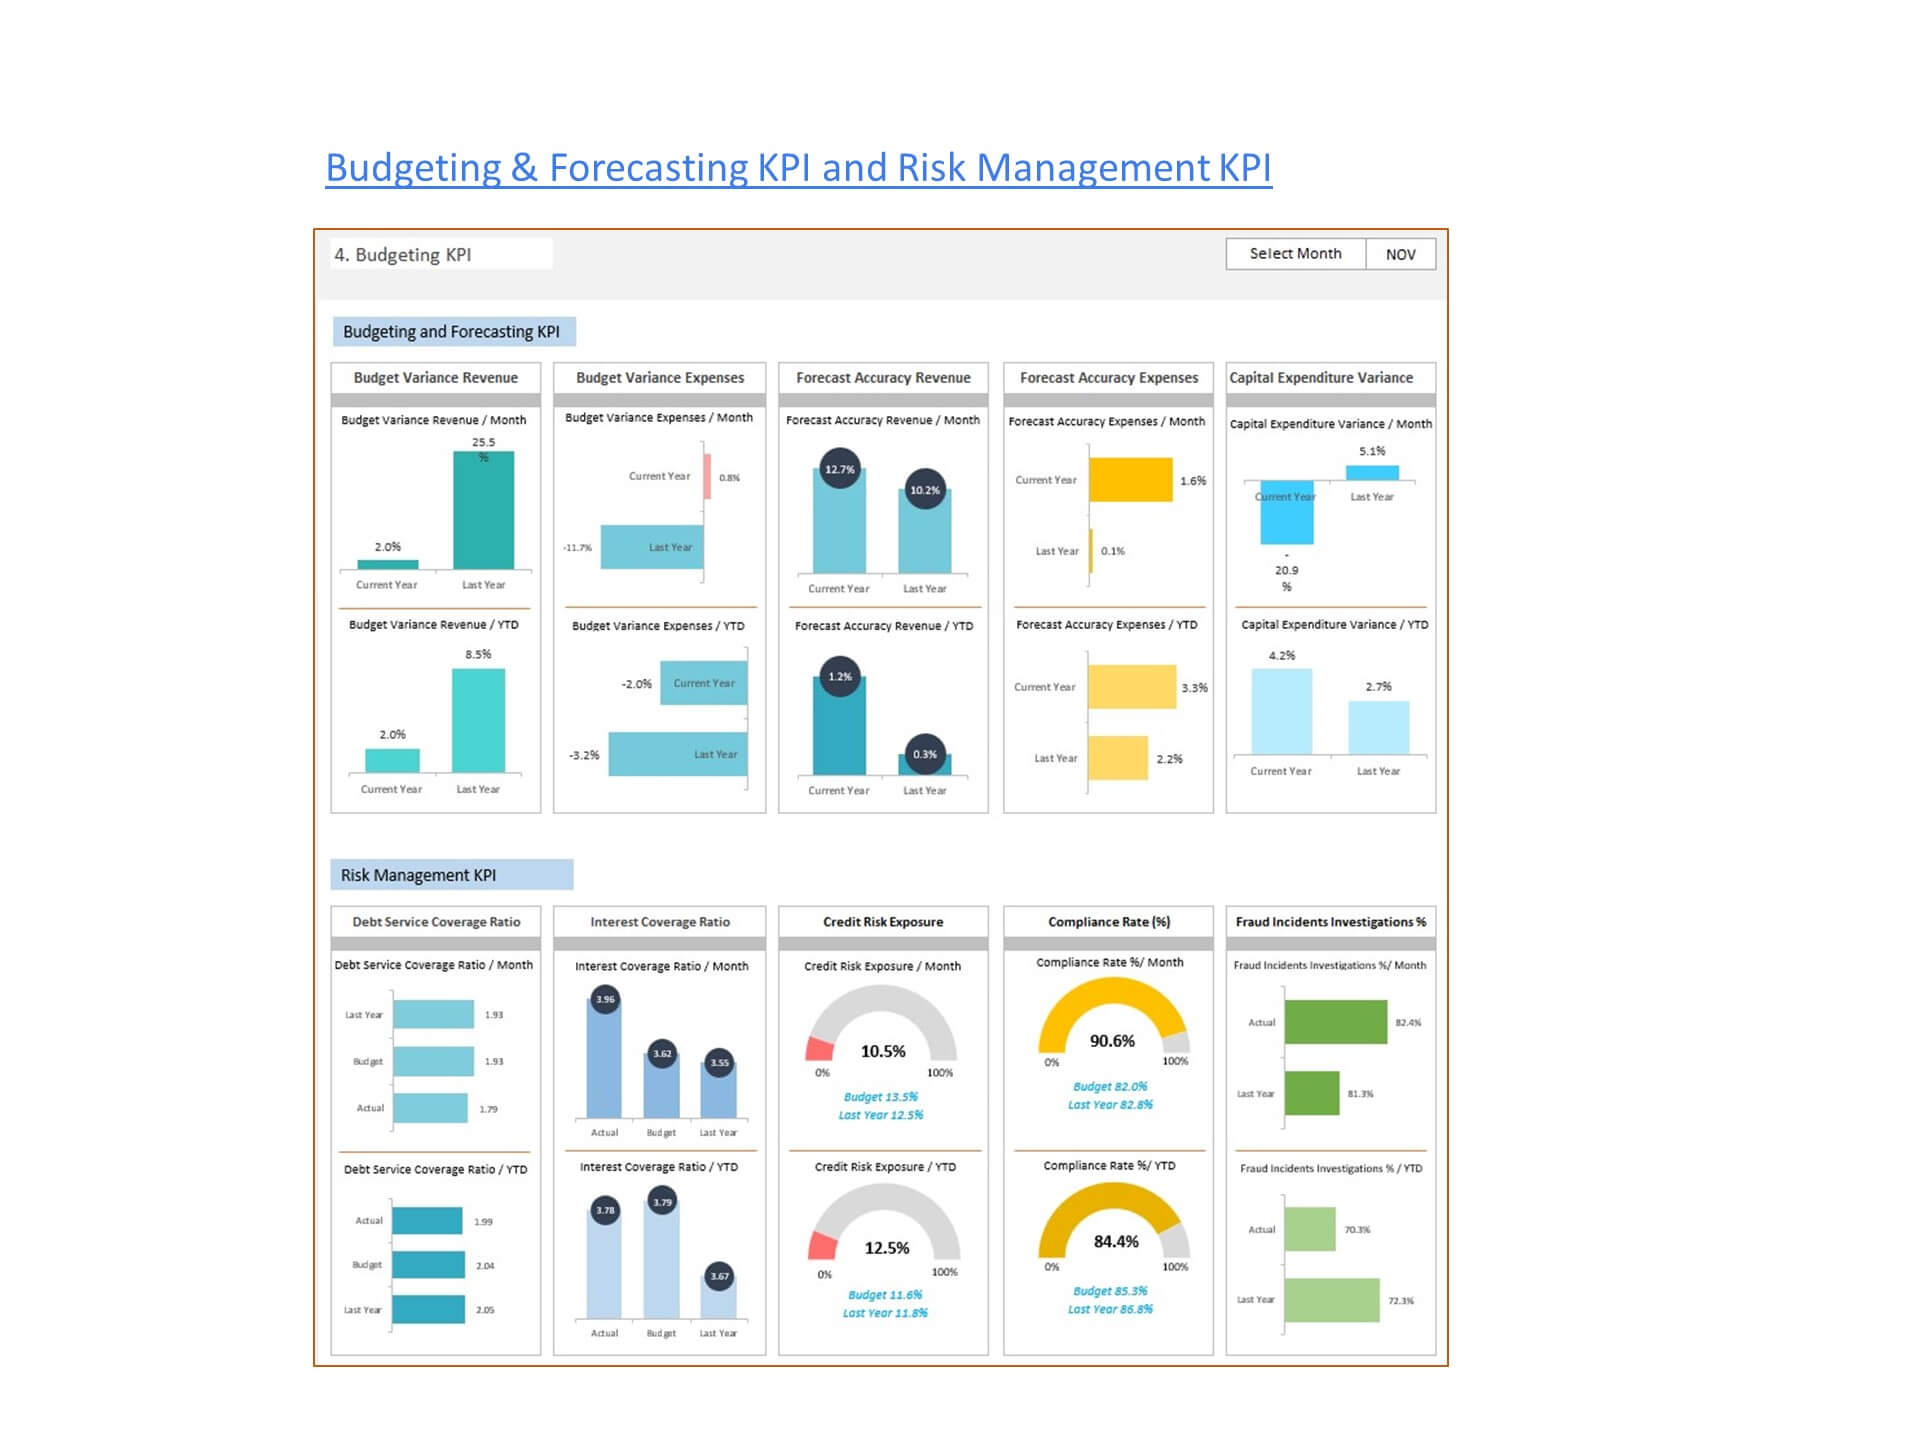
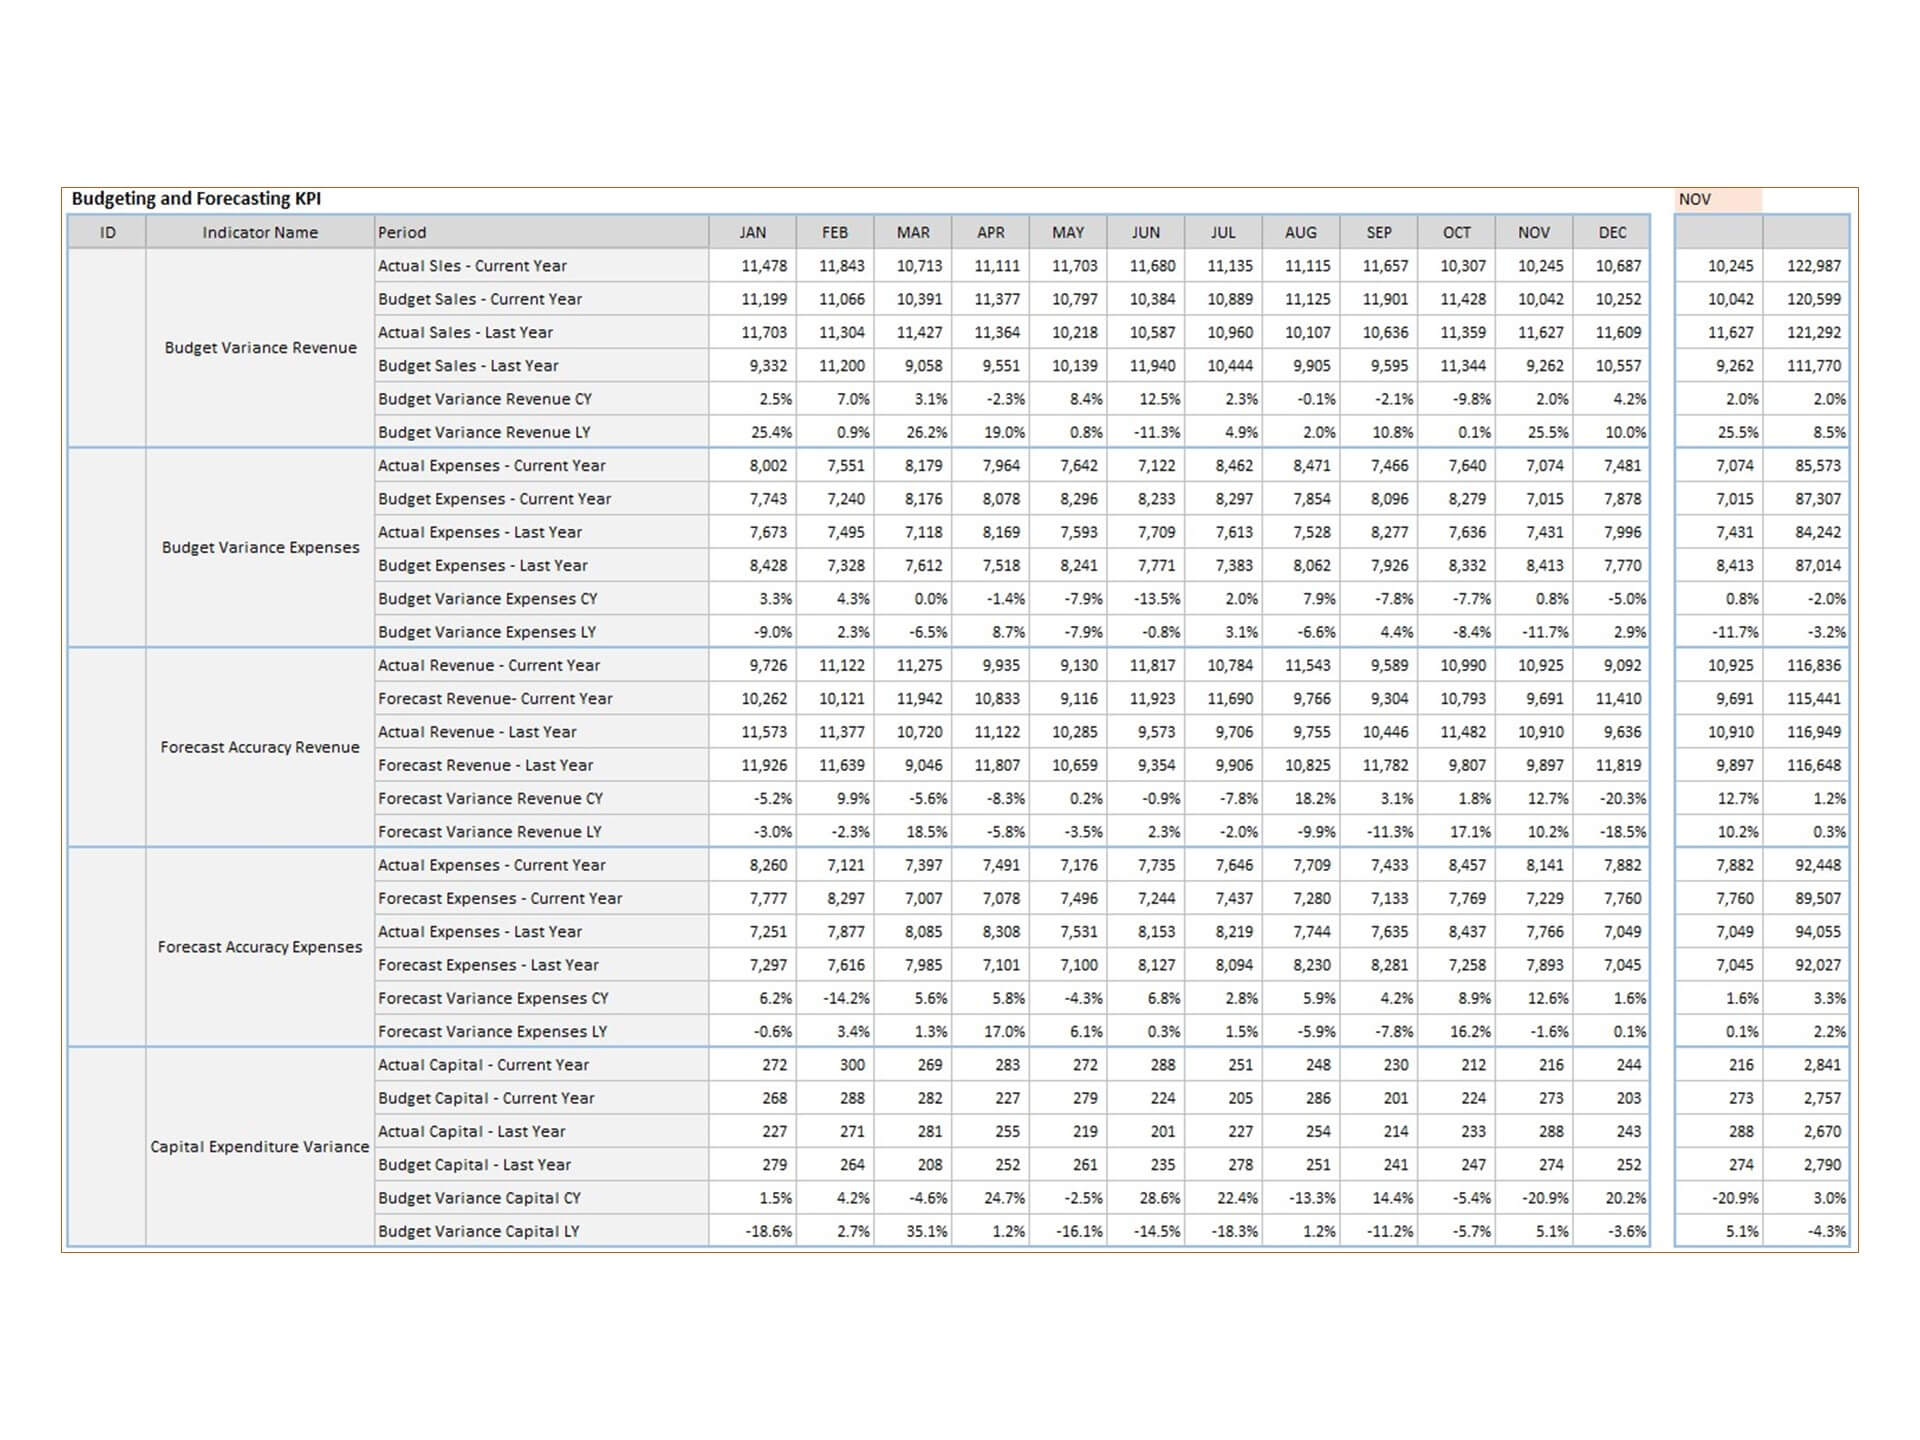
- Budgeting and Forecasting KPI
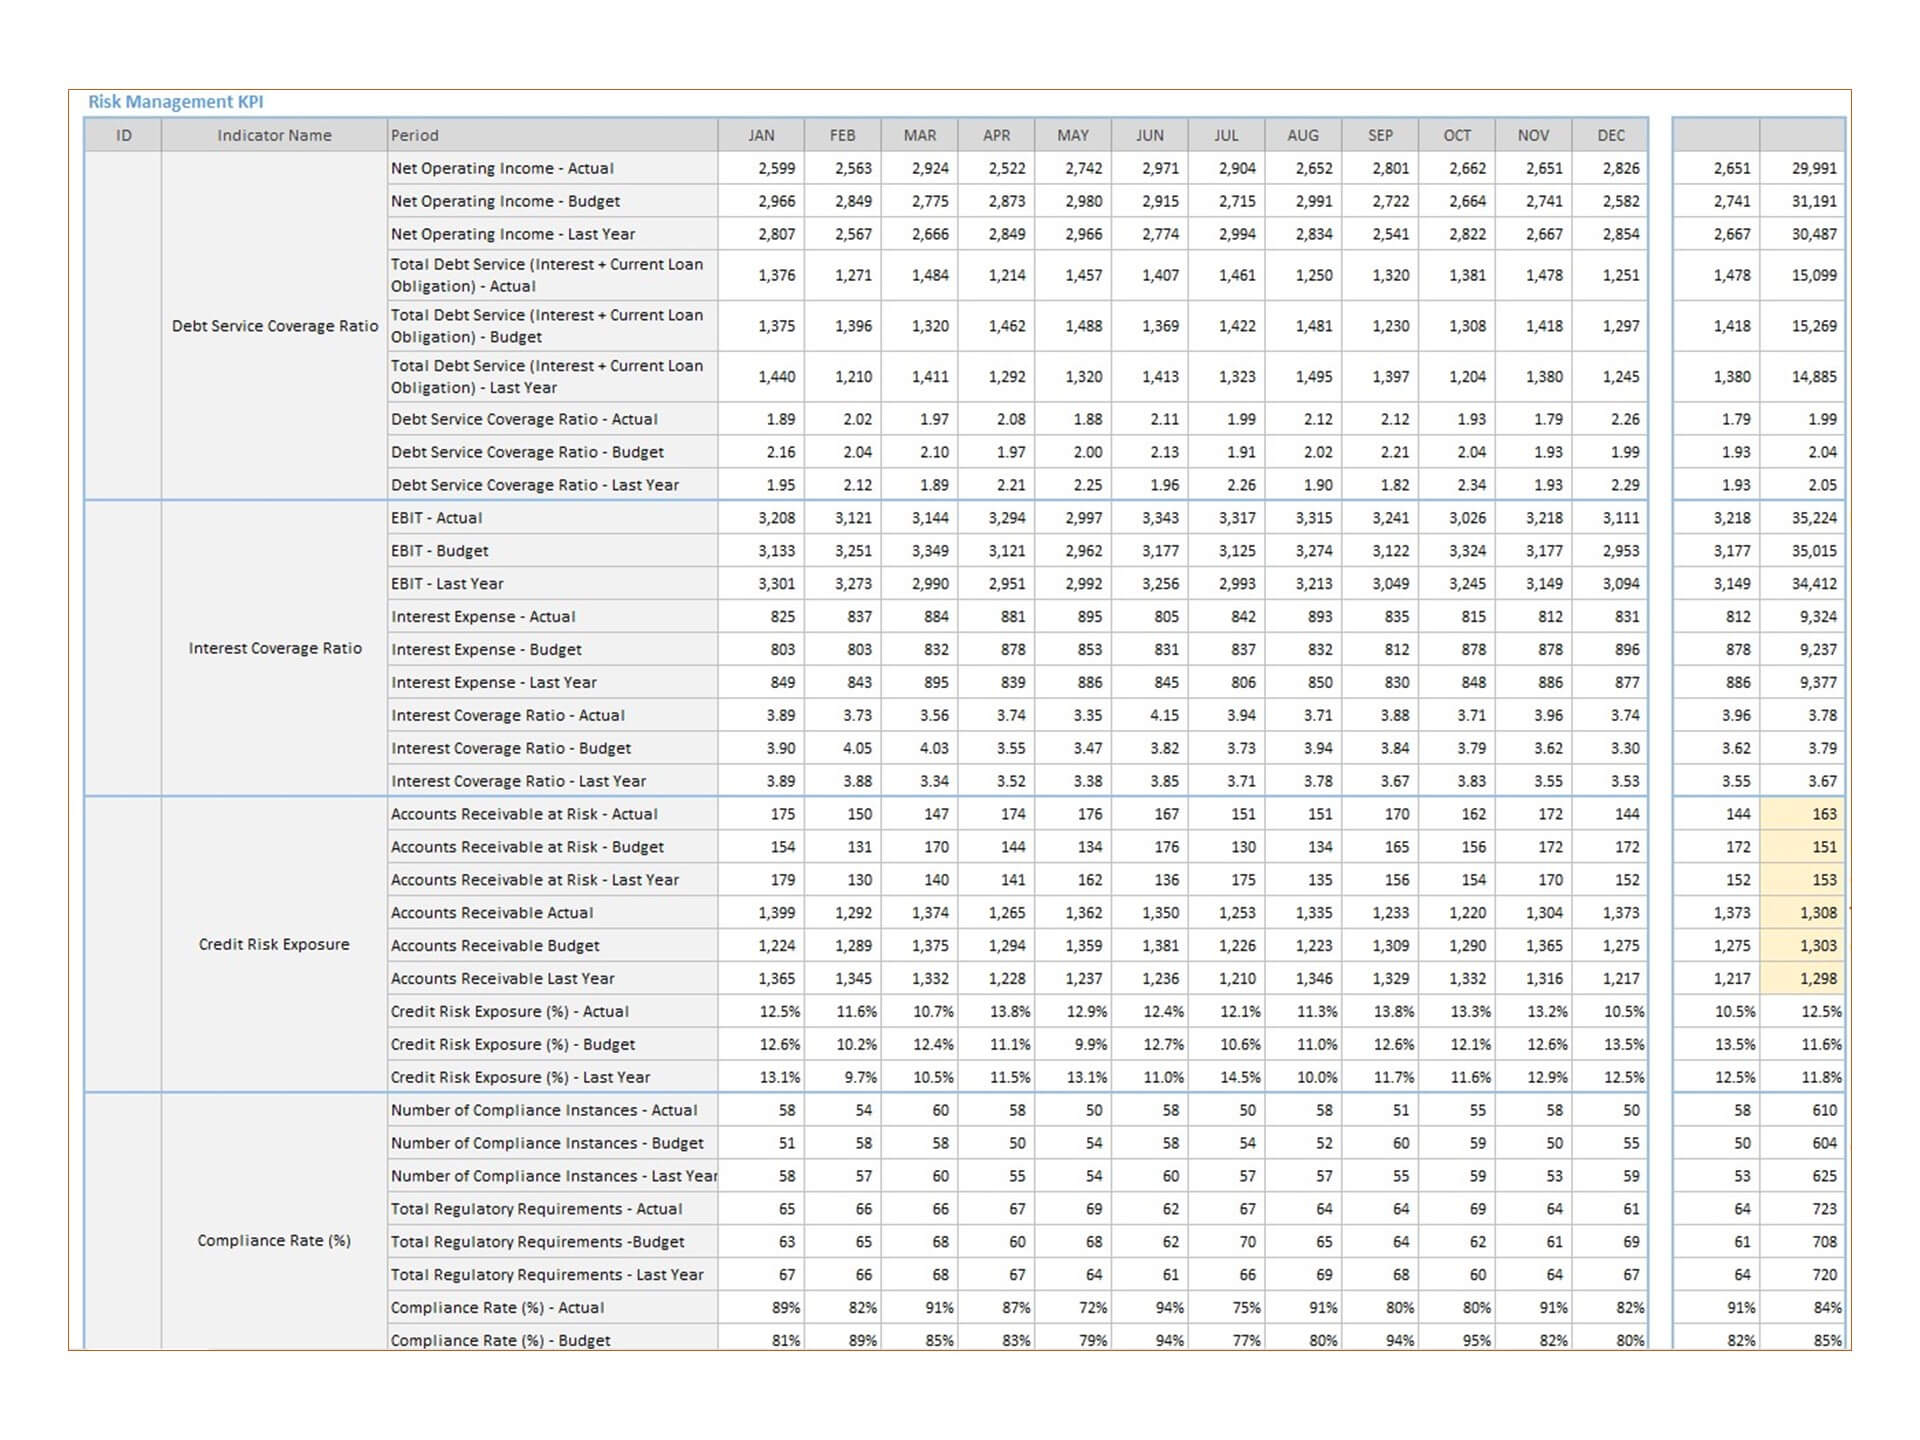
- Risk Management KPI
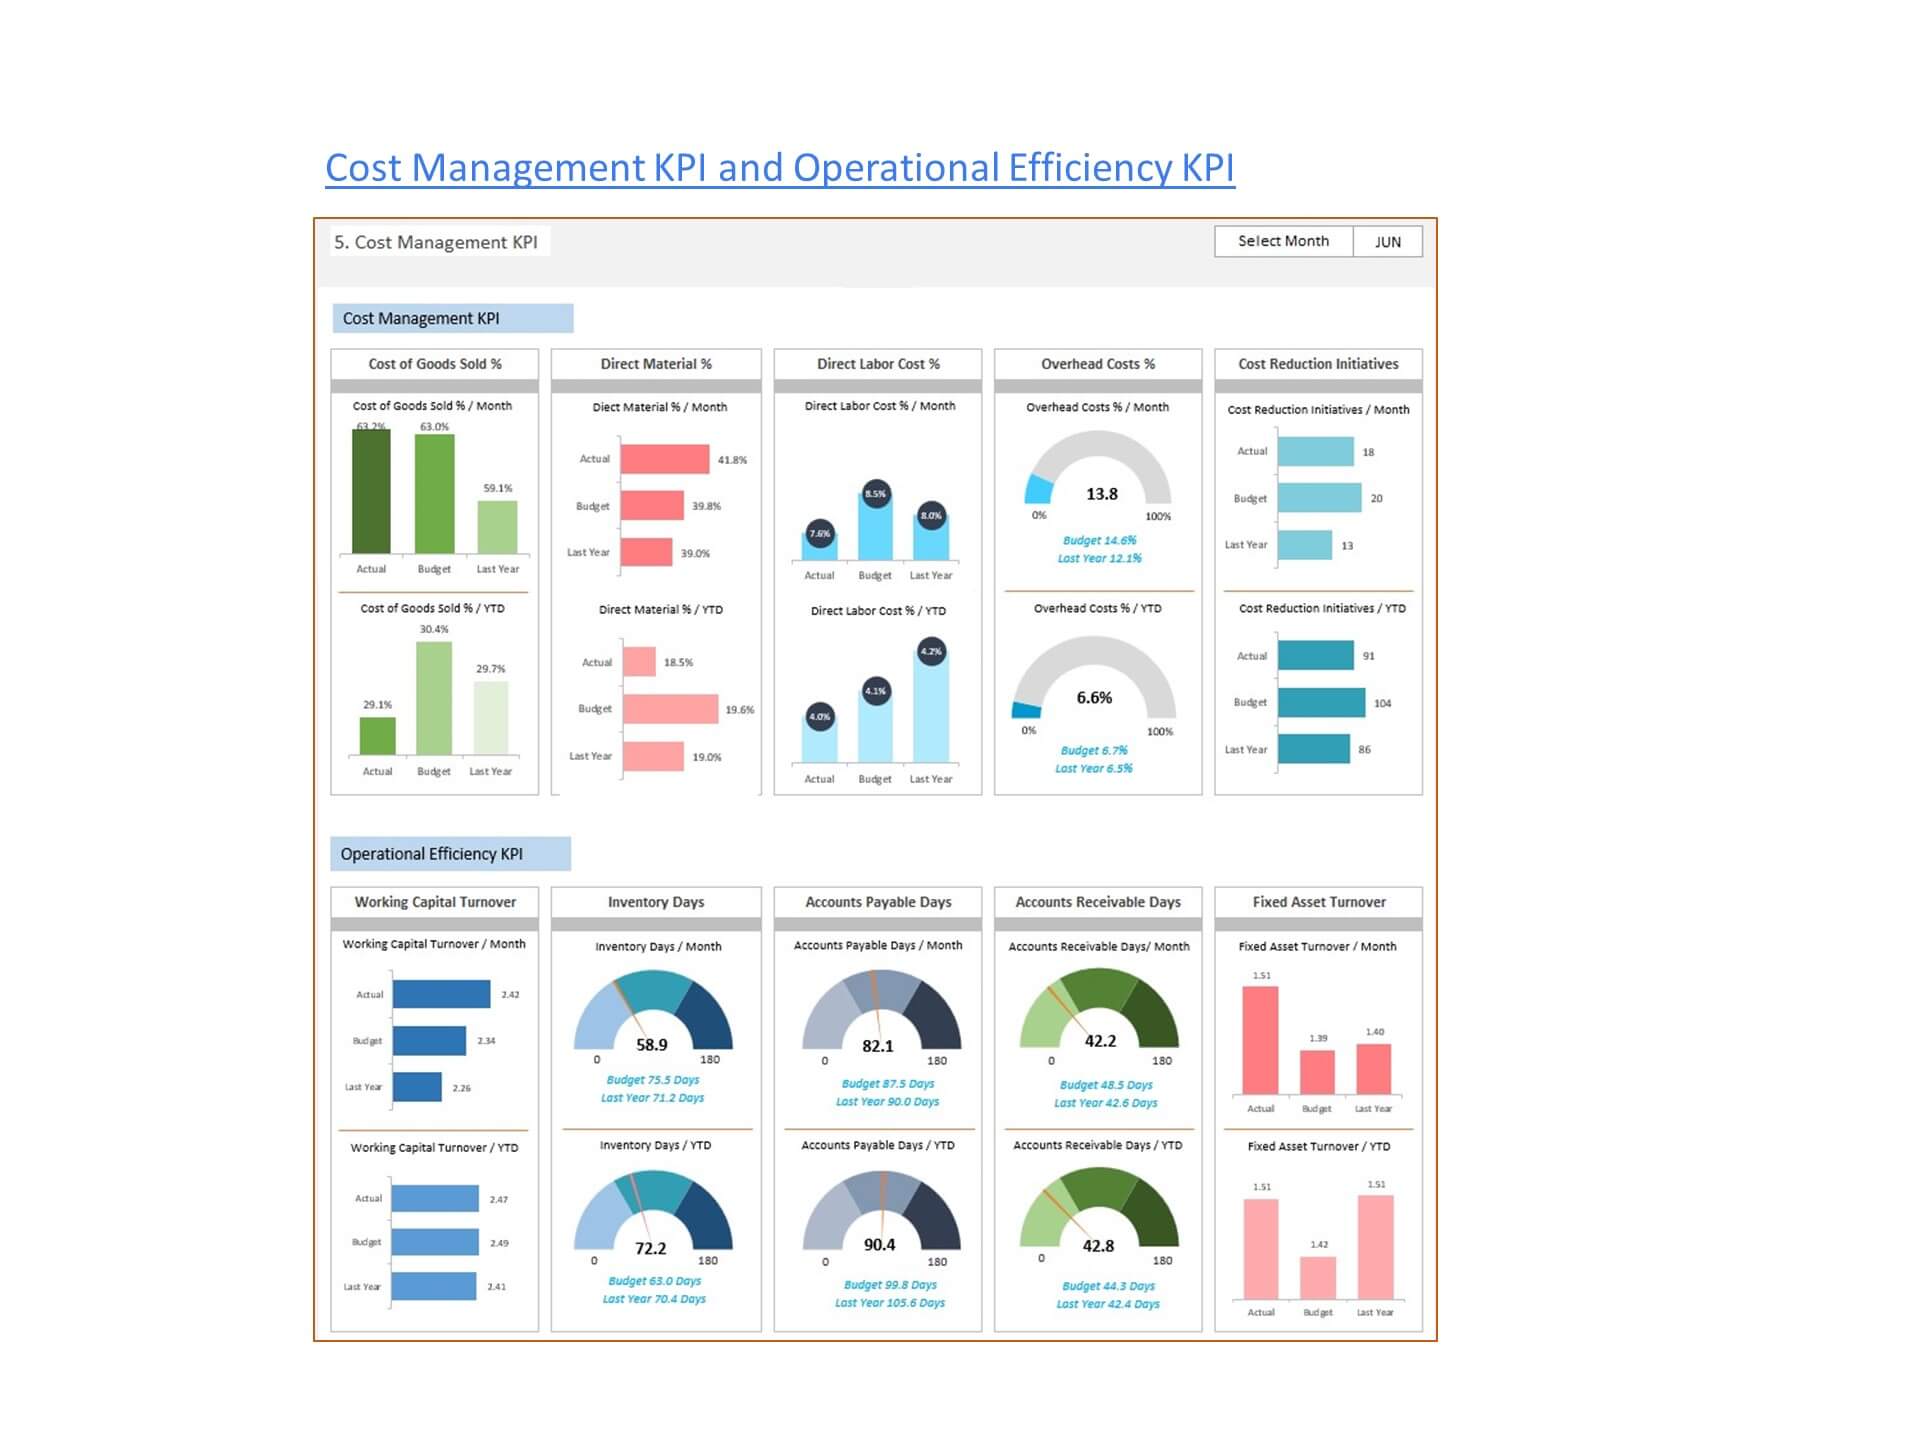
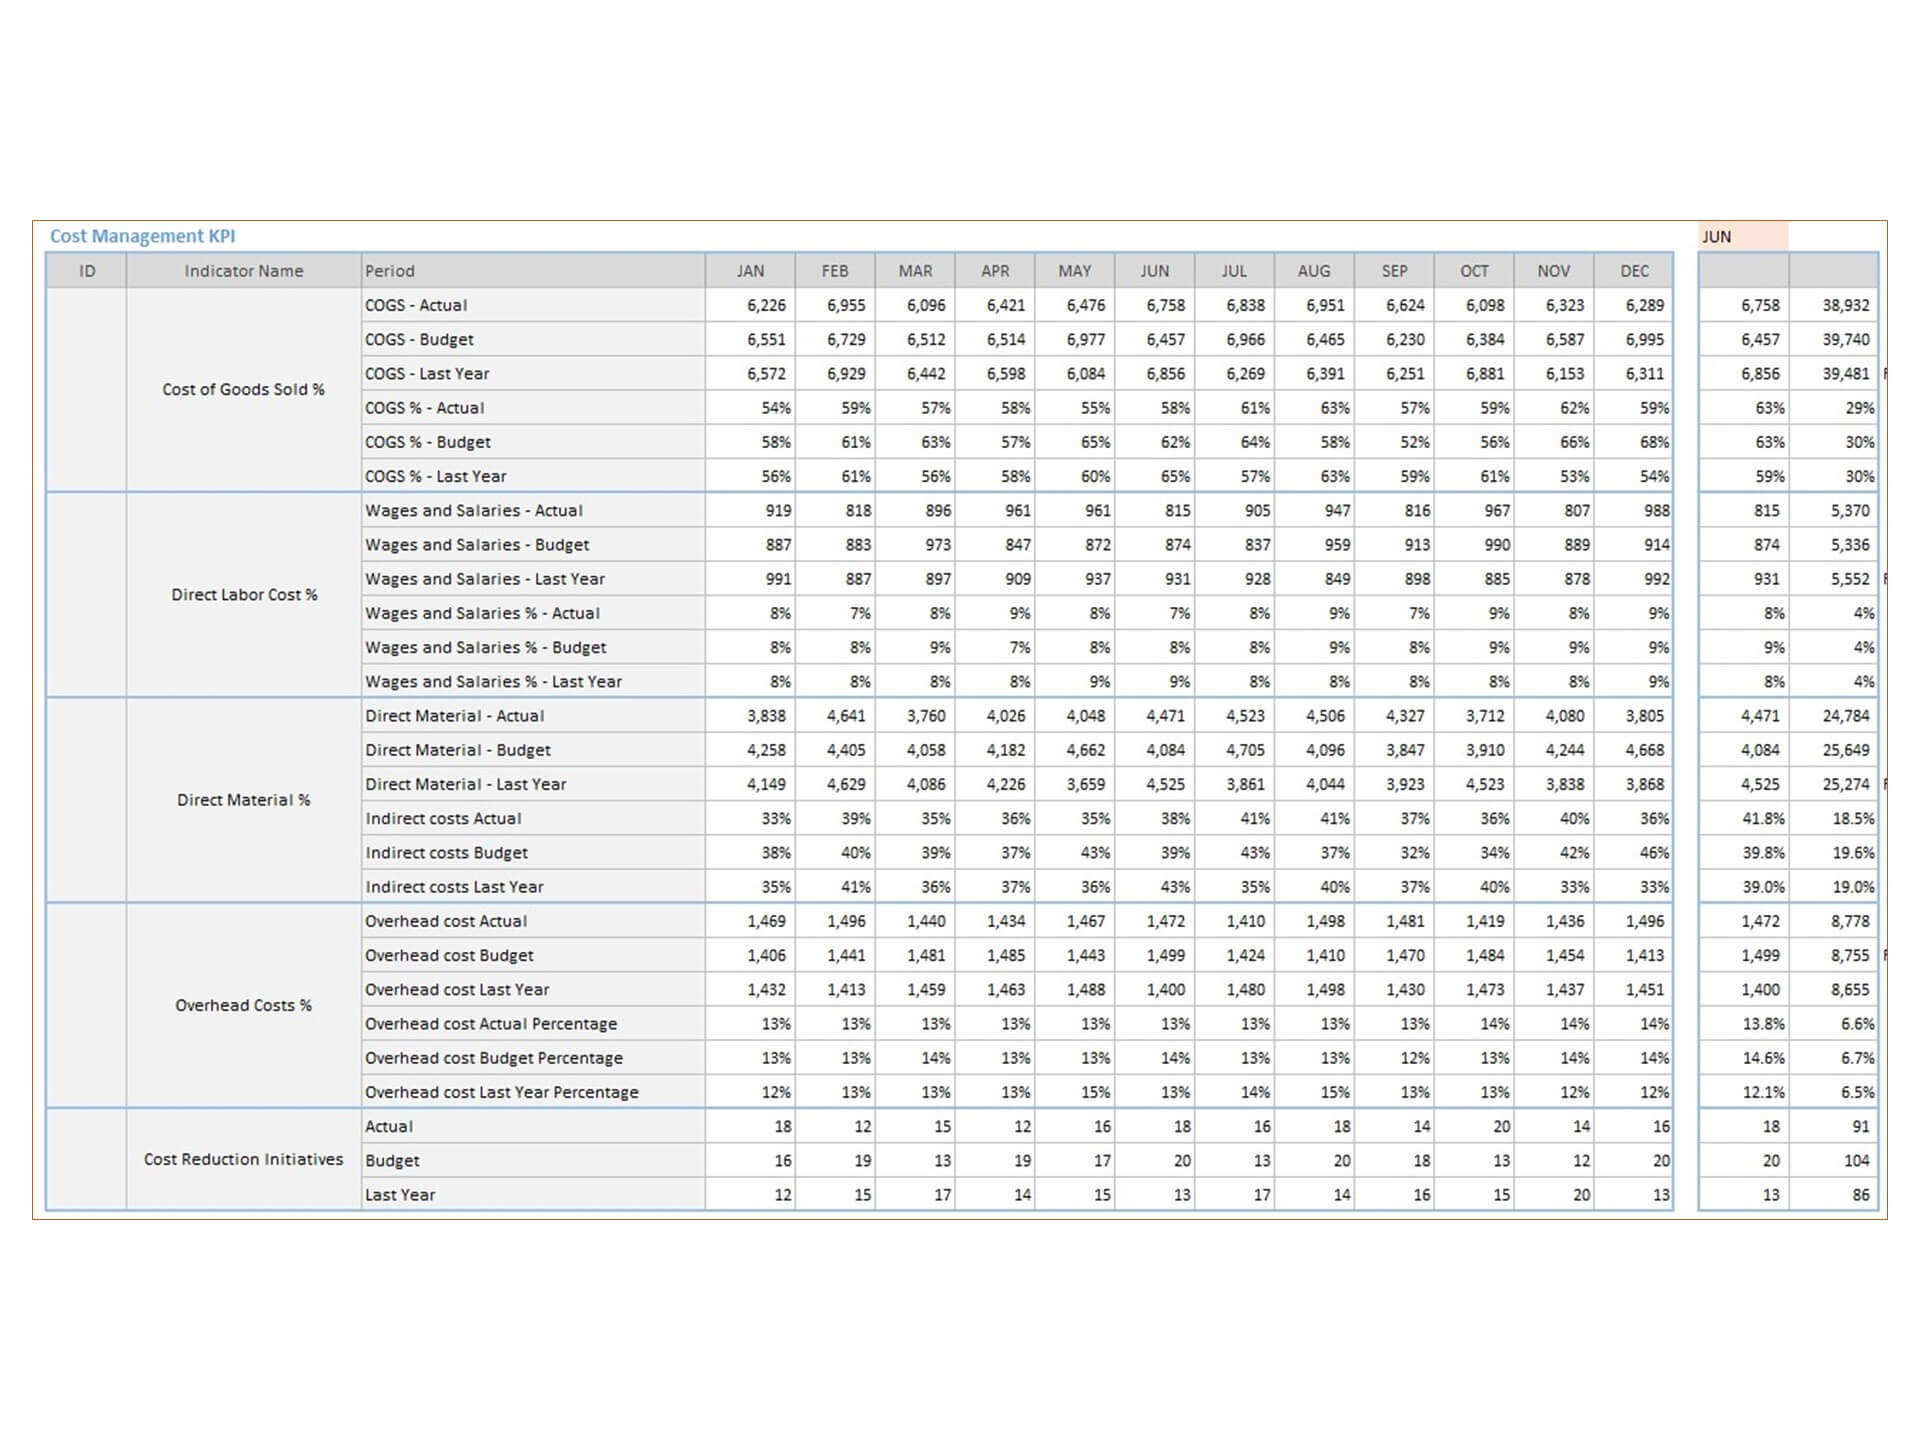
- Cost Management KPI
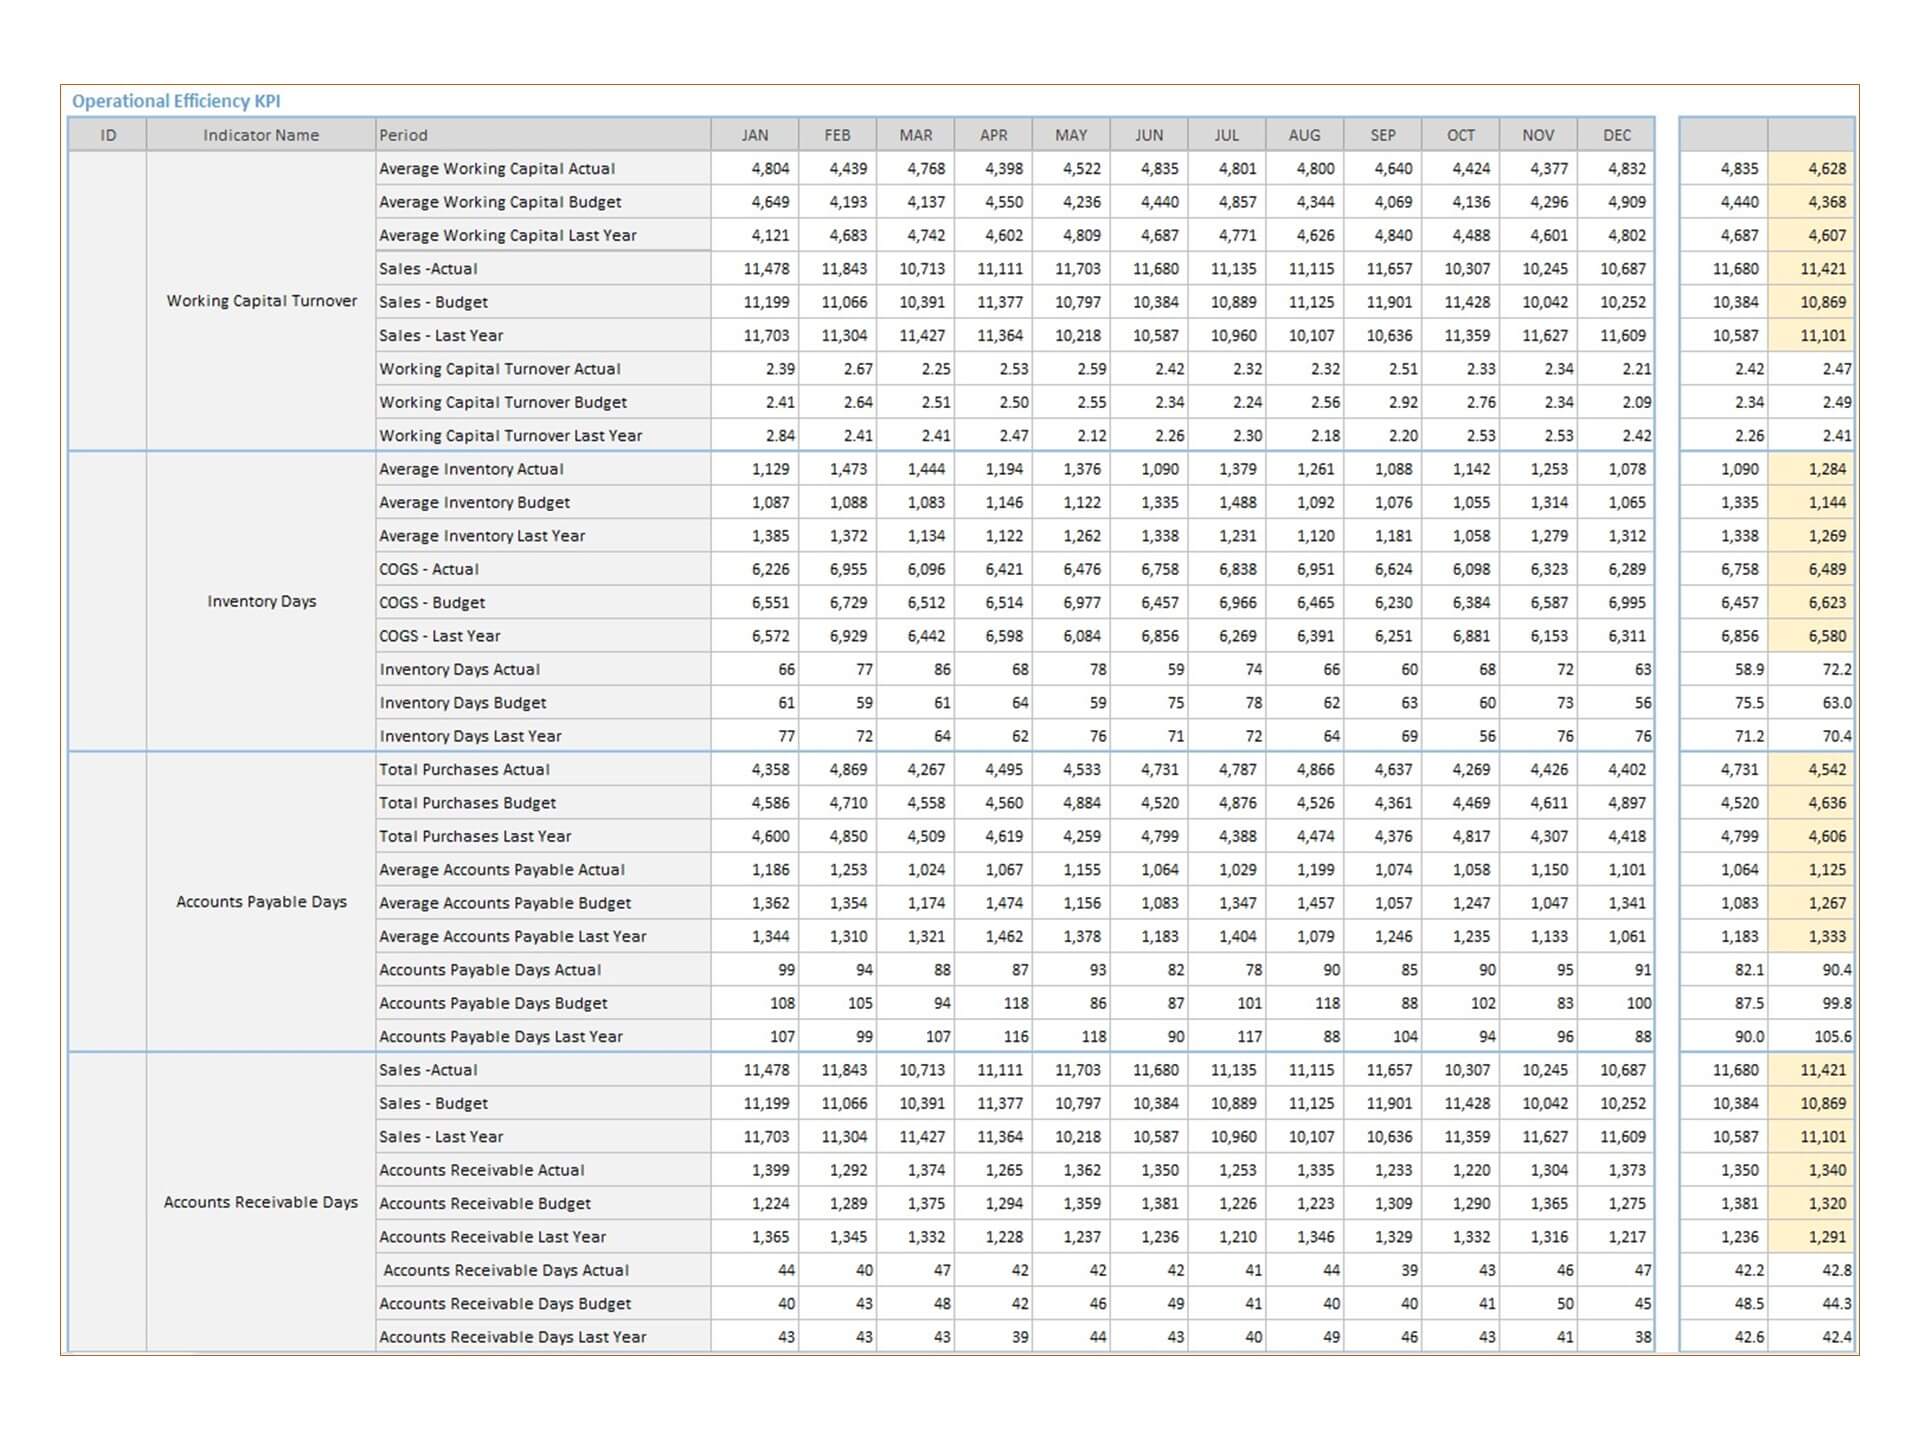
- Operational Efficiency KPI
Key Features of Dashboard Template:
- Provides key business insights for CFO
- Fully editable, easy to use, template with sample data
- Eye-catching design and customizable
- Change the sample data with your data
- Spreadsheets ready for printing without Biz Infograph logo
- Consolidate key financial performance indicators in one dashboard
- No monthly fees
- Immediate download
- No VBA, no Macro
- No installation necessary
- Professionally designed
What is included in this dashboard template?
- Just plug your data, the rest dashboard will be ready instantly and start using.
- A text file which contains a password to view and edit the formula
- A guide to unlocking all the elements in the dashboard
Professional Support:
- Video tutorial guide on how to navigate and use CFO Dashboard Template
- Professional service to customize dashboard template in excel as per business need
- Help and support in post-purchase
- Payment secured by Stripe and PayPal (no PayPal account needed)
A brief guide to using the dashboard template:
- Open the dashboard template
- Go to ‘Indicators’ menu – choose the start month of the fiscal year (i.e. Jan, Feb, Jul, etc.)
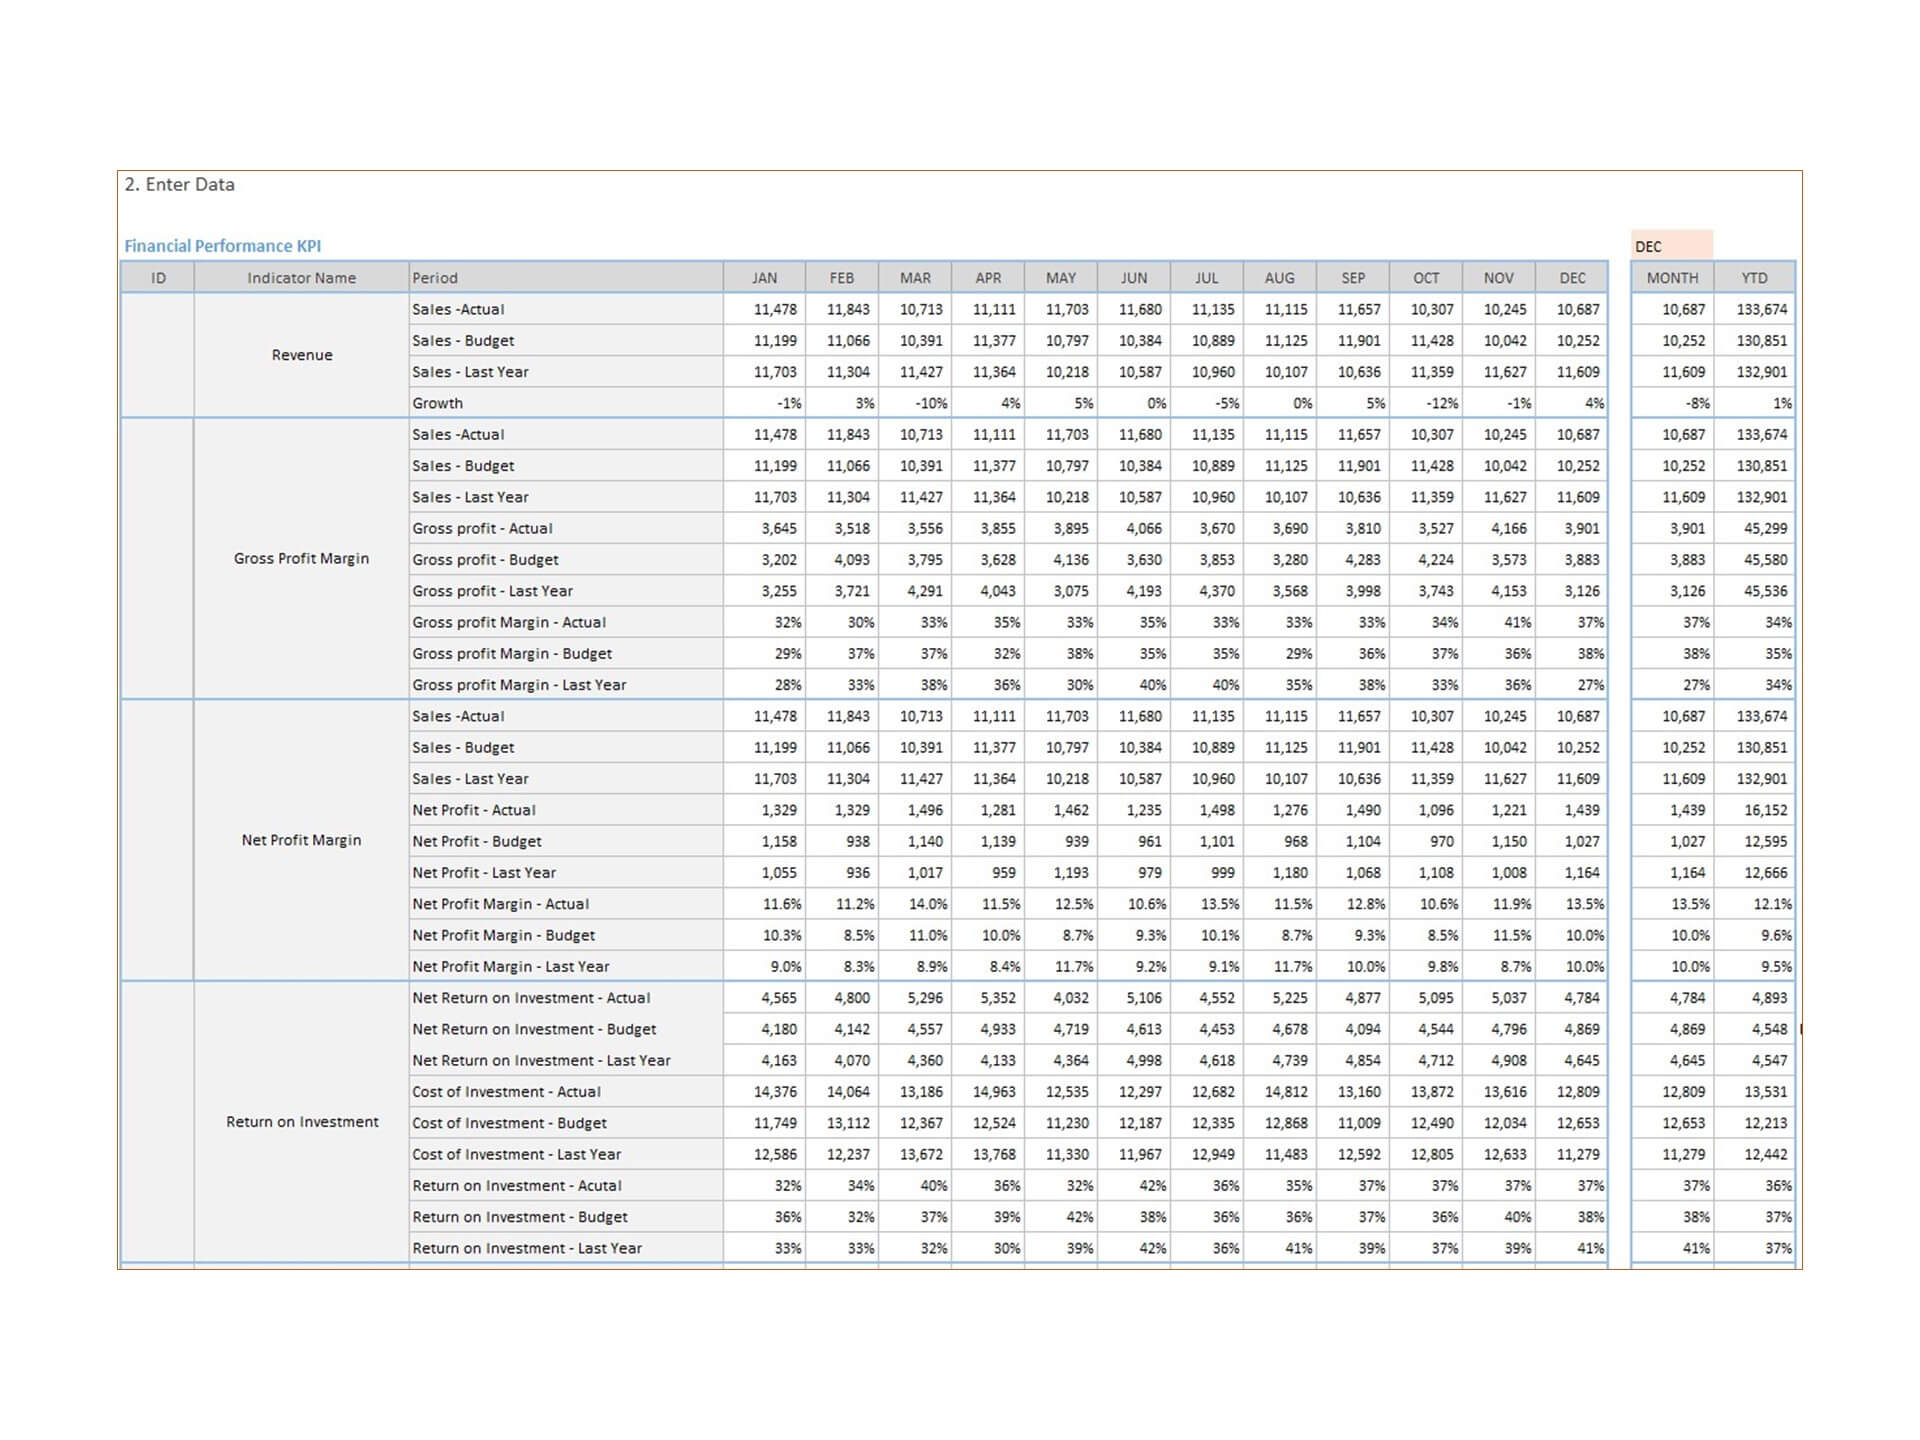
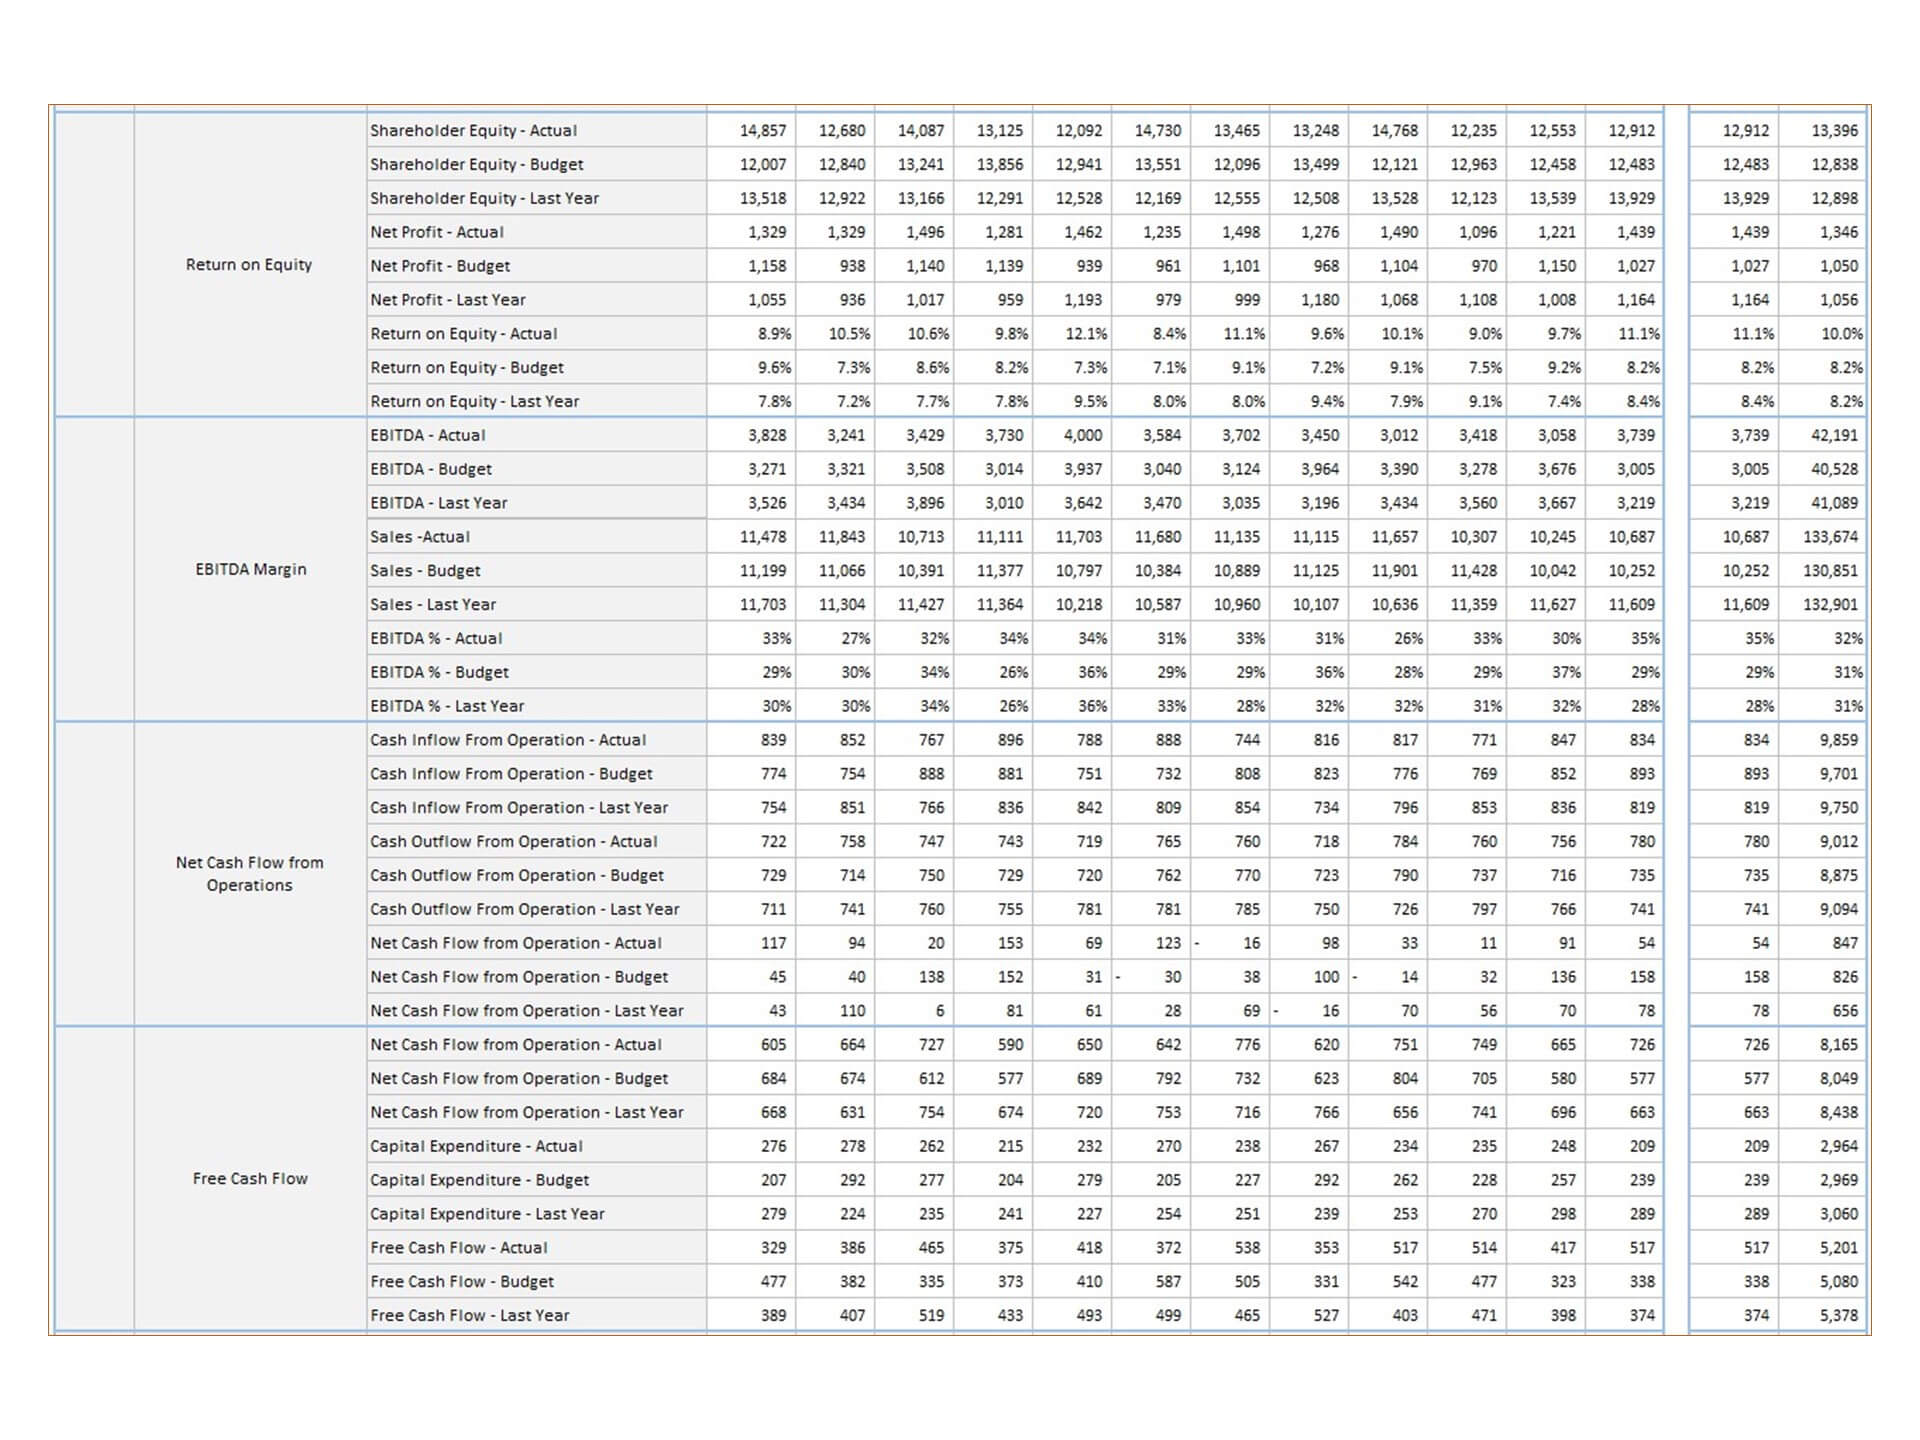
- Go to the ‘Enter Data’ menu – remove the sample data and give your actual data in the respective cells. Formula cells are locked, and you cannot edit it without a password.
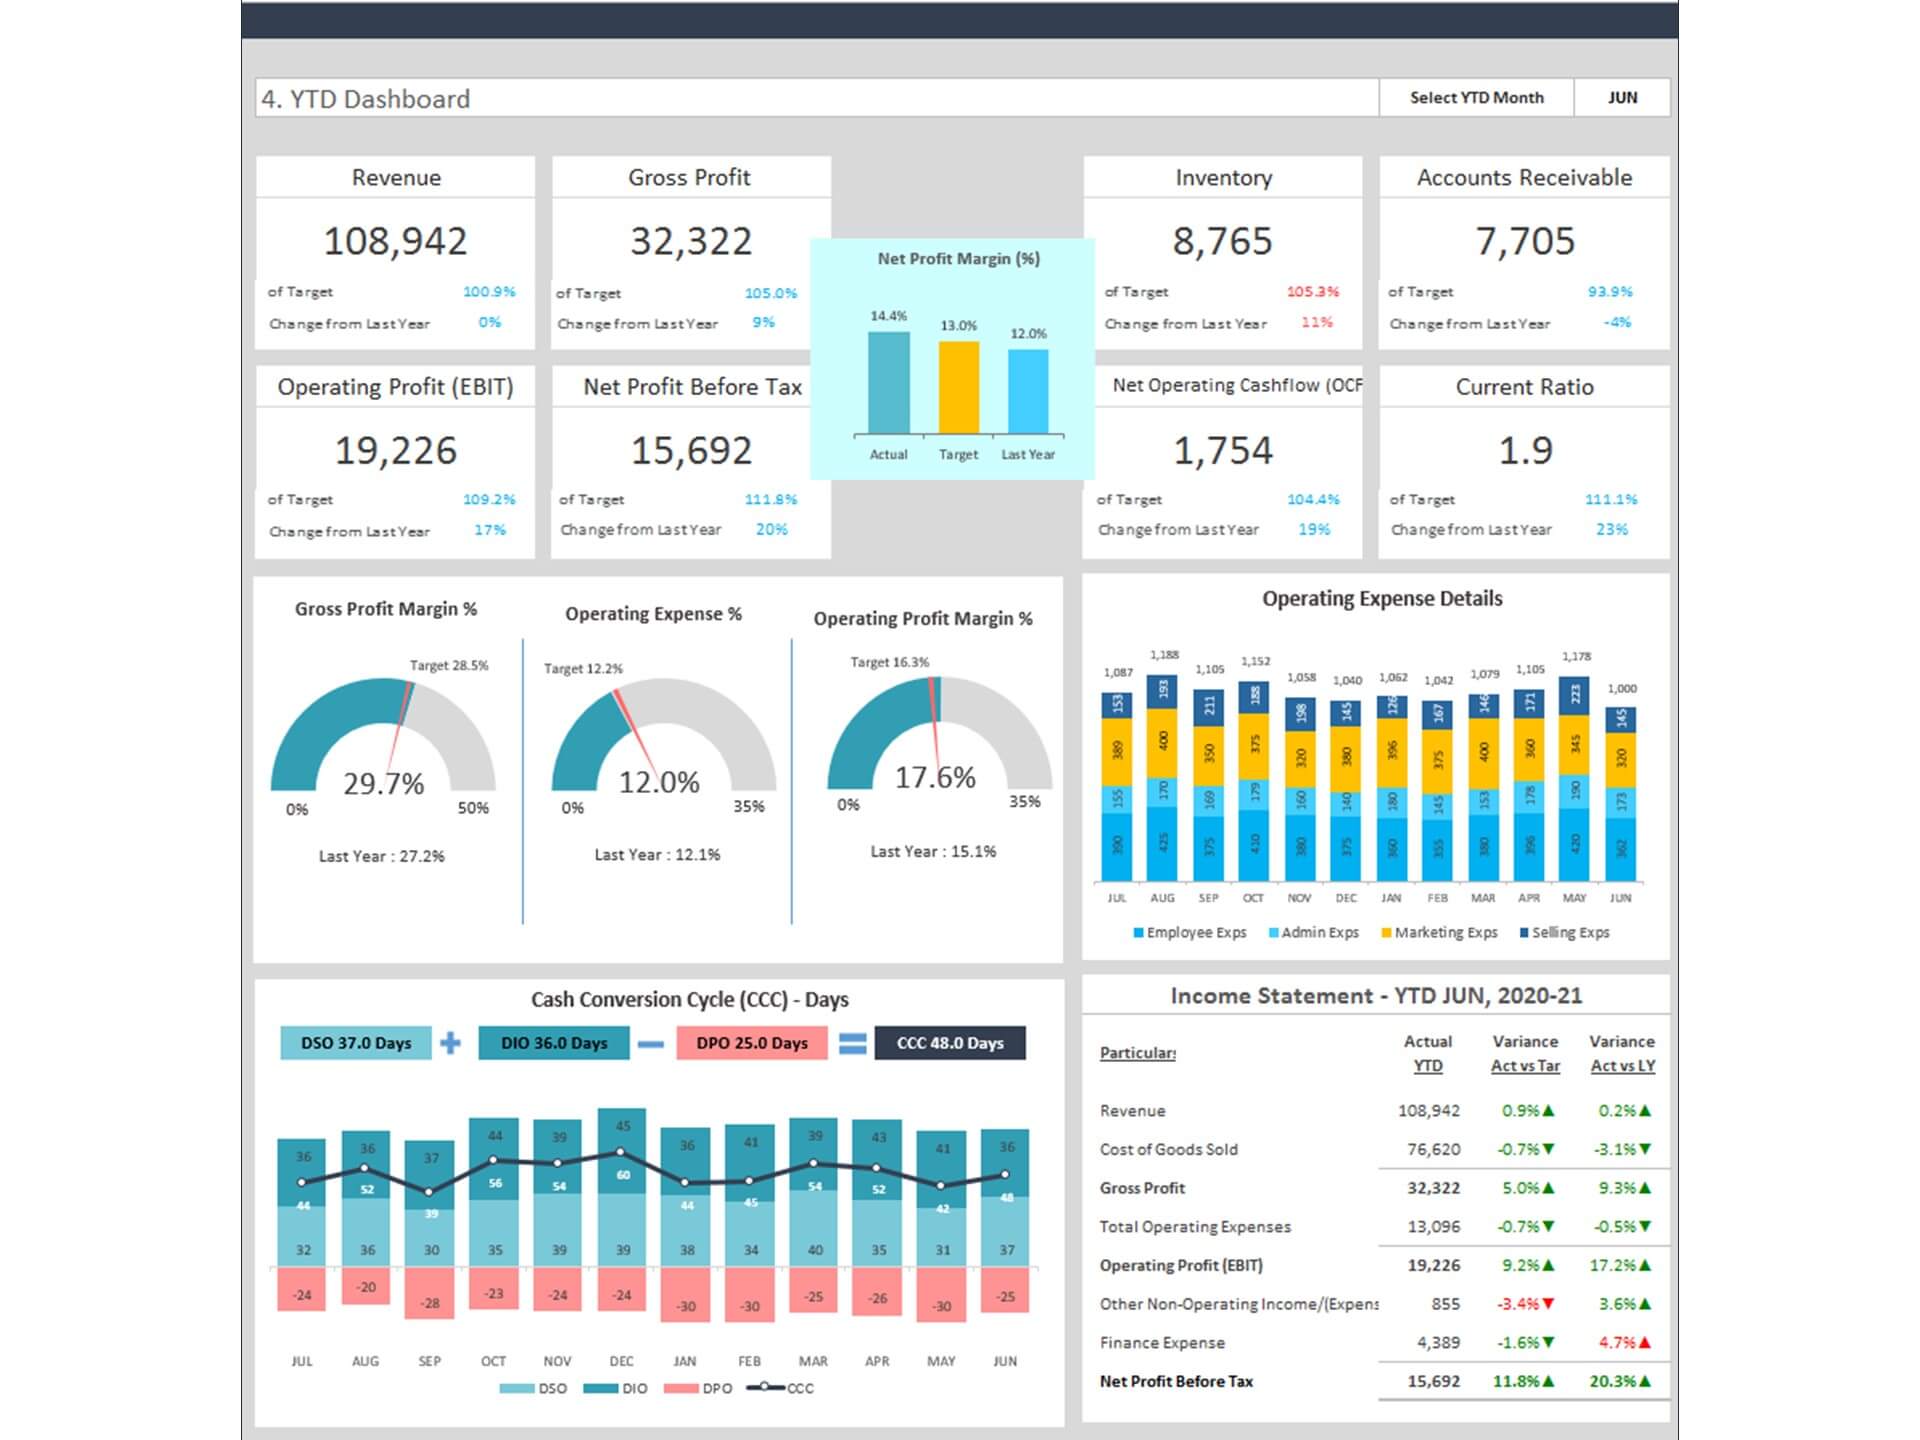
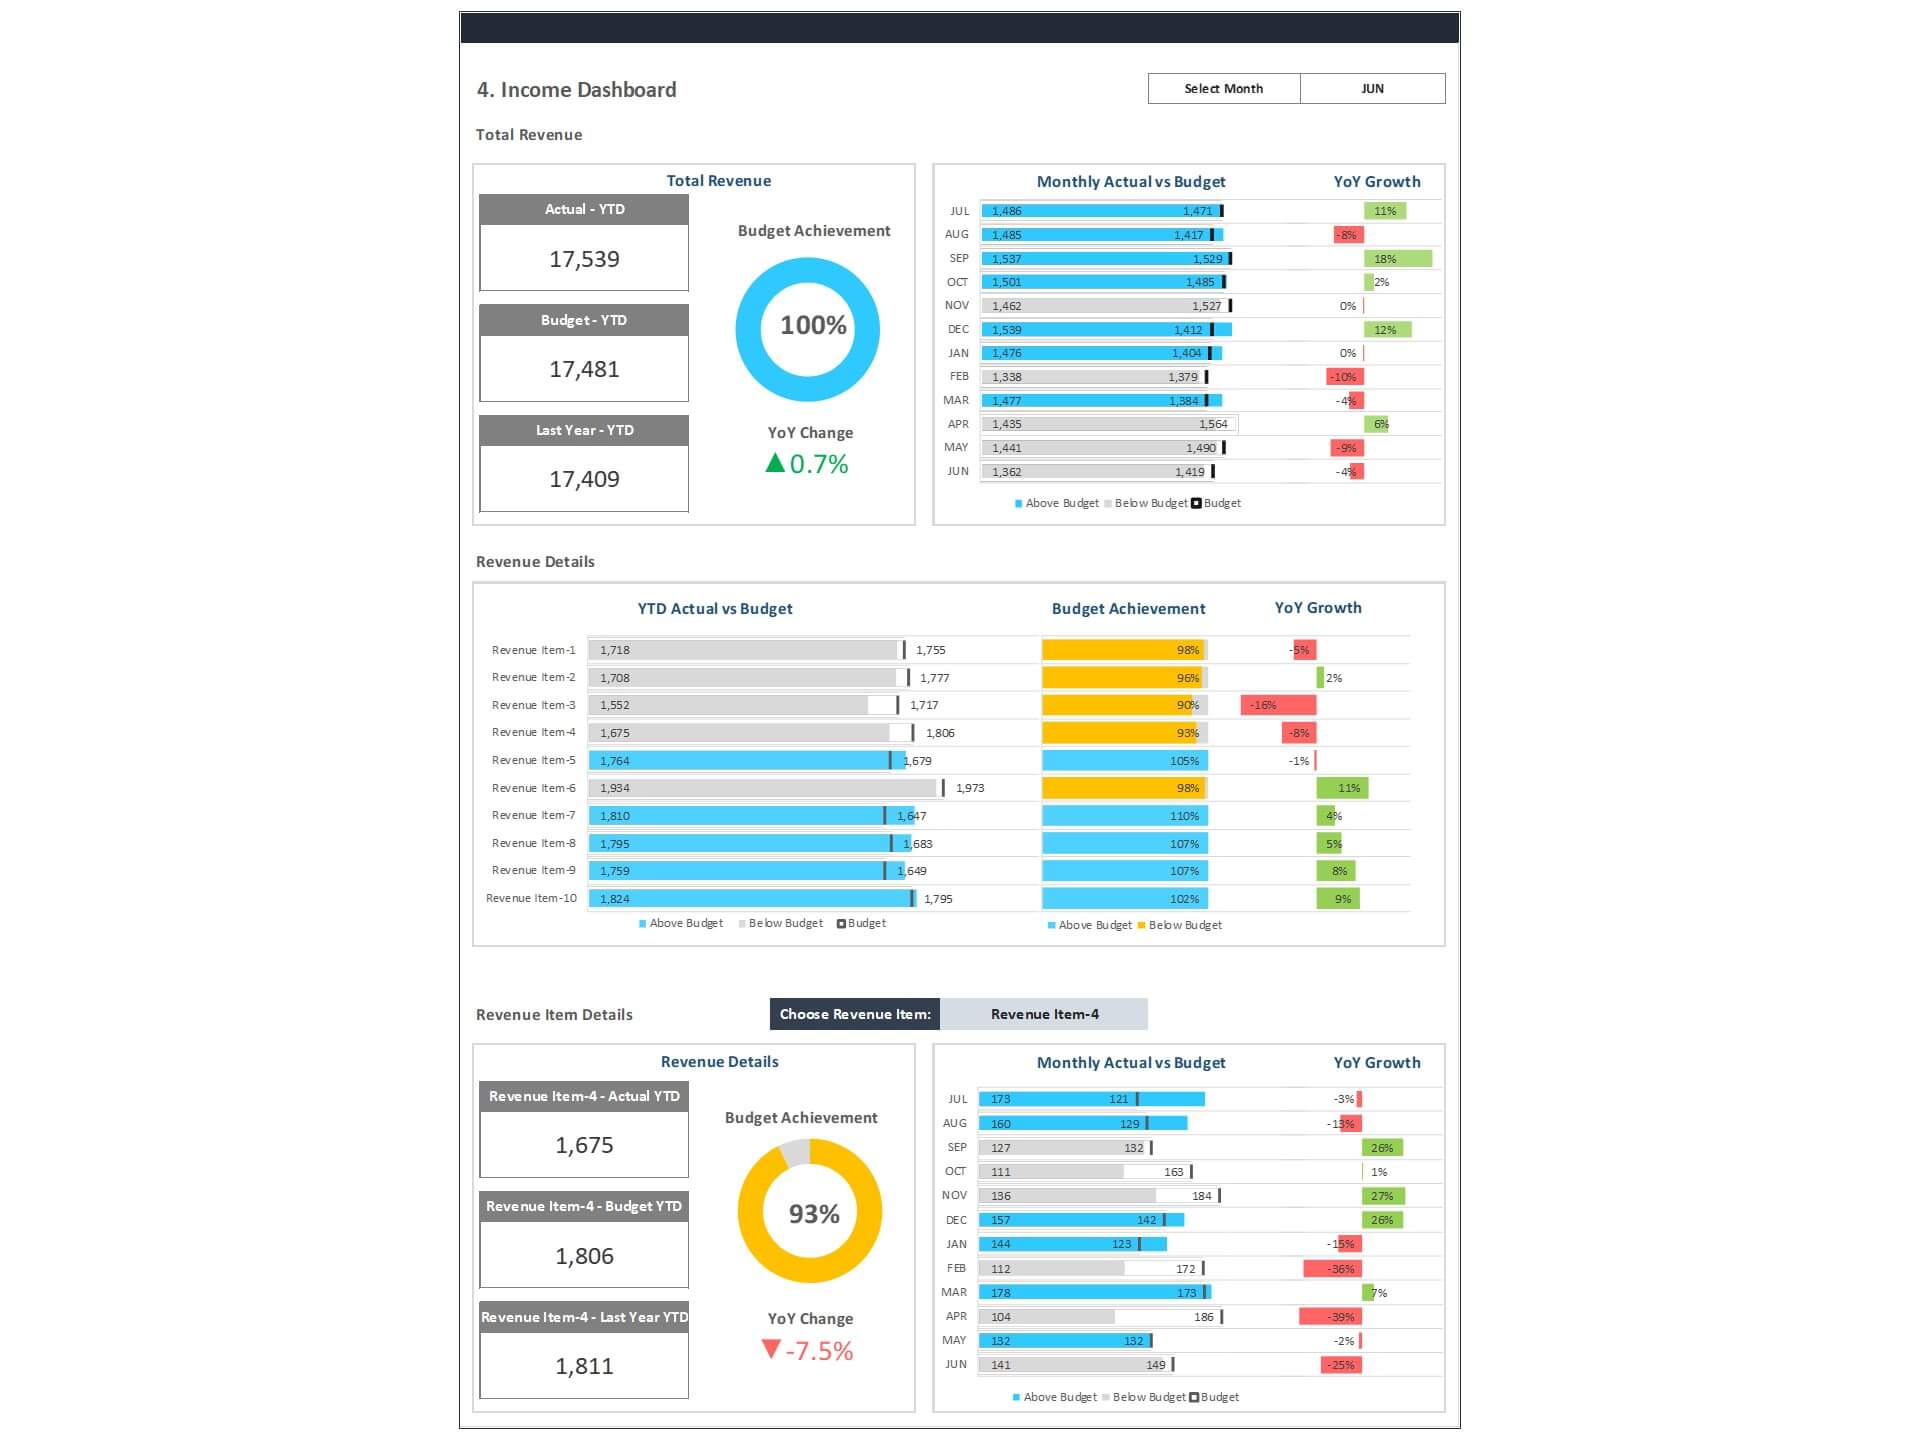
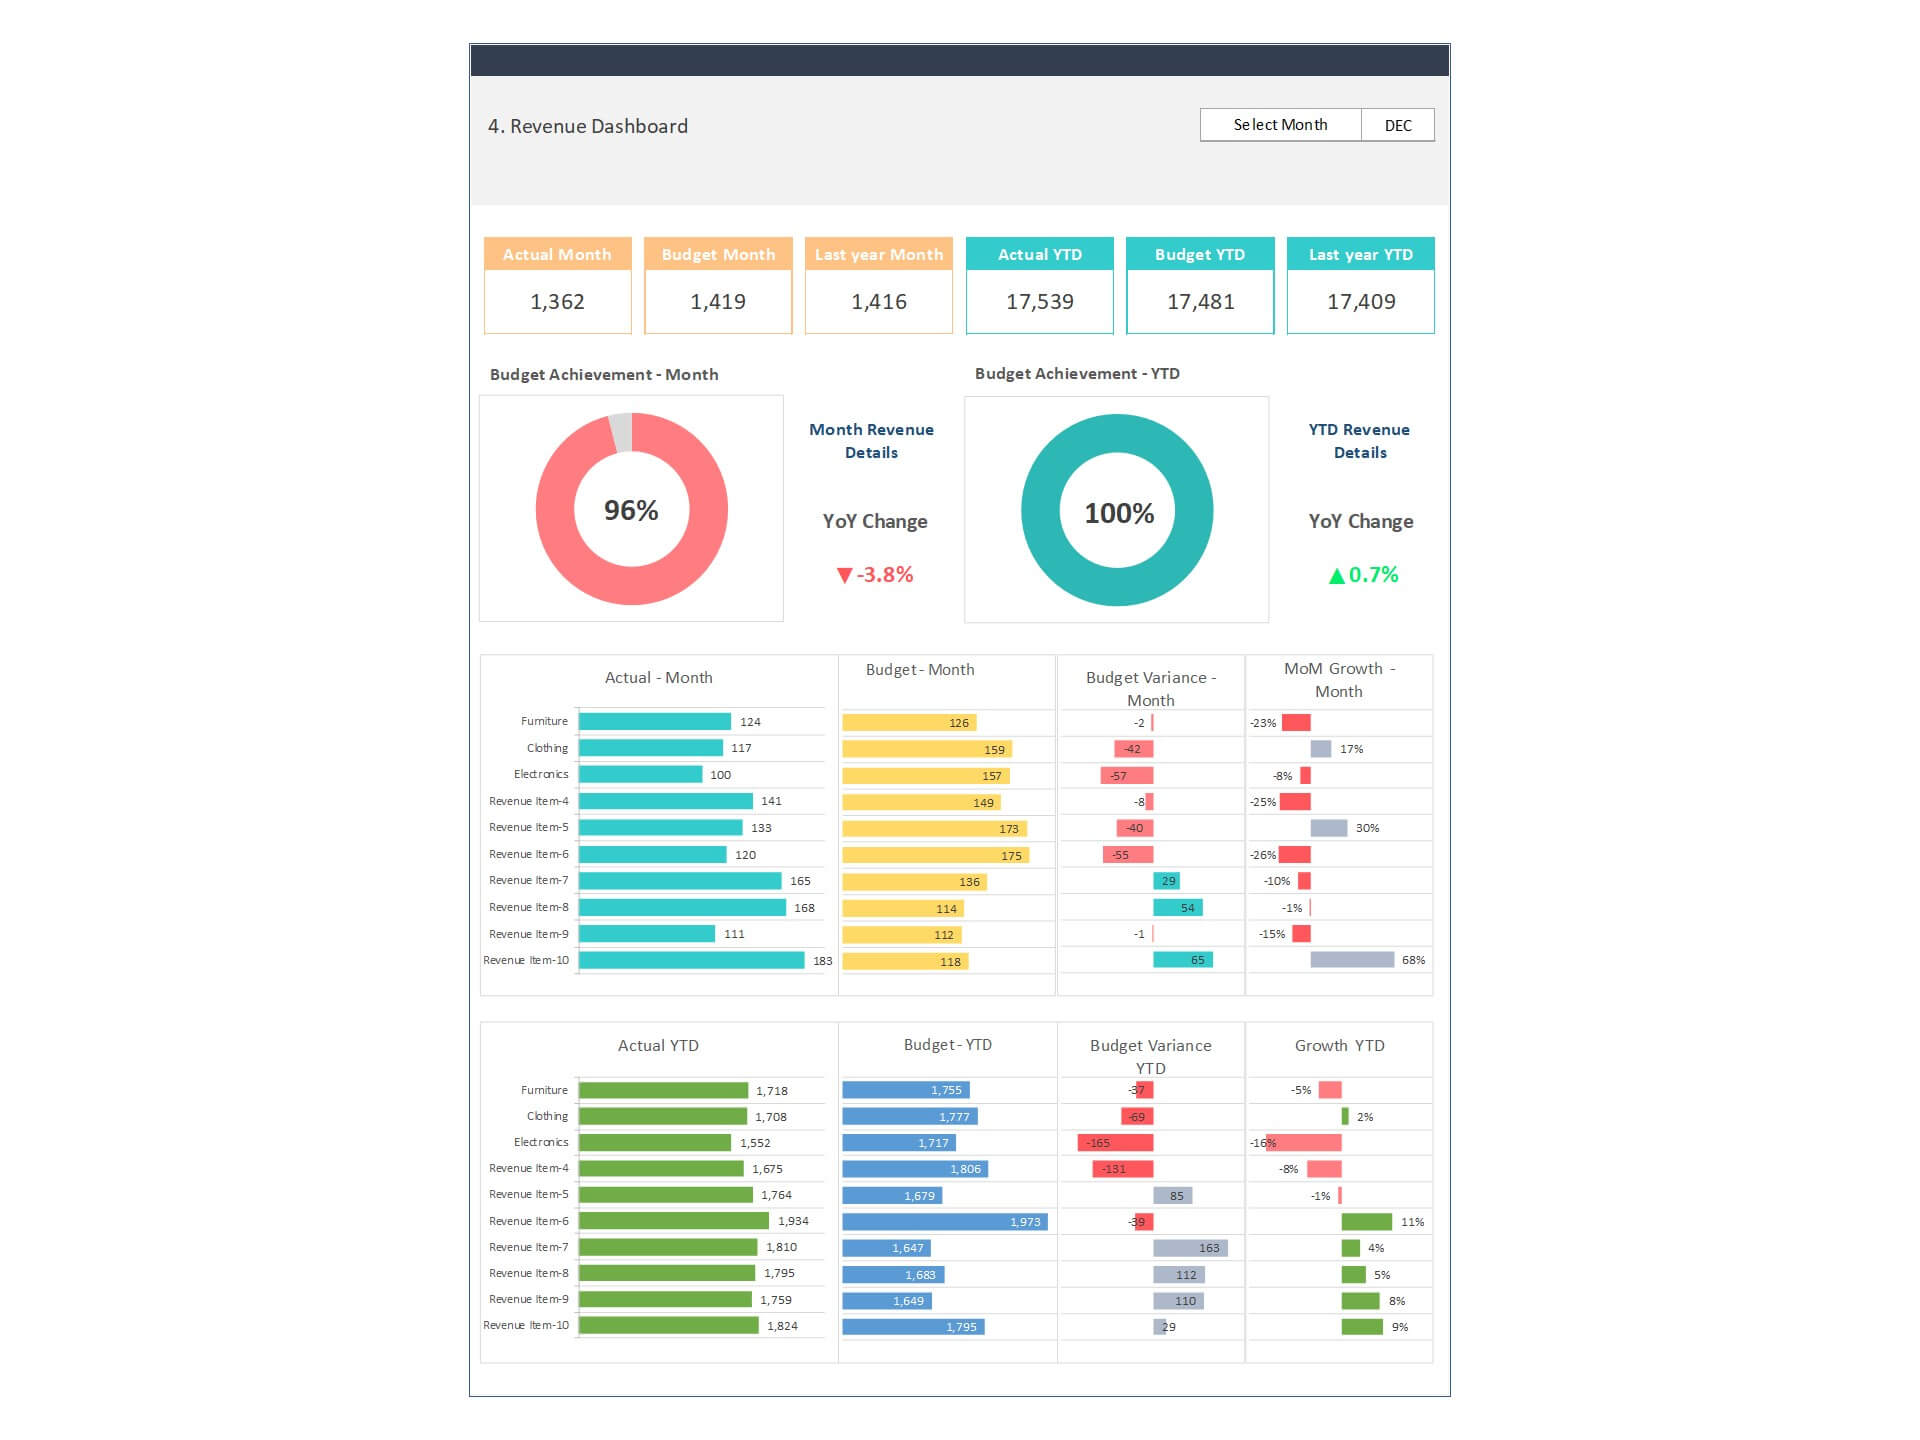
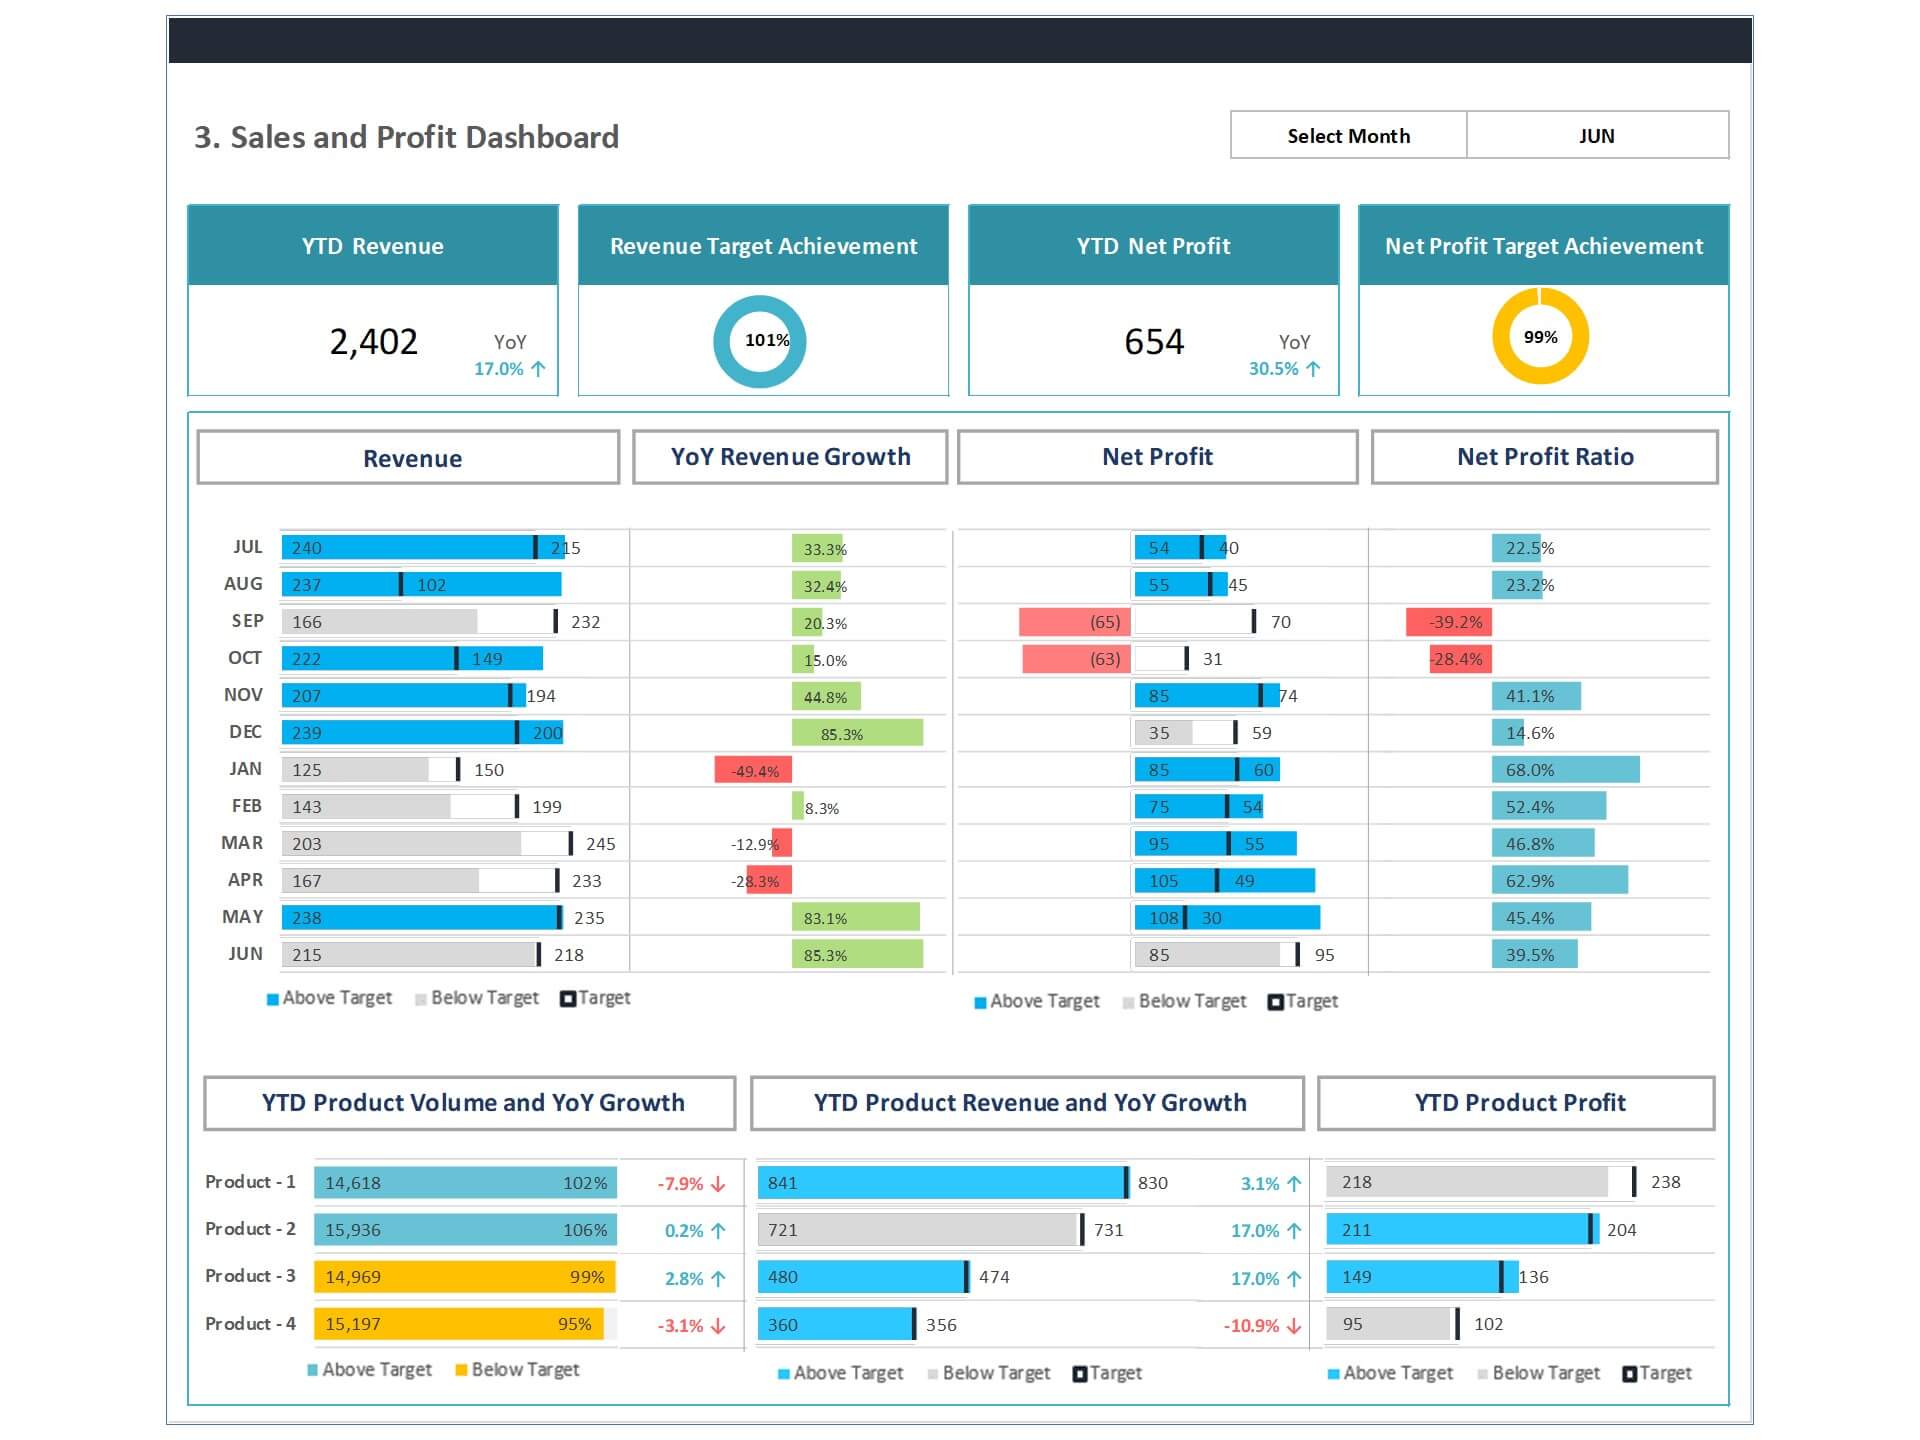
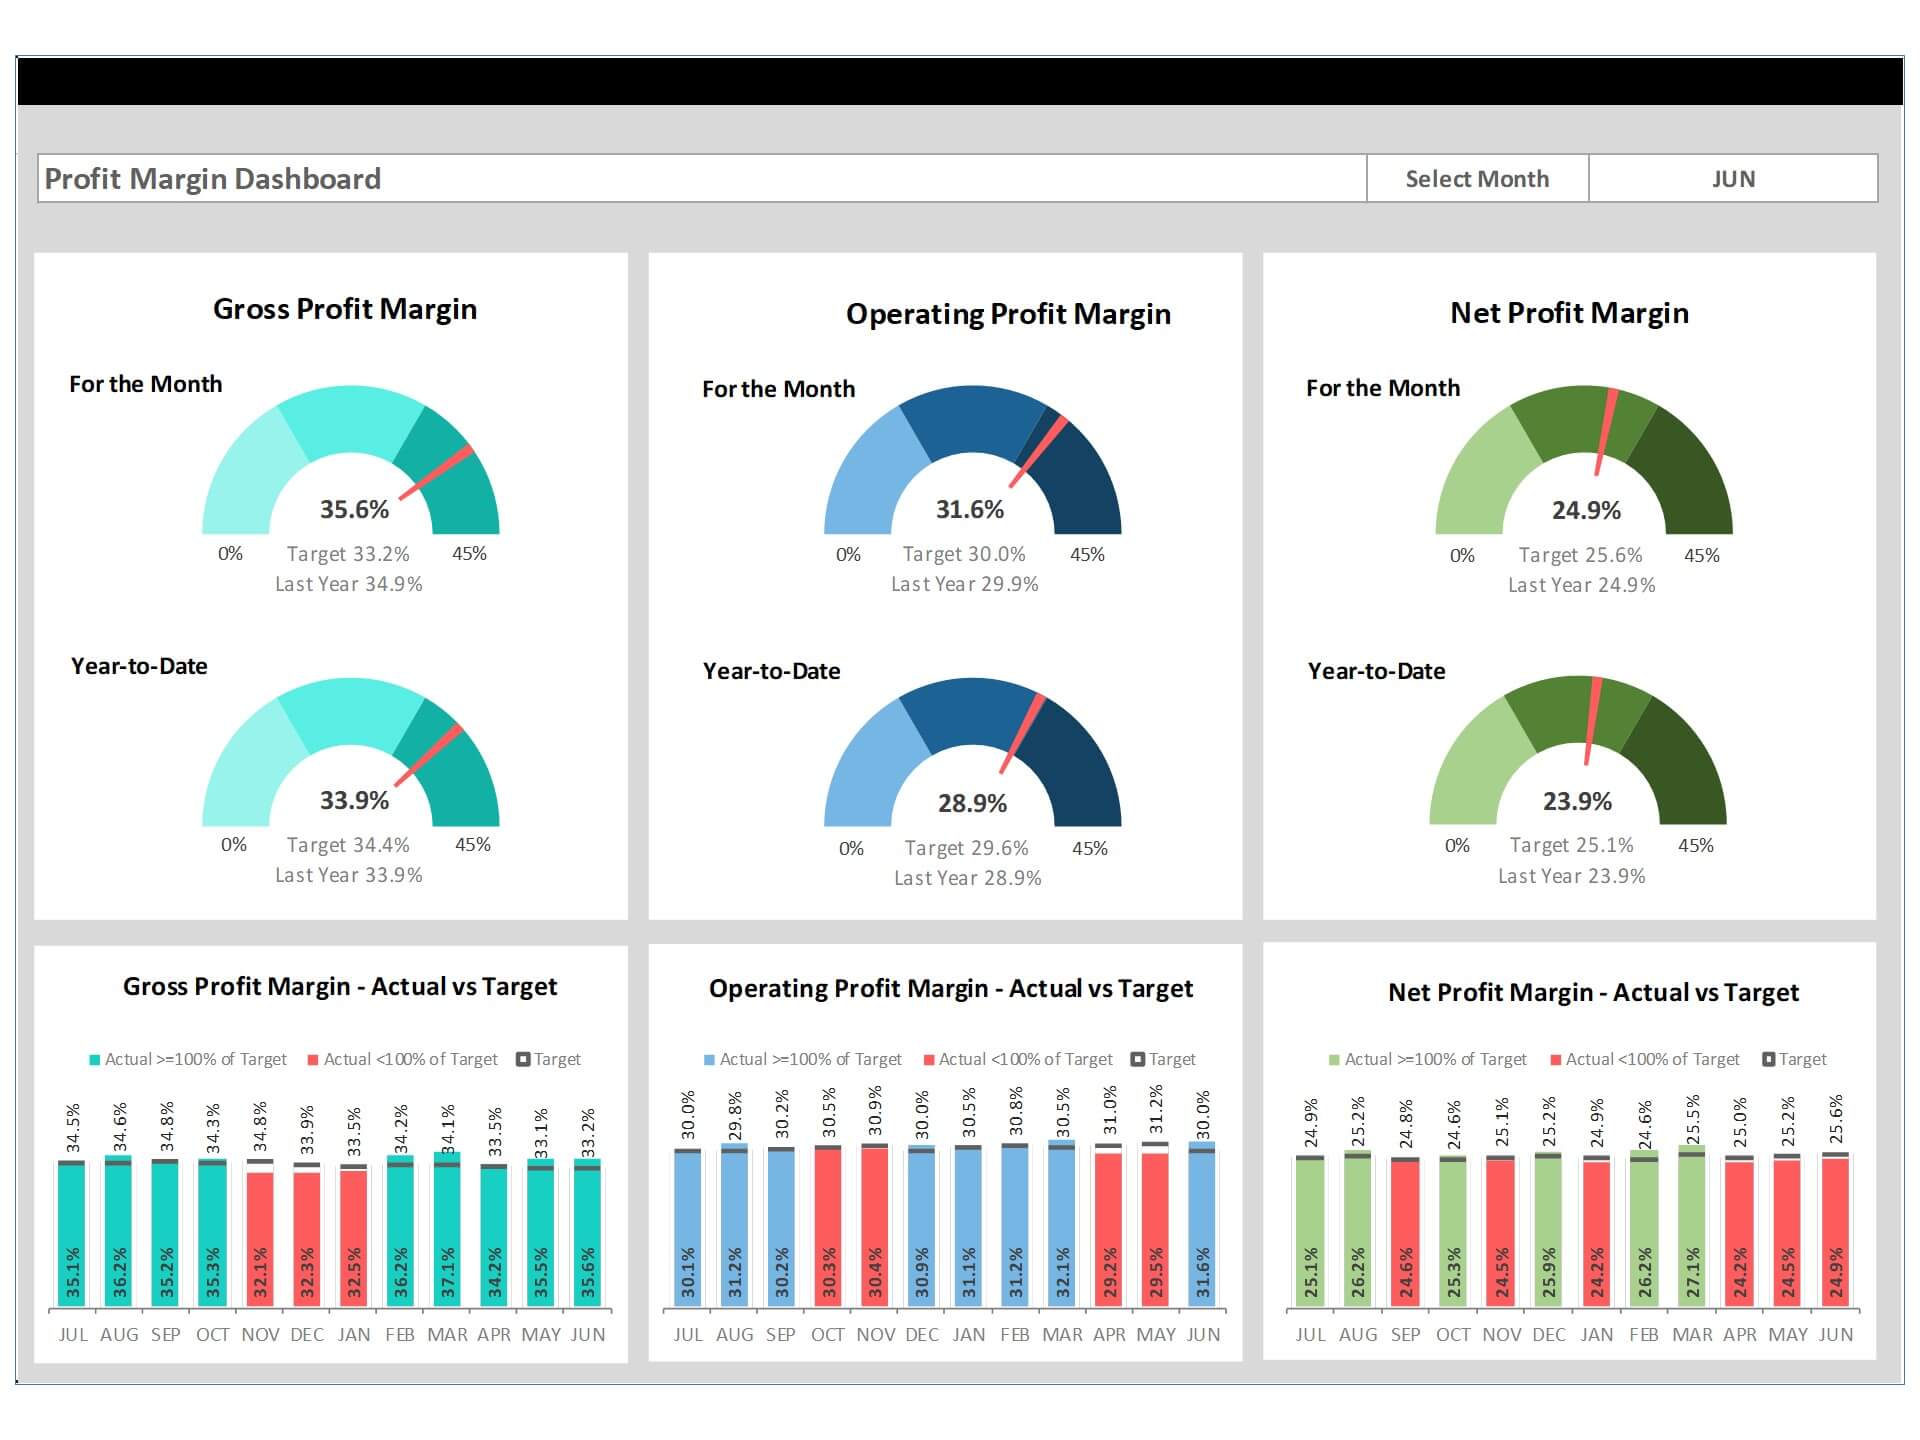
- Go to the ‘Monthly Dashboard’ menu – select the month name from the drop-down to see the monthly picture of performance indicators
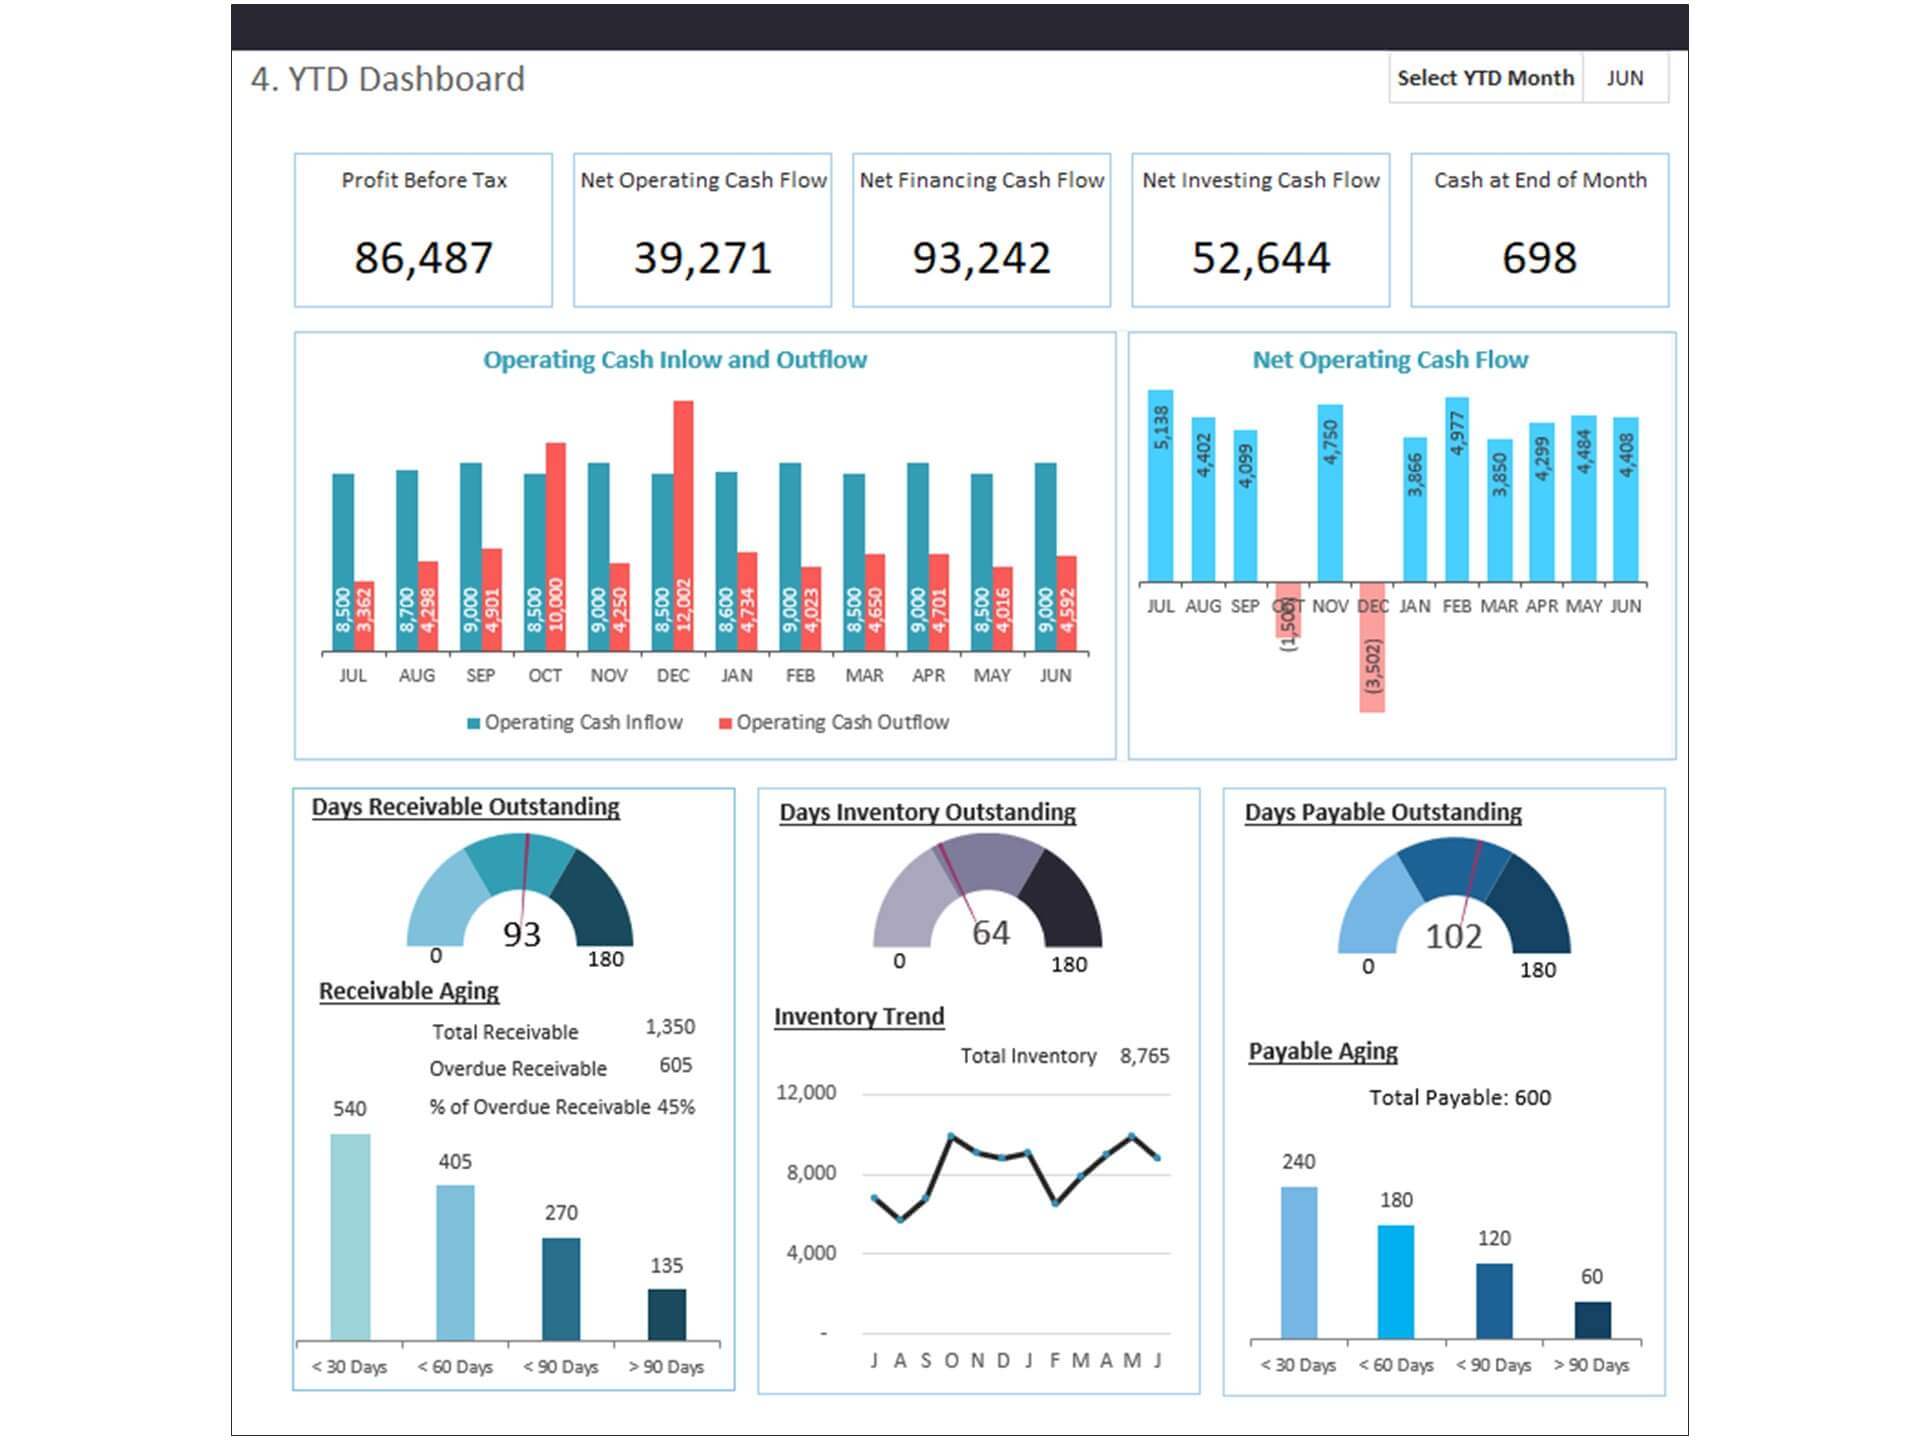
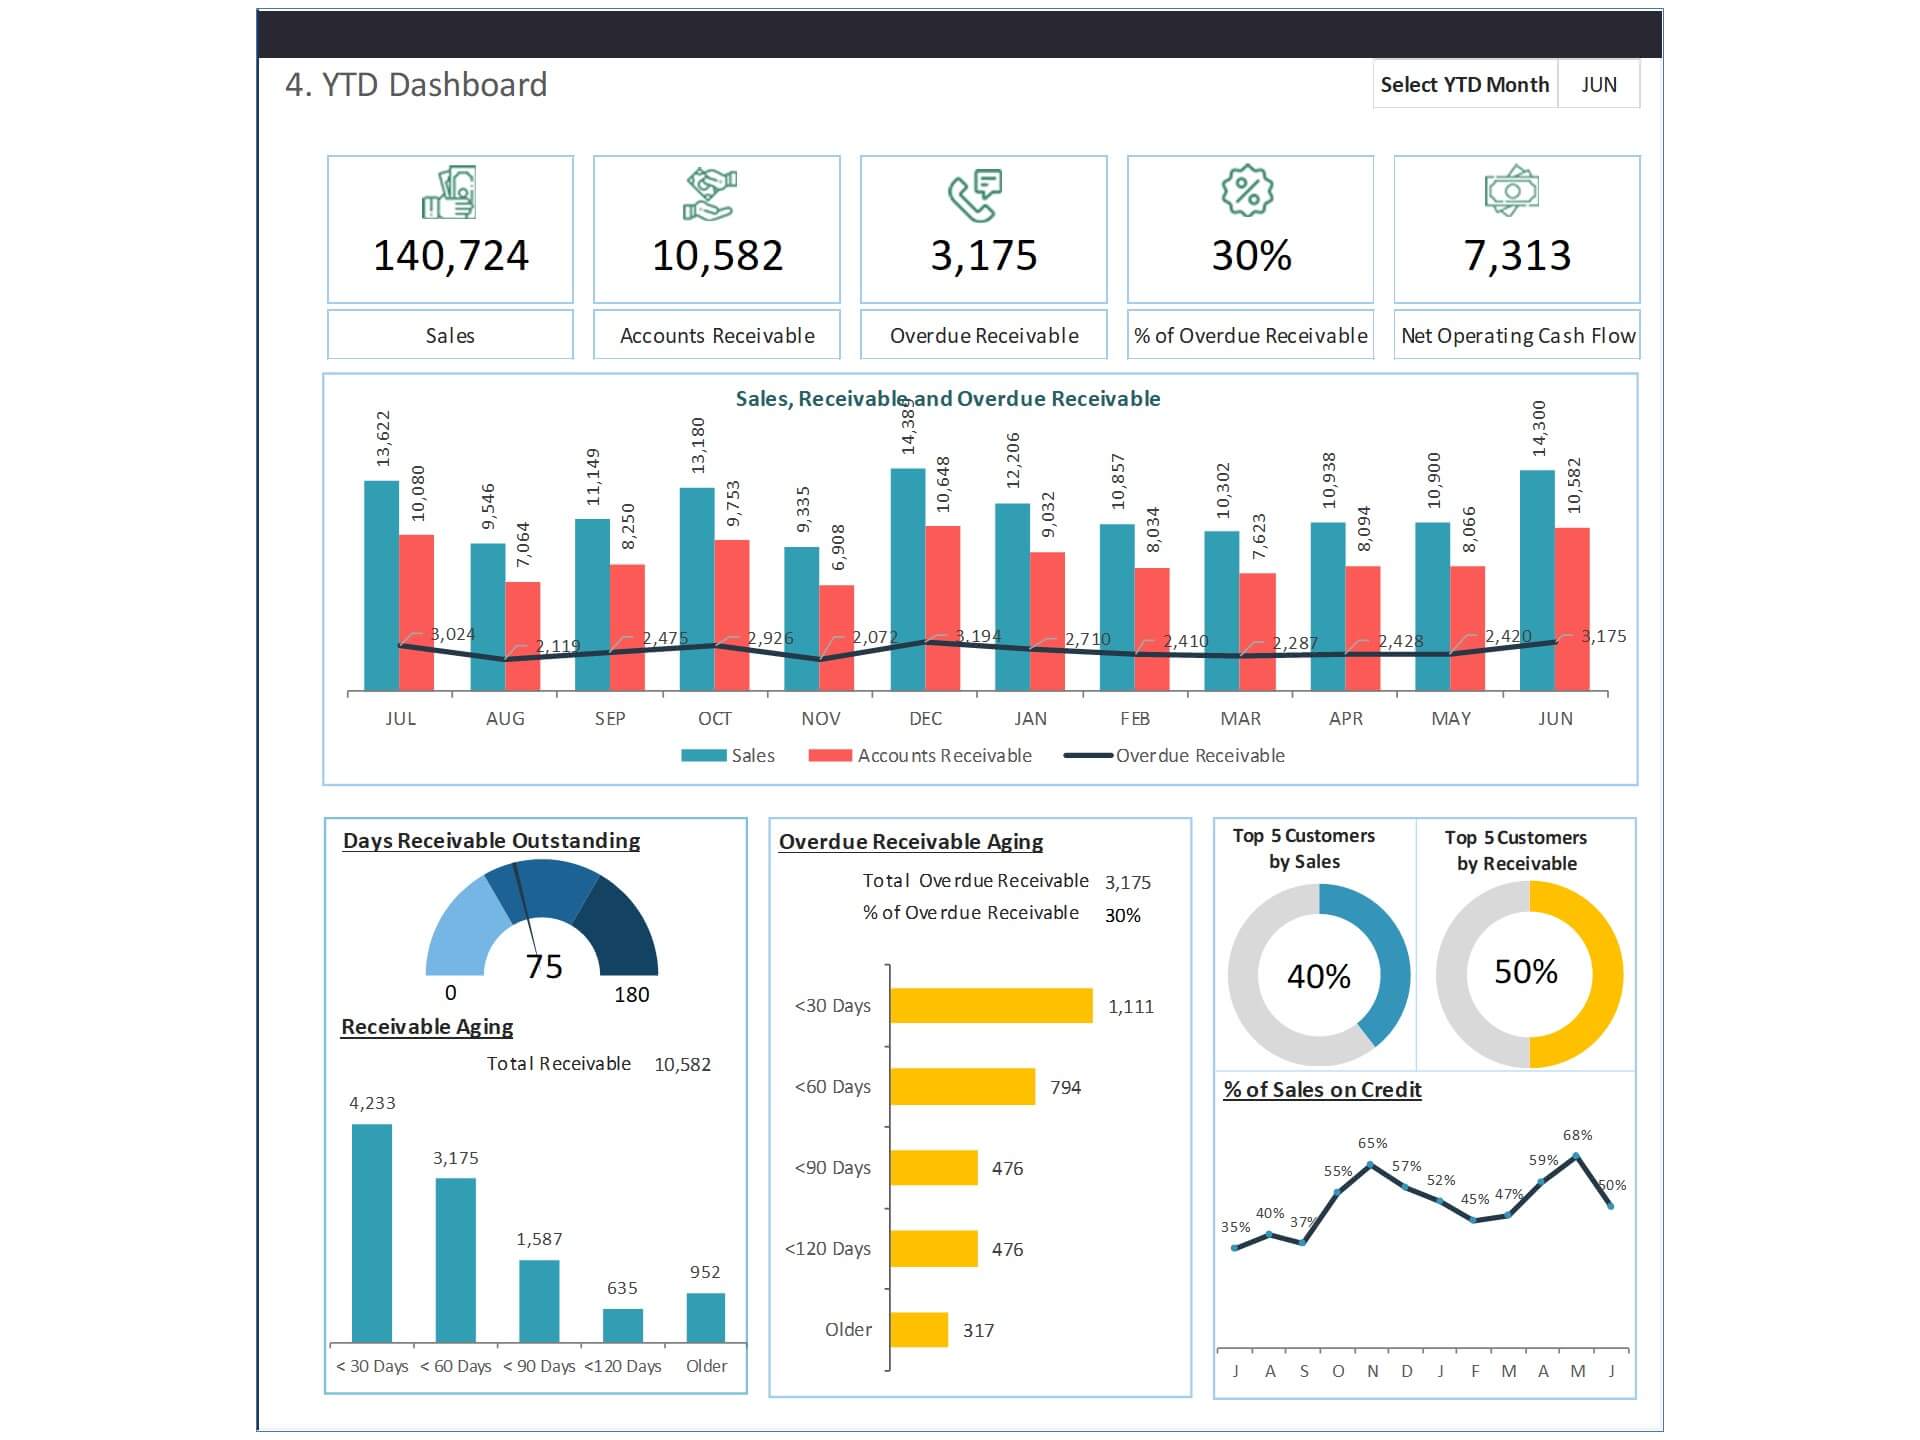
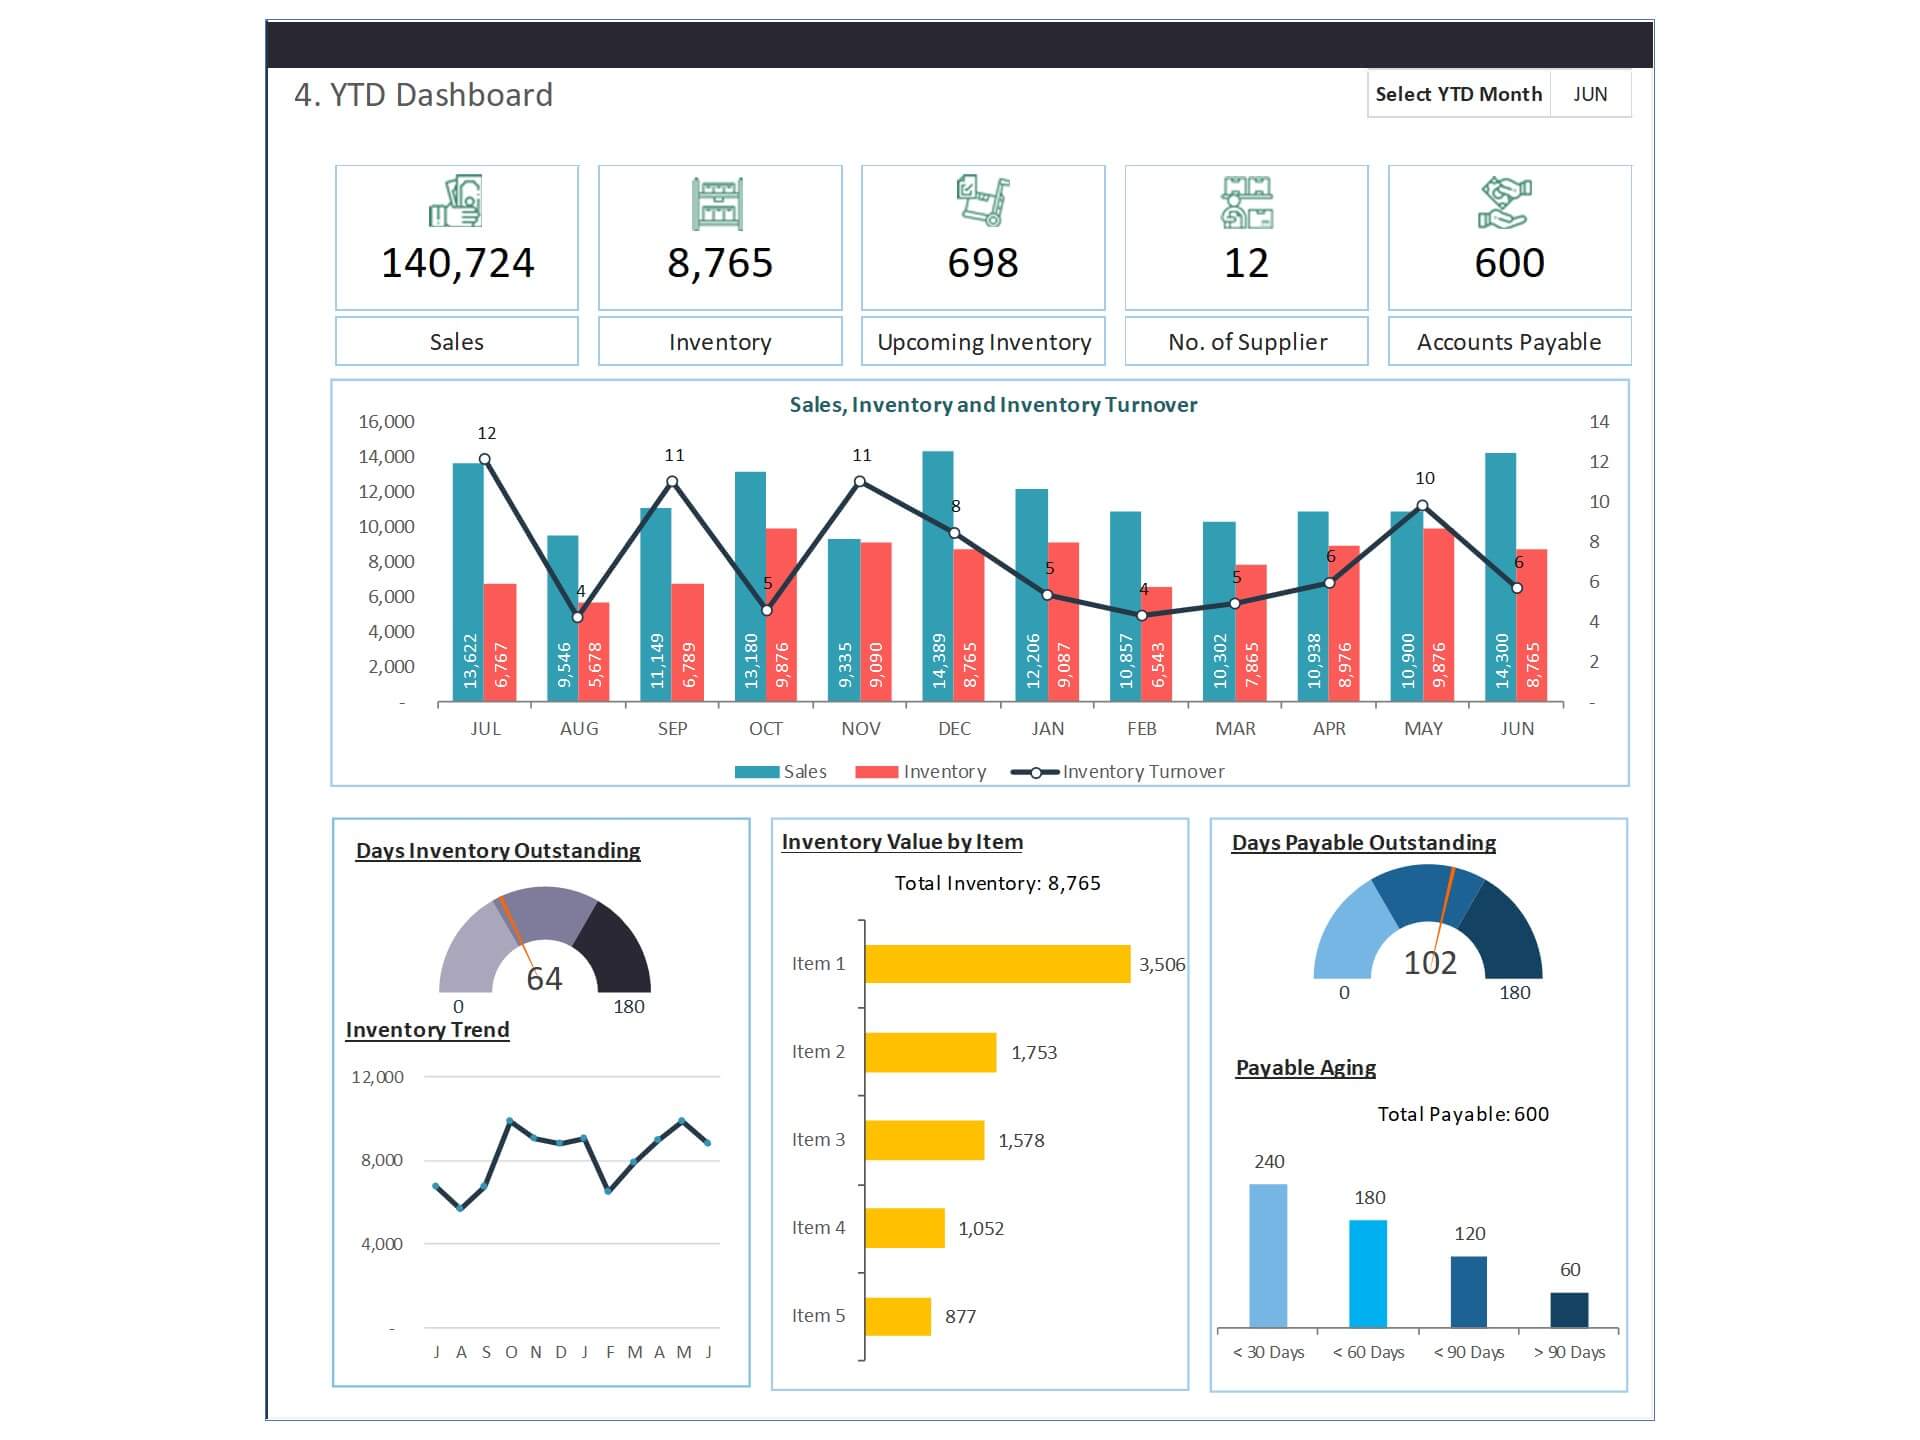
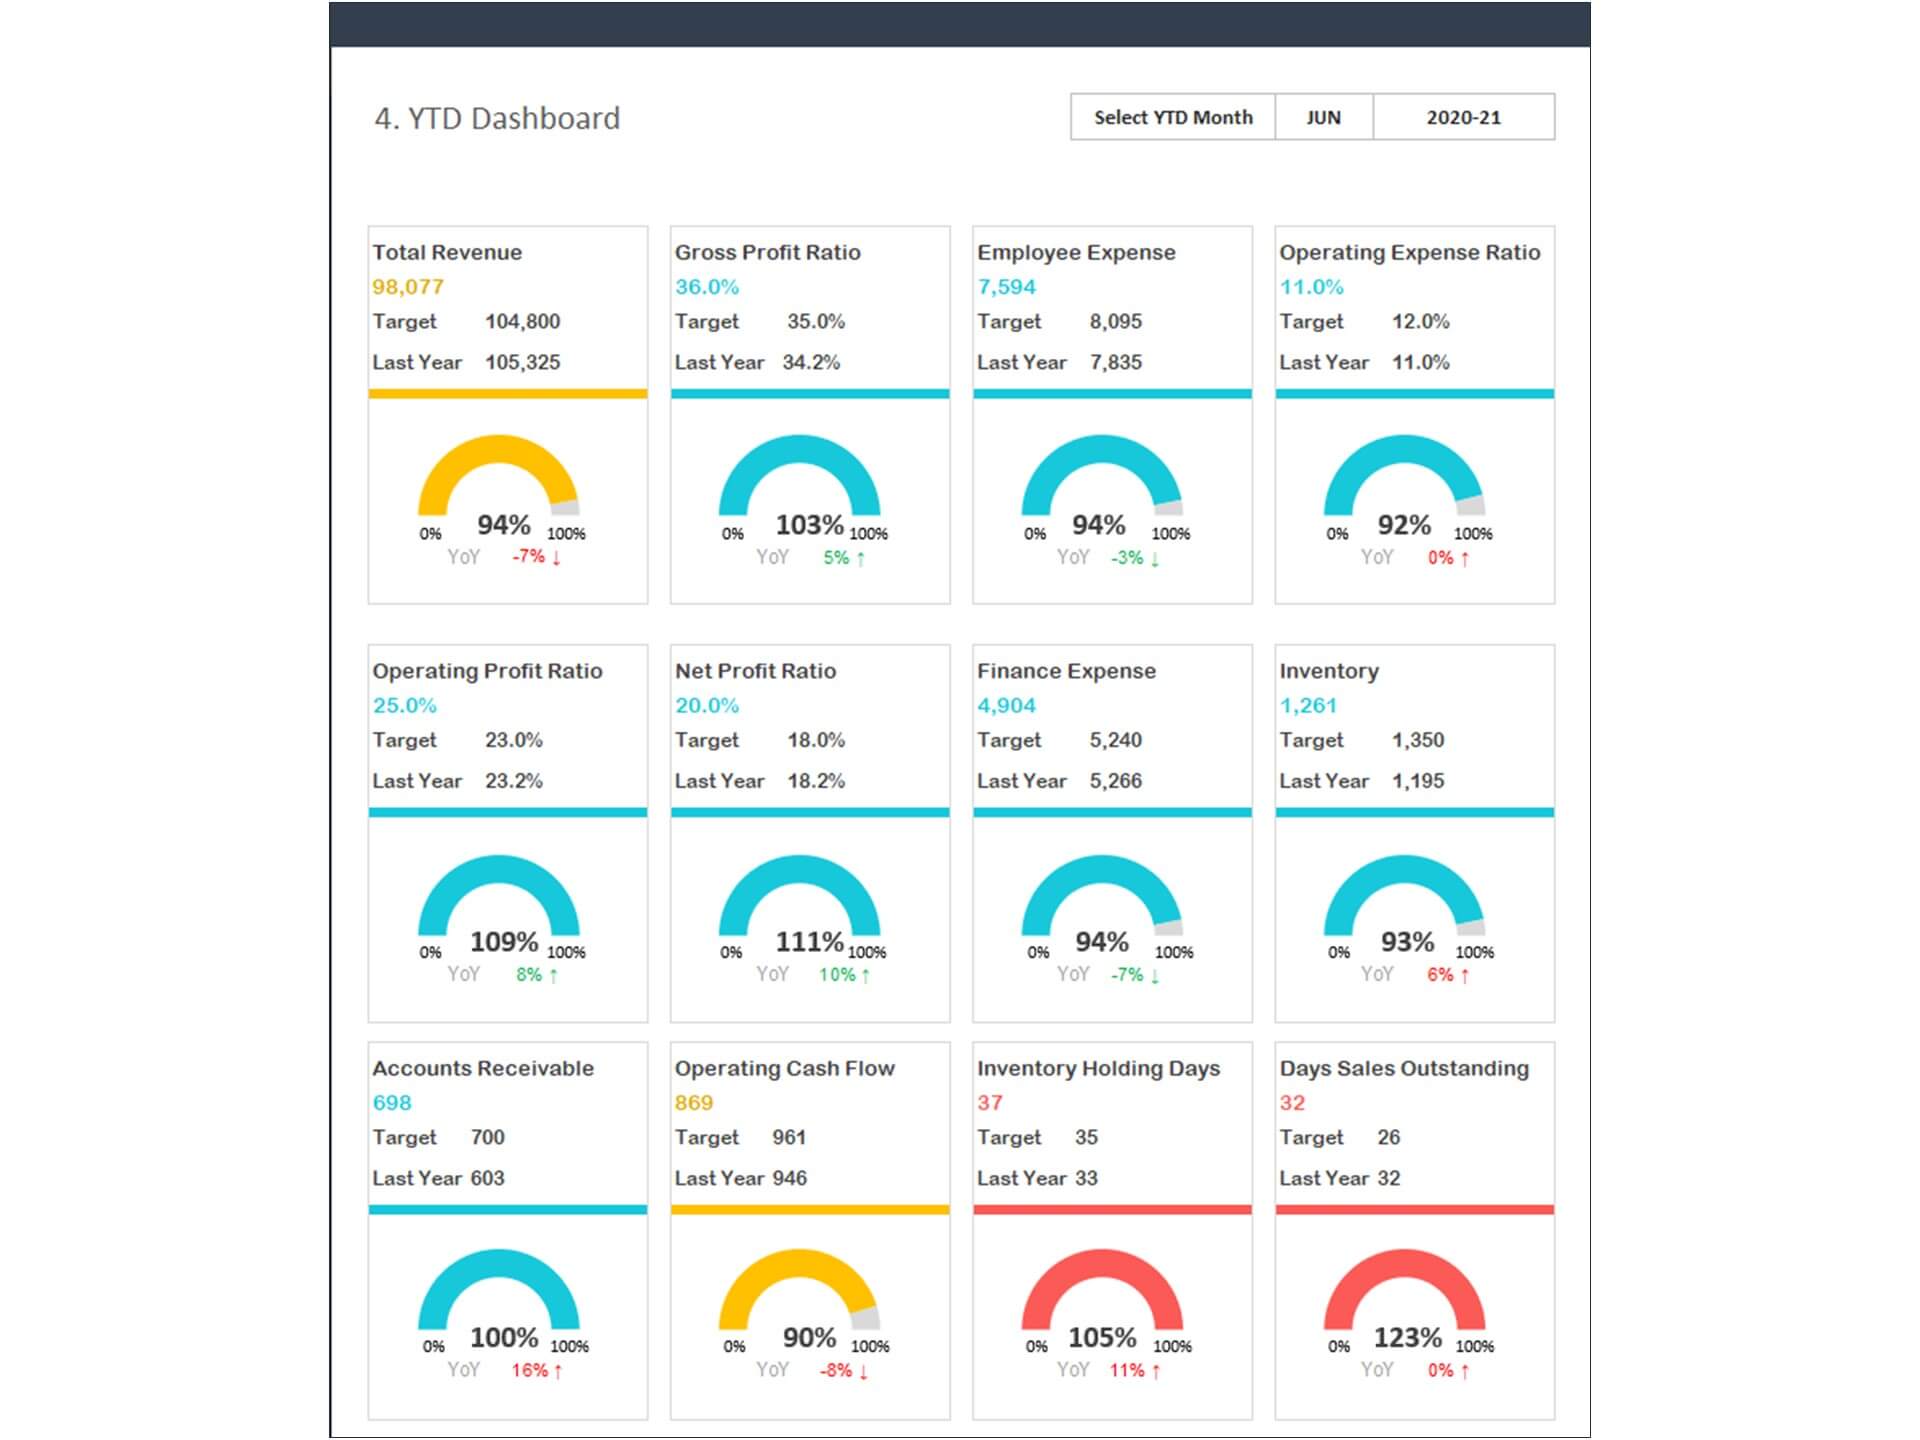
- Go to ‘YTD Dashboard’ menu - select month name from the drop-down to see the year-to-date picture of performance indicators
- Each page is ready for printing – just press CTRL+P
This Excel dashboard template is password-protected to avoid mistakes, such as accidentally deleting formulas. When you completed the purchase, the password will be available.