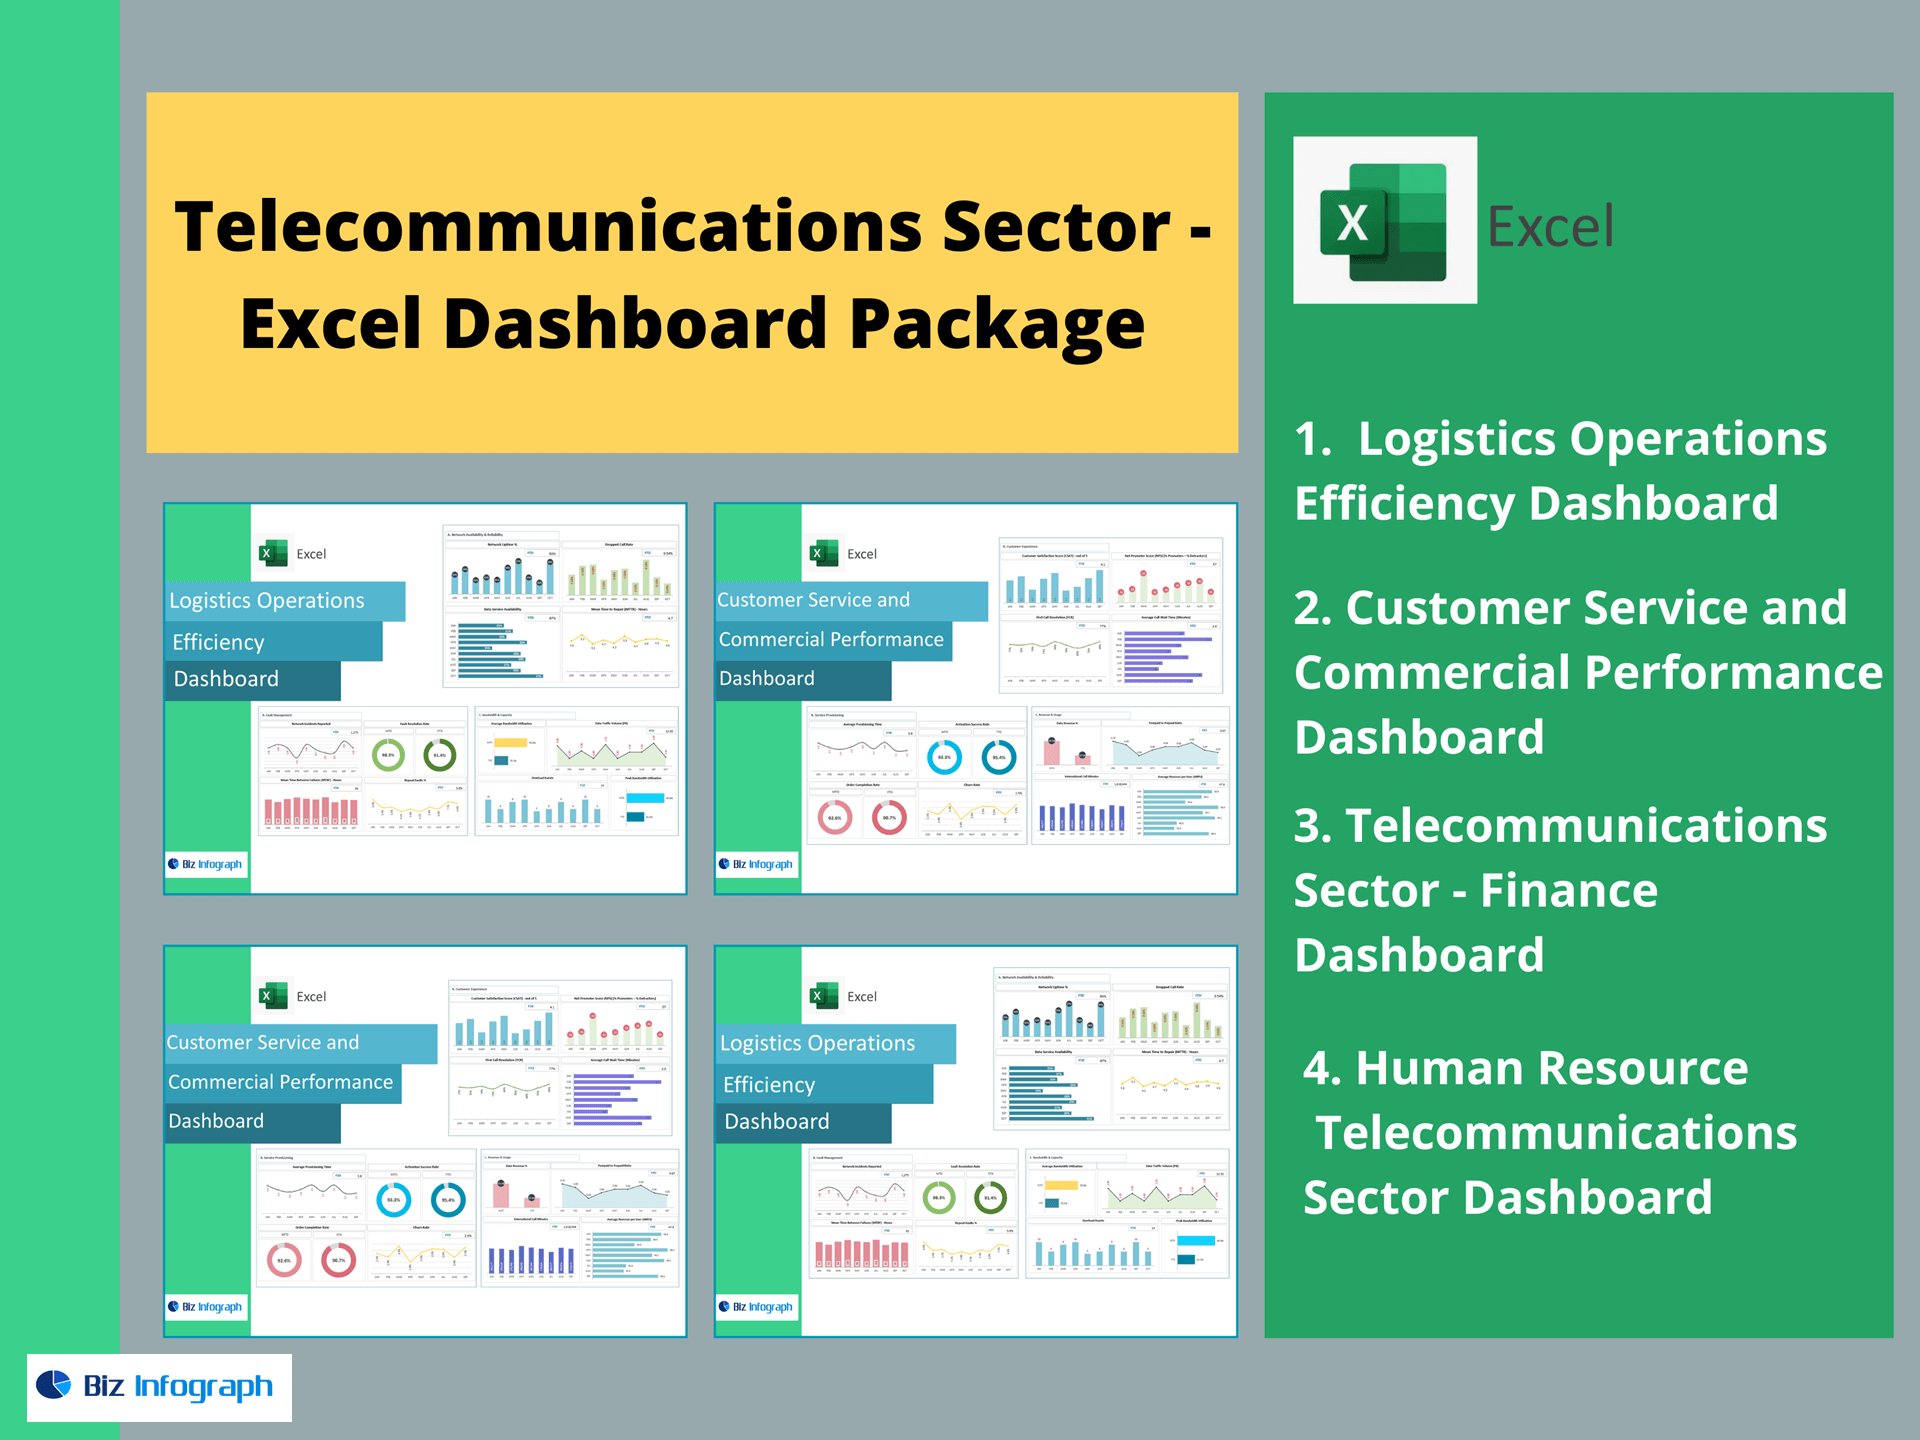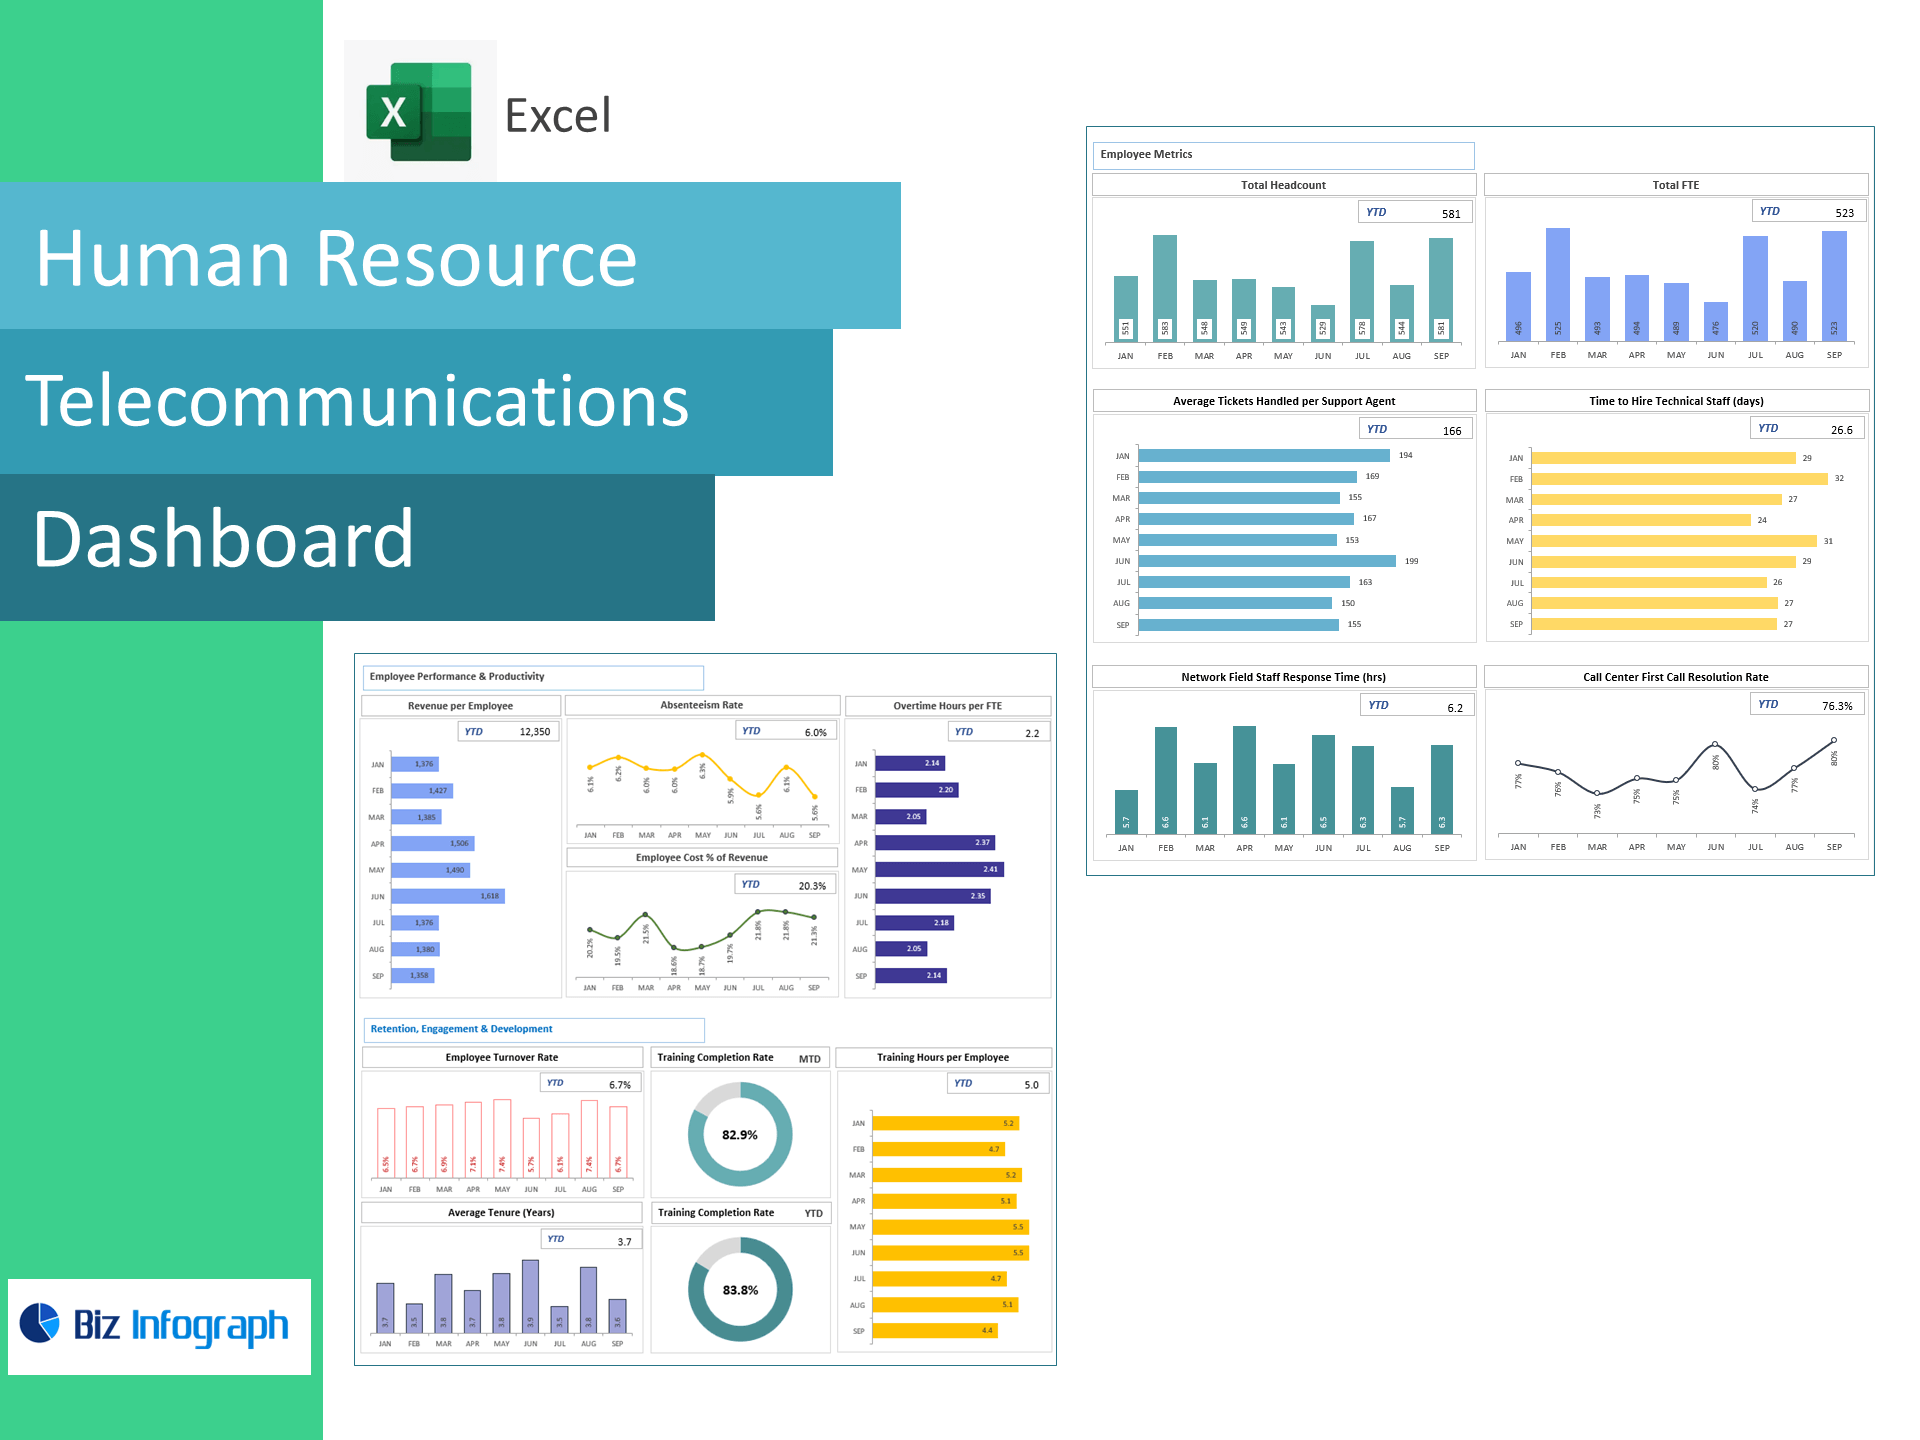
HR Telecommunications Dashboard — Excel Template
A plug-and-play Excel HR analytics dashboard for telecom companies. Track support productivity, field response, call-center FCR, hiring velocity, absenteeism, overtime, labor cost, retention, and training—in one clean workbook. No add-ins. No macros. Ready in minutes.
Who it’s for
HR leaders, Contact Center Managers, Network Ops, and People Analytics teams at mobile, ISP, and fiber providers who want telecom-specific HR KPIs without building a model from scratch.
What you get
-
Interactive dashboard: filters by site, team (Support, Field, Call Center), and period.
-
Structured data sheets: paste weekly/monthly exports and refresh.
-
Targets & RAG status: instant red/amber/green against your goals.
-
Print-ready views: export to PDF for executive reviews.
Built-in KPIs (with formulas)
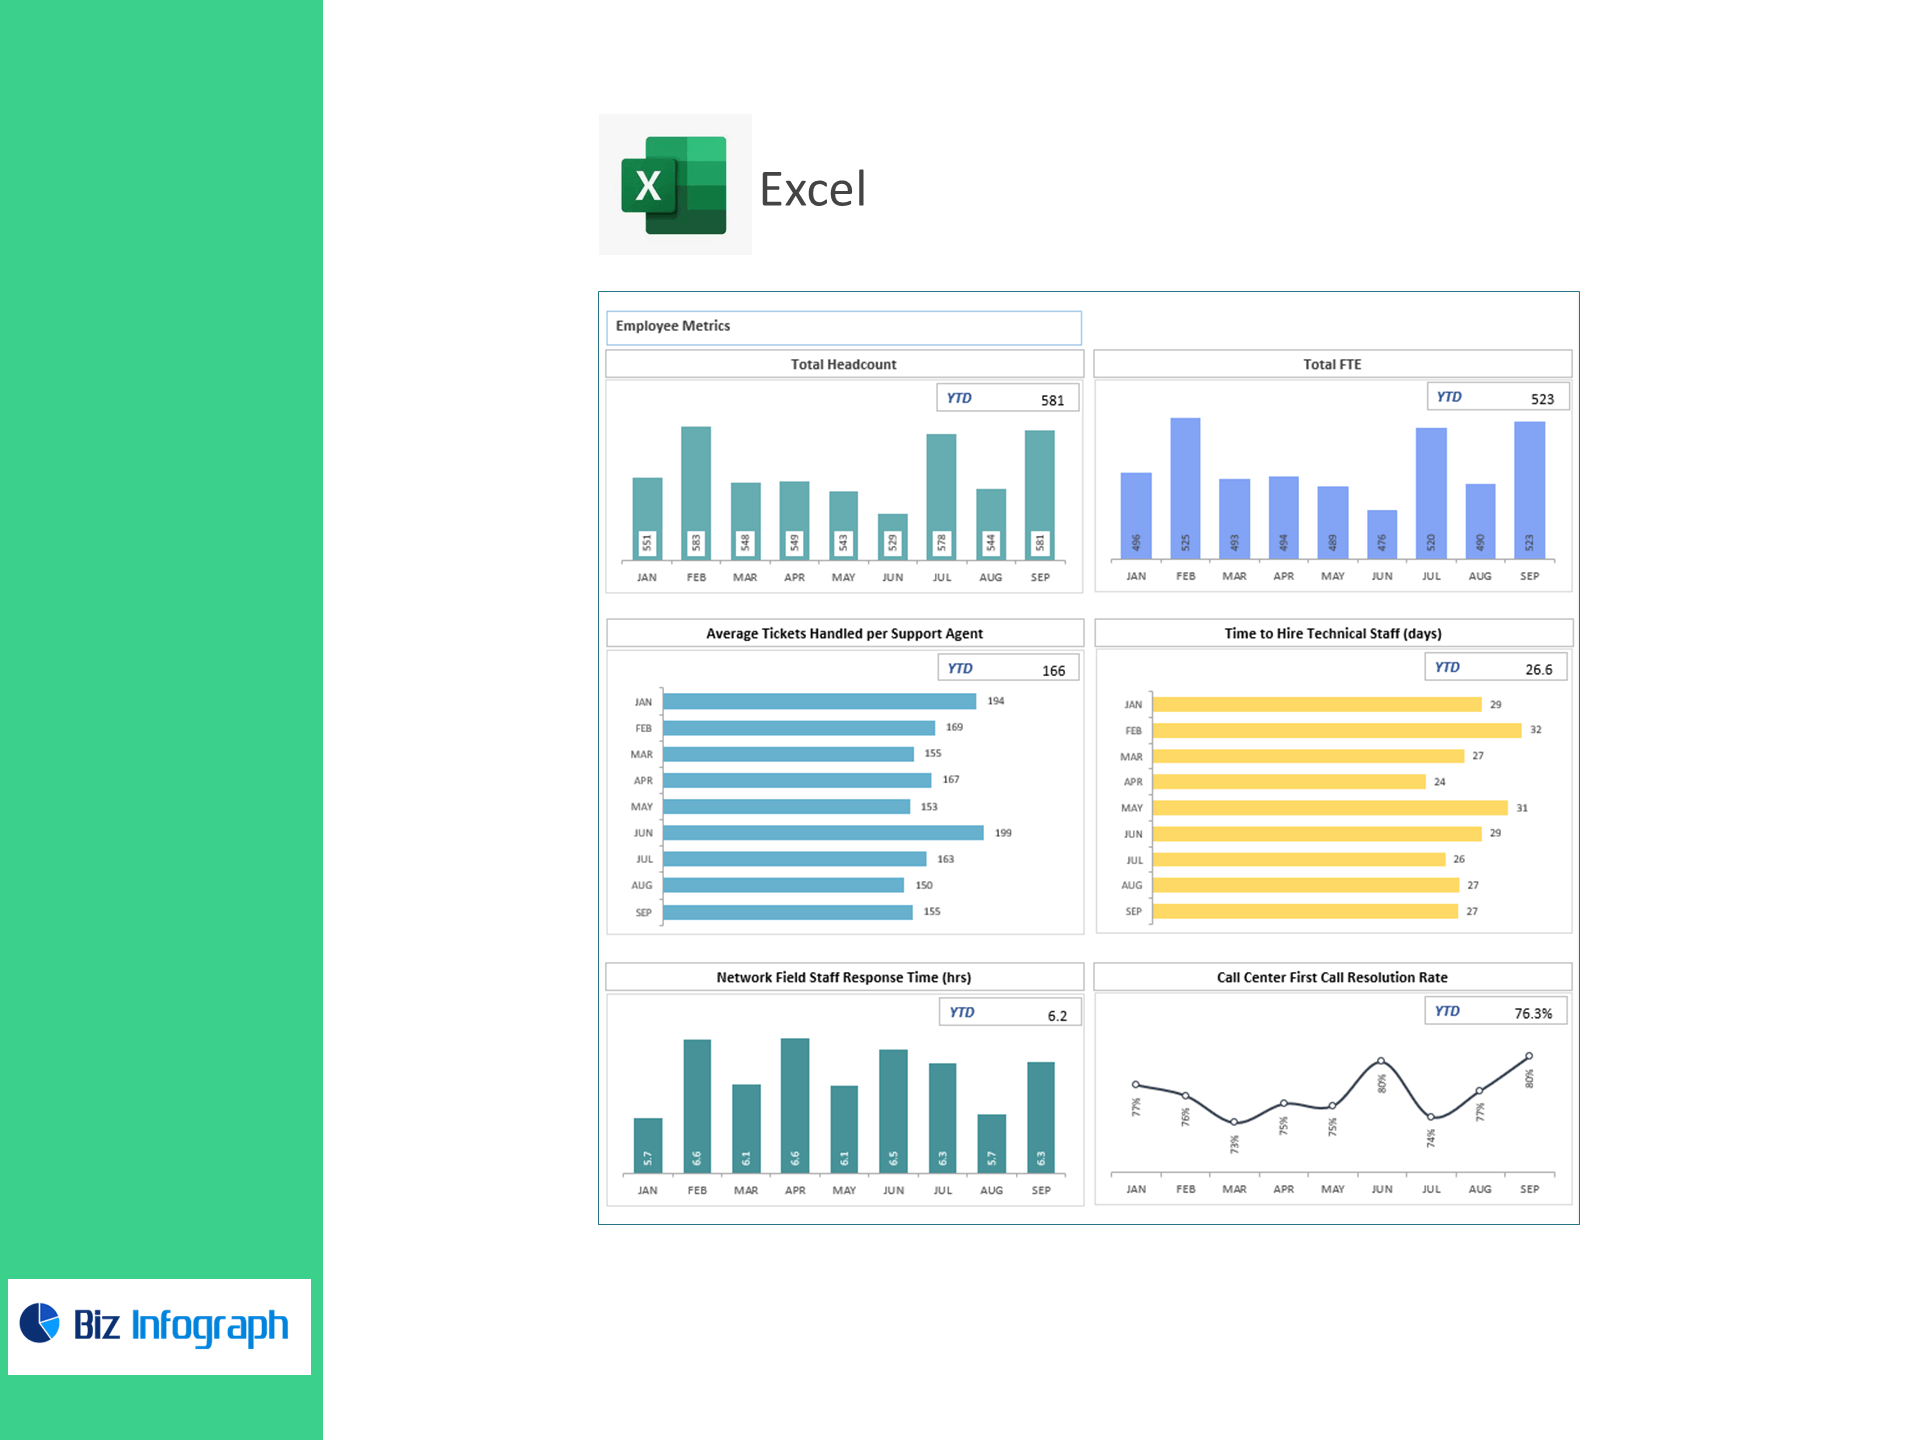
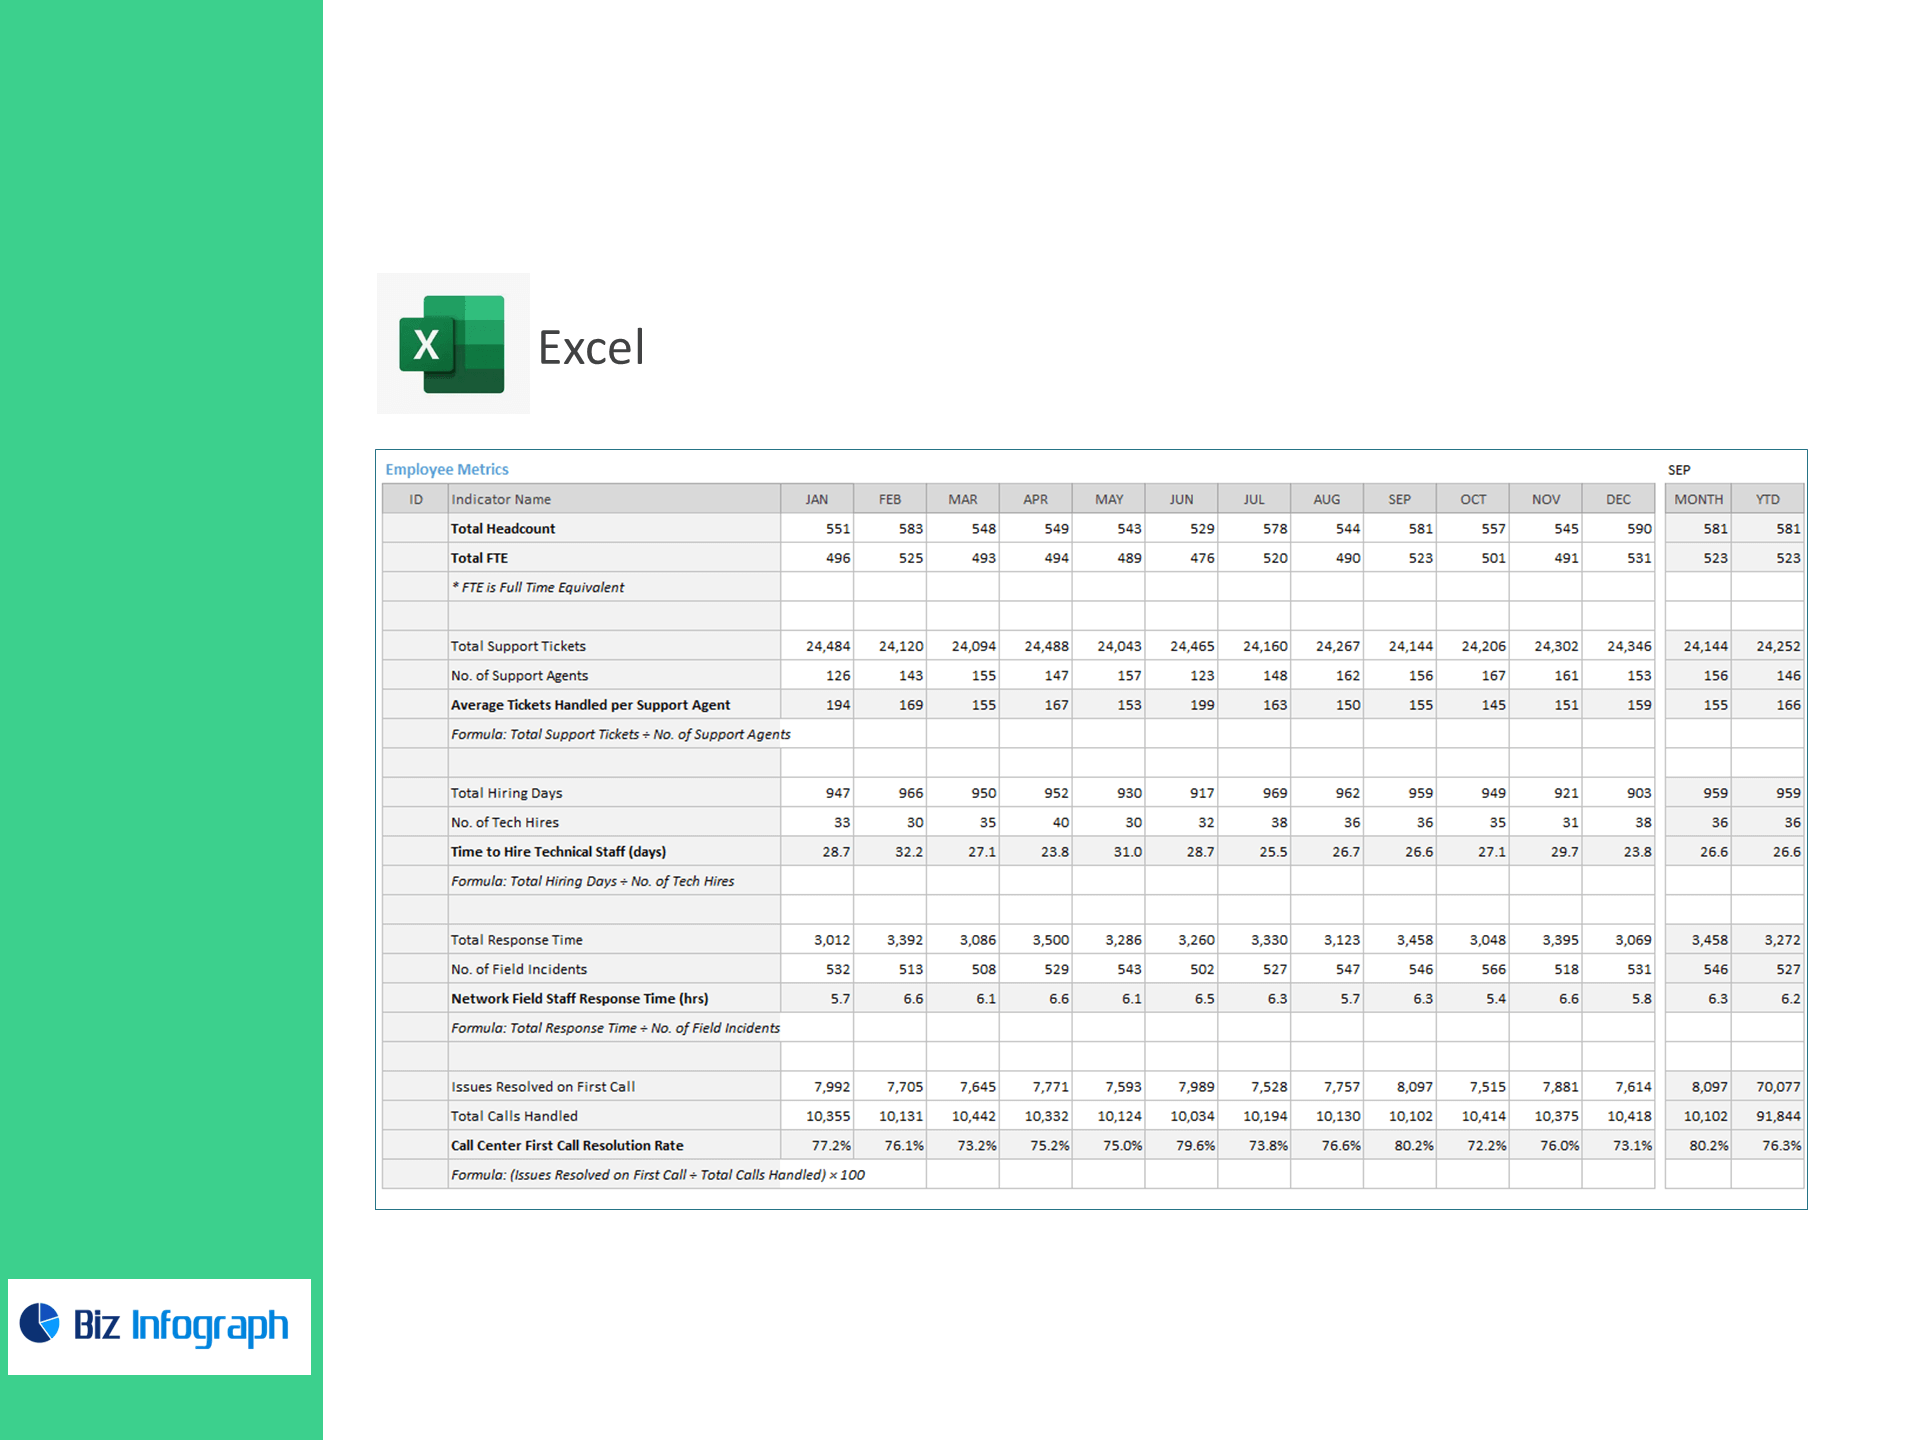
Employee Metrics
-
Total Headcount
-
Total FTE (Full-Time Equivalent)
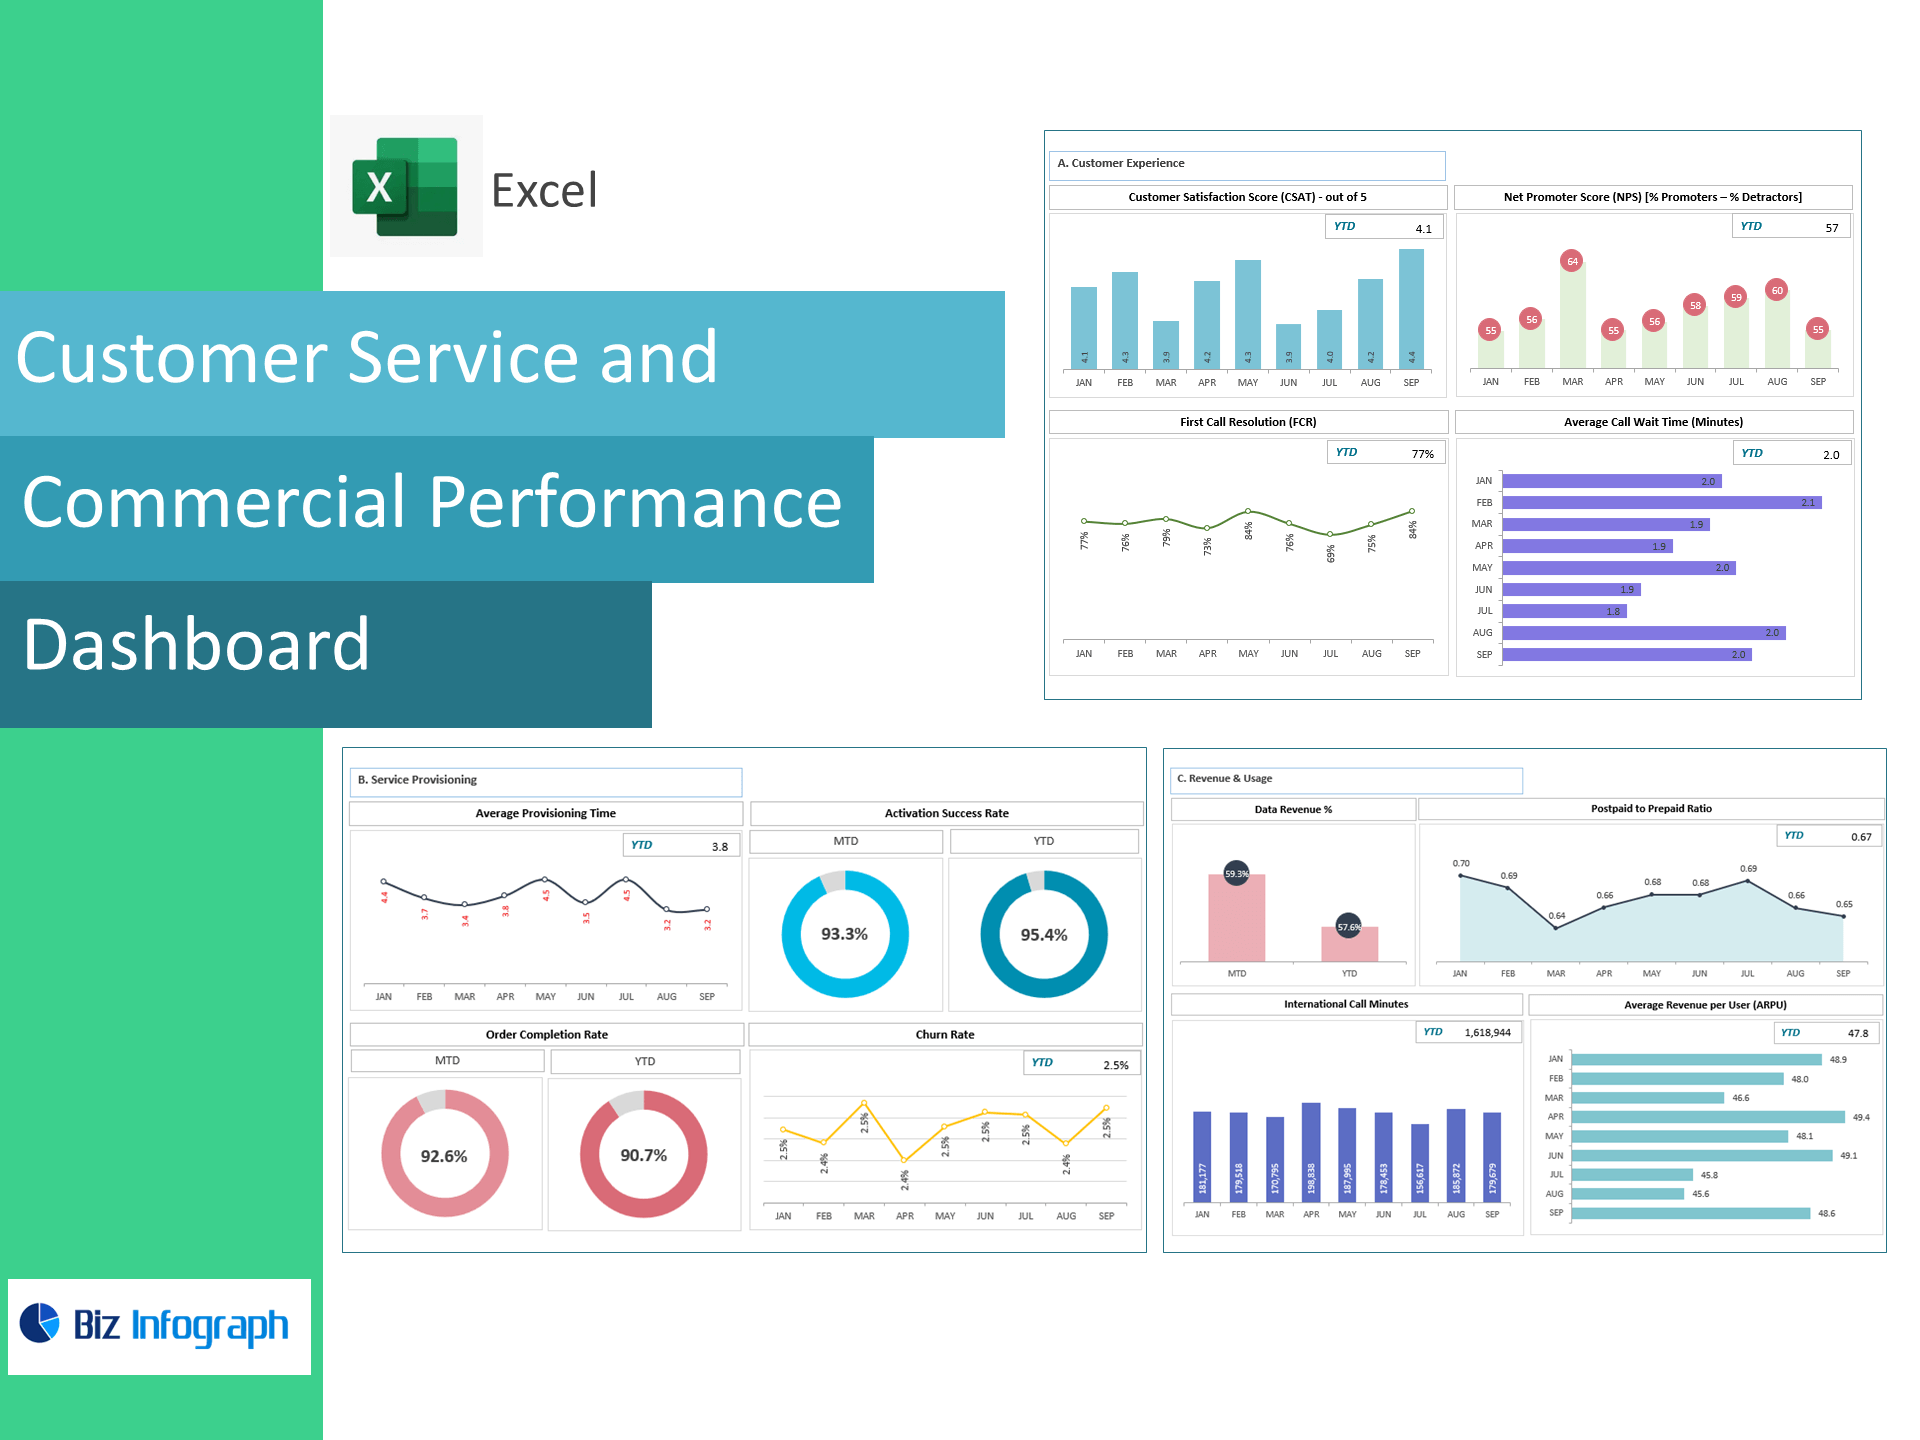
Support & Call-Center Productivity
-
Average Tickets per Support Agent
Total Support Tickets ÷ No. of Support Agents -
Call Center First Call Resolution Rate (%)
(Issues Resolved on First Call ÷ Total Calls Handled) × 100
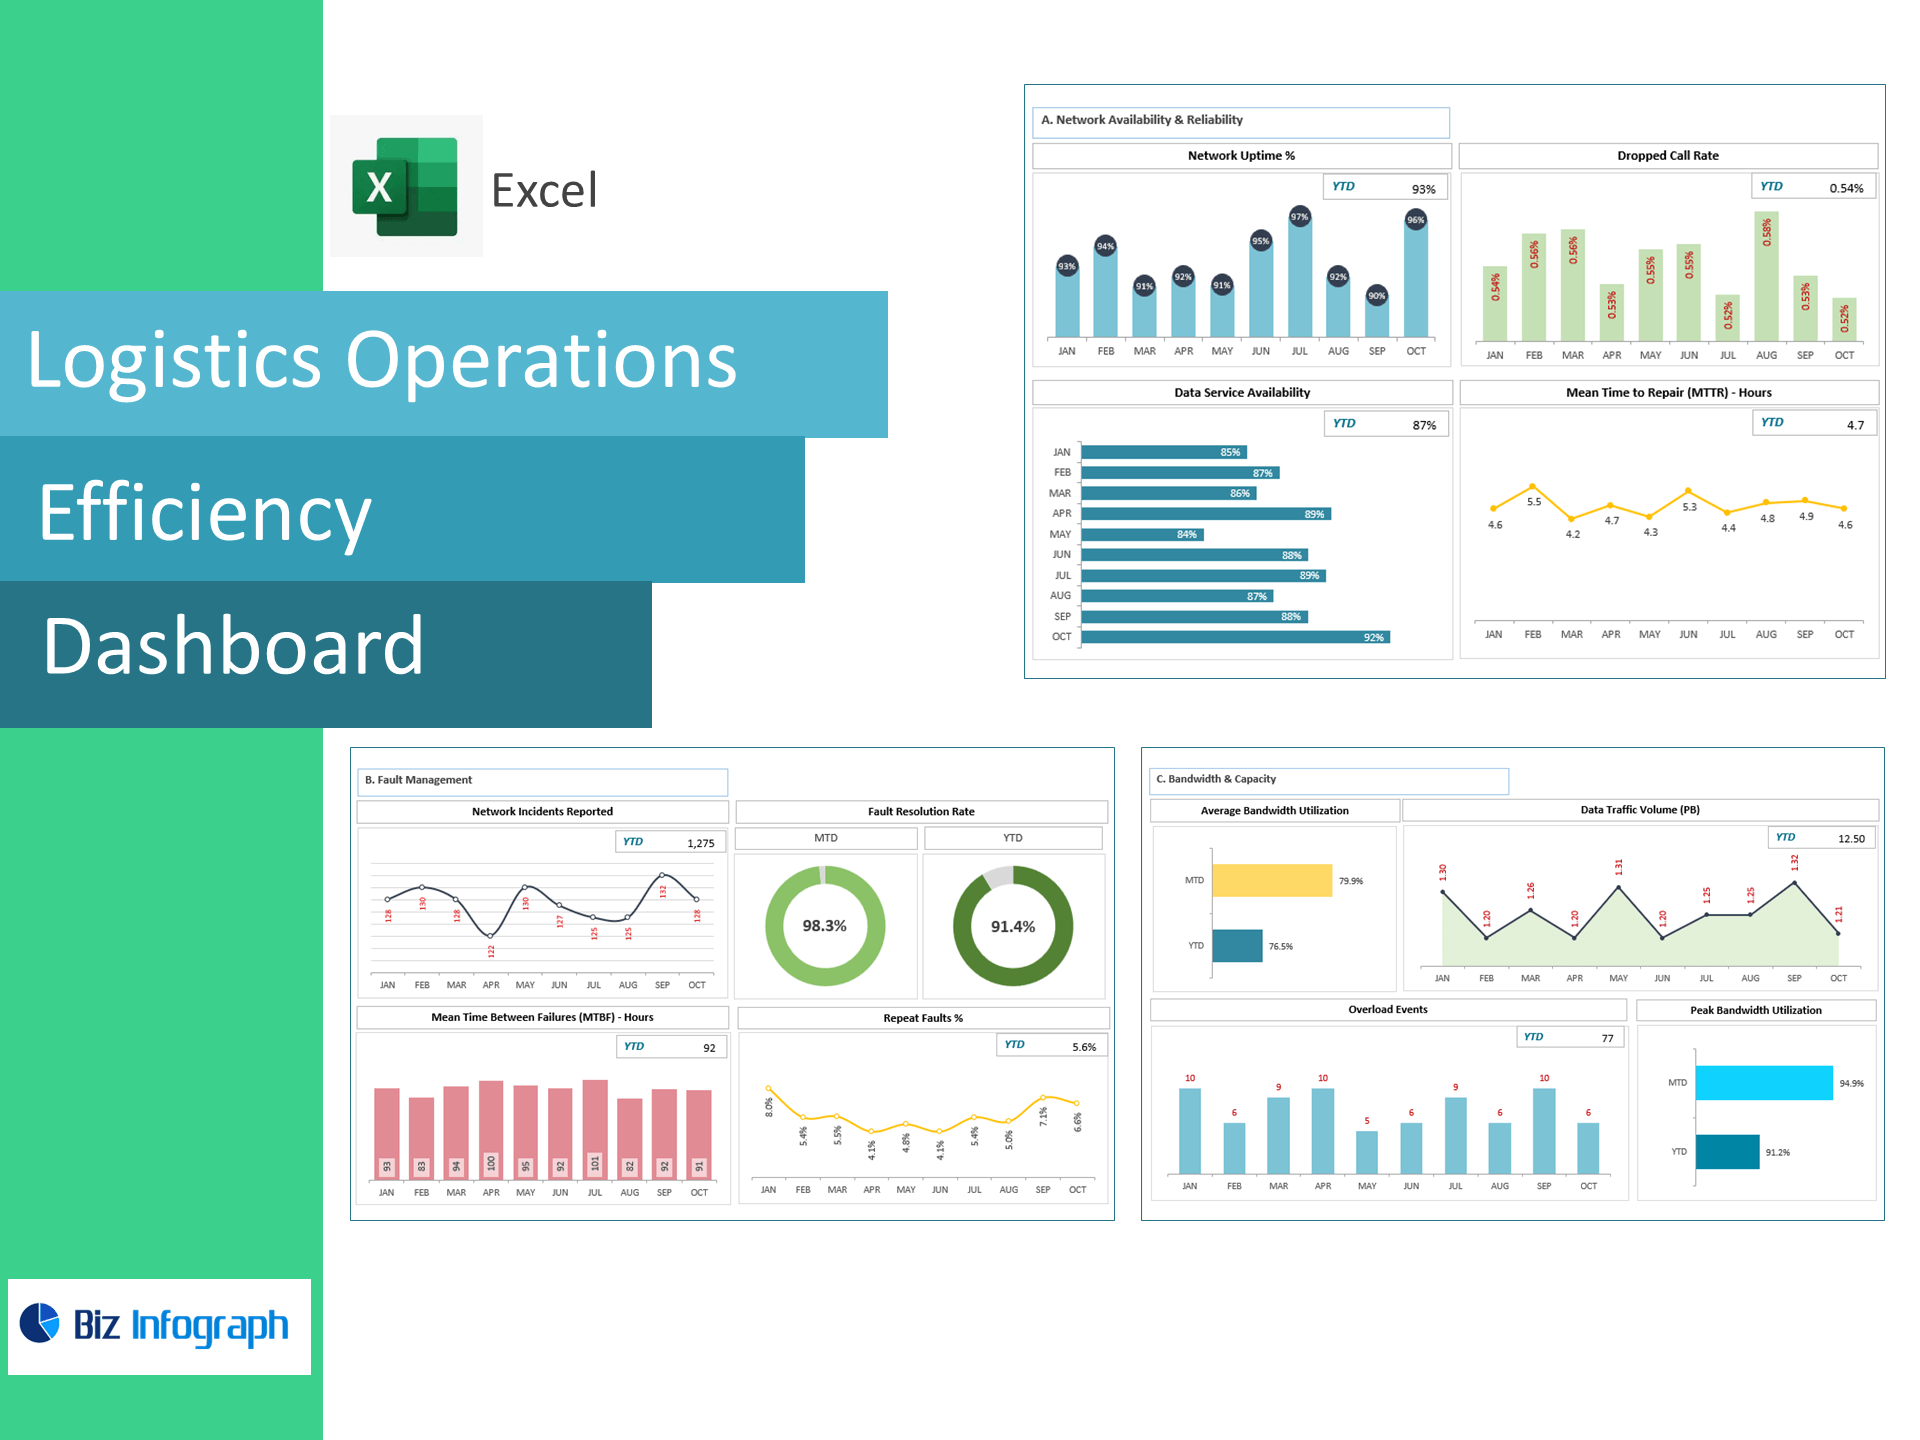
Network Field Operations
-
Network Field Staff Response Time (hrs)
Total Response Time ÷ No. of Field Incidents
Hiring Velocity
-
Time to Hire Technical Staff (days)
Total Hiring Days ÷ No. of Tech Hires
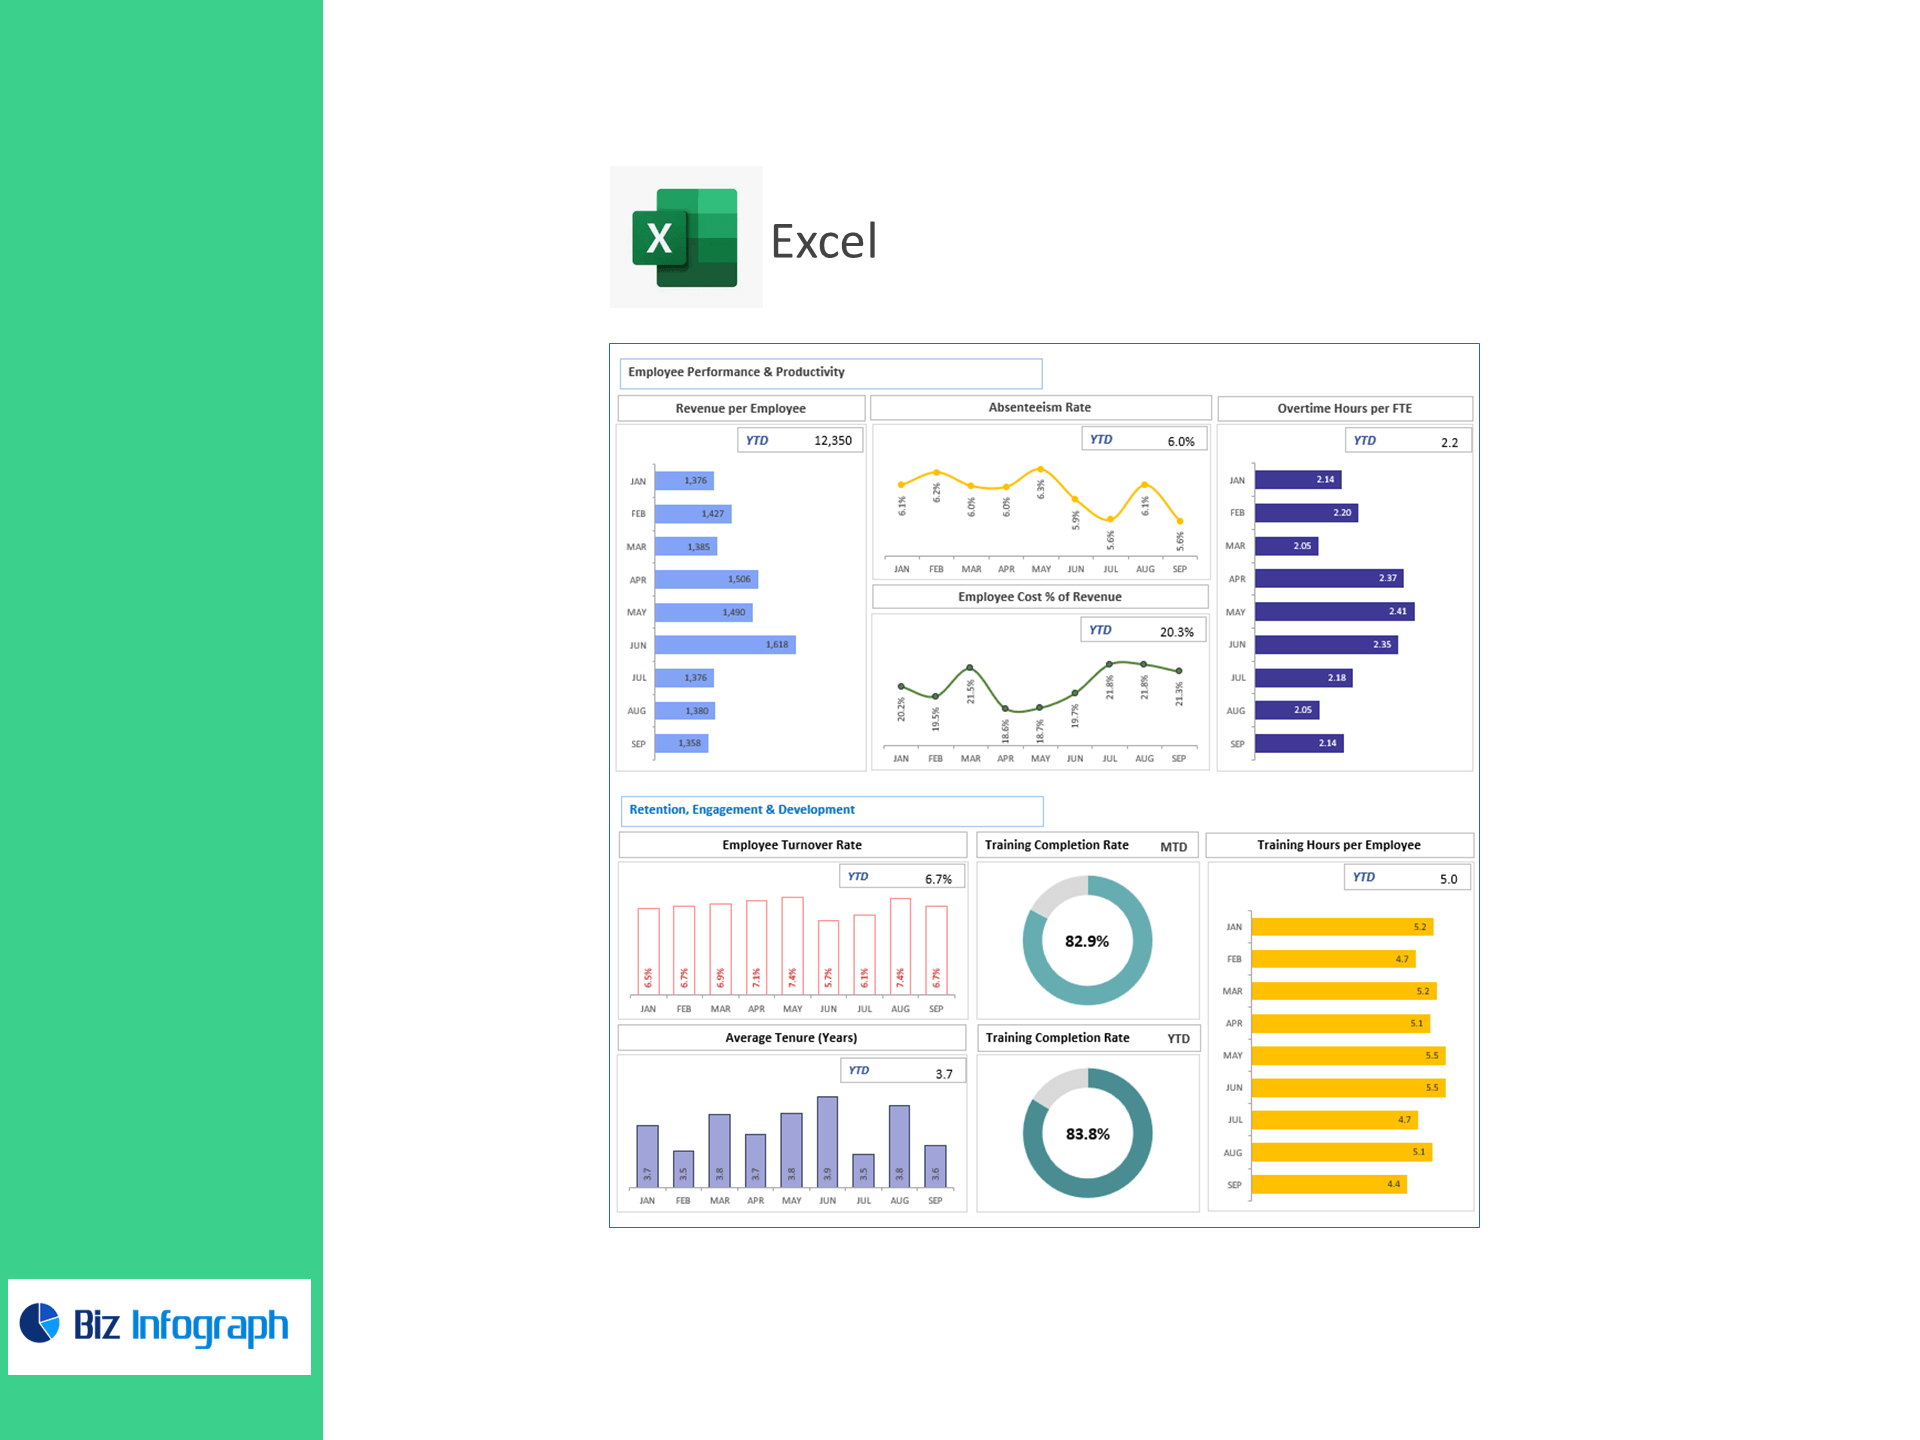
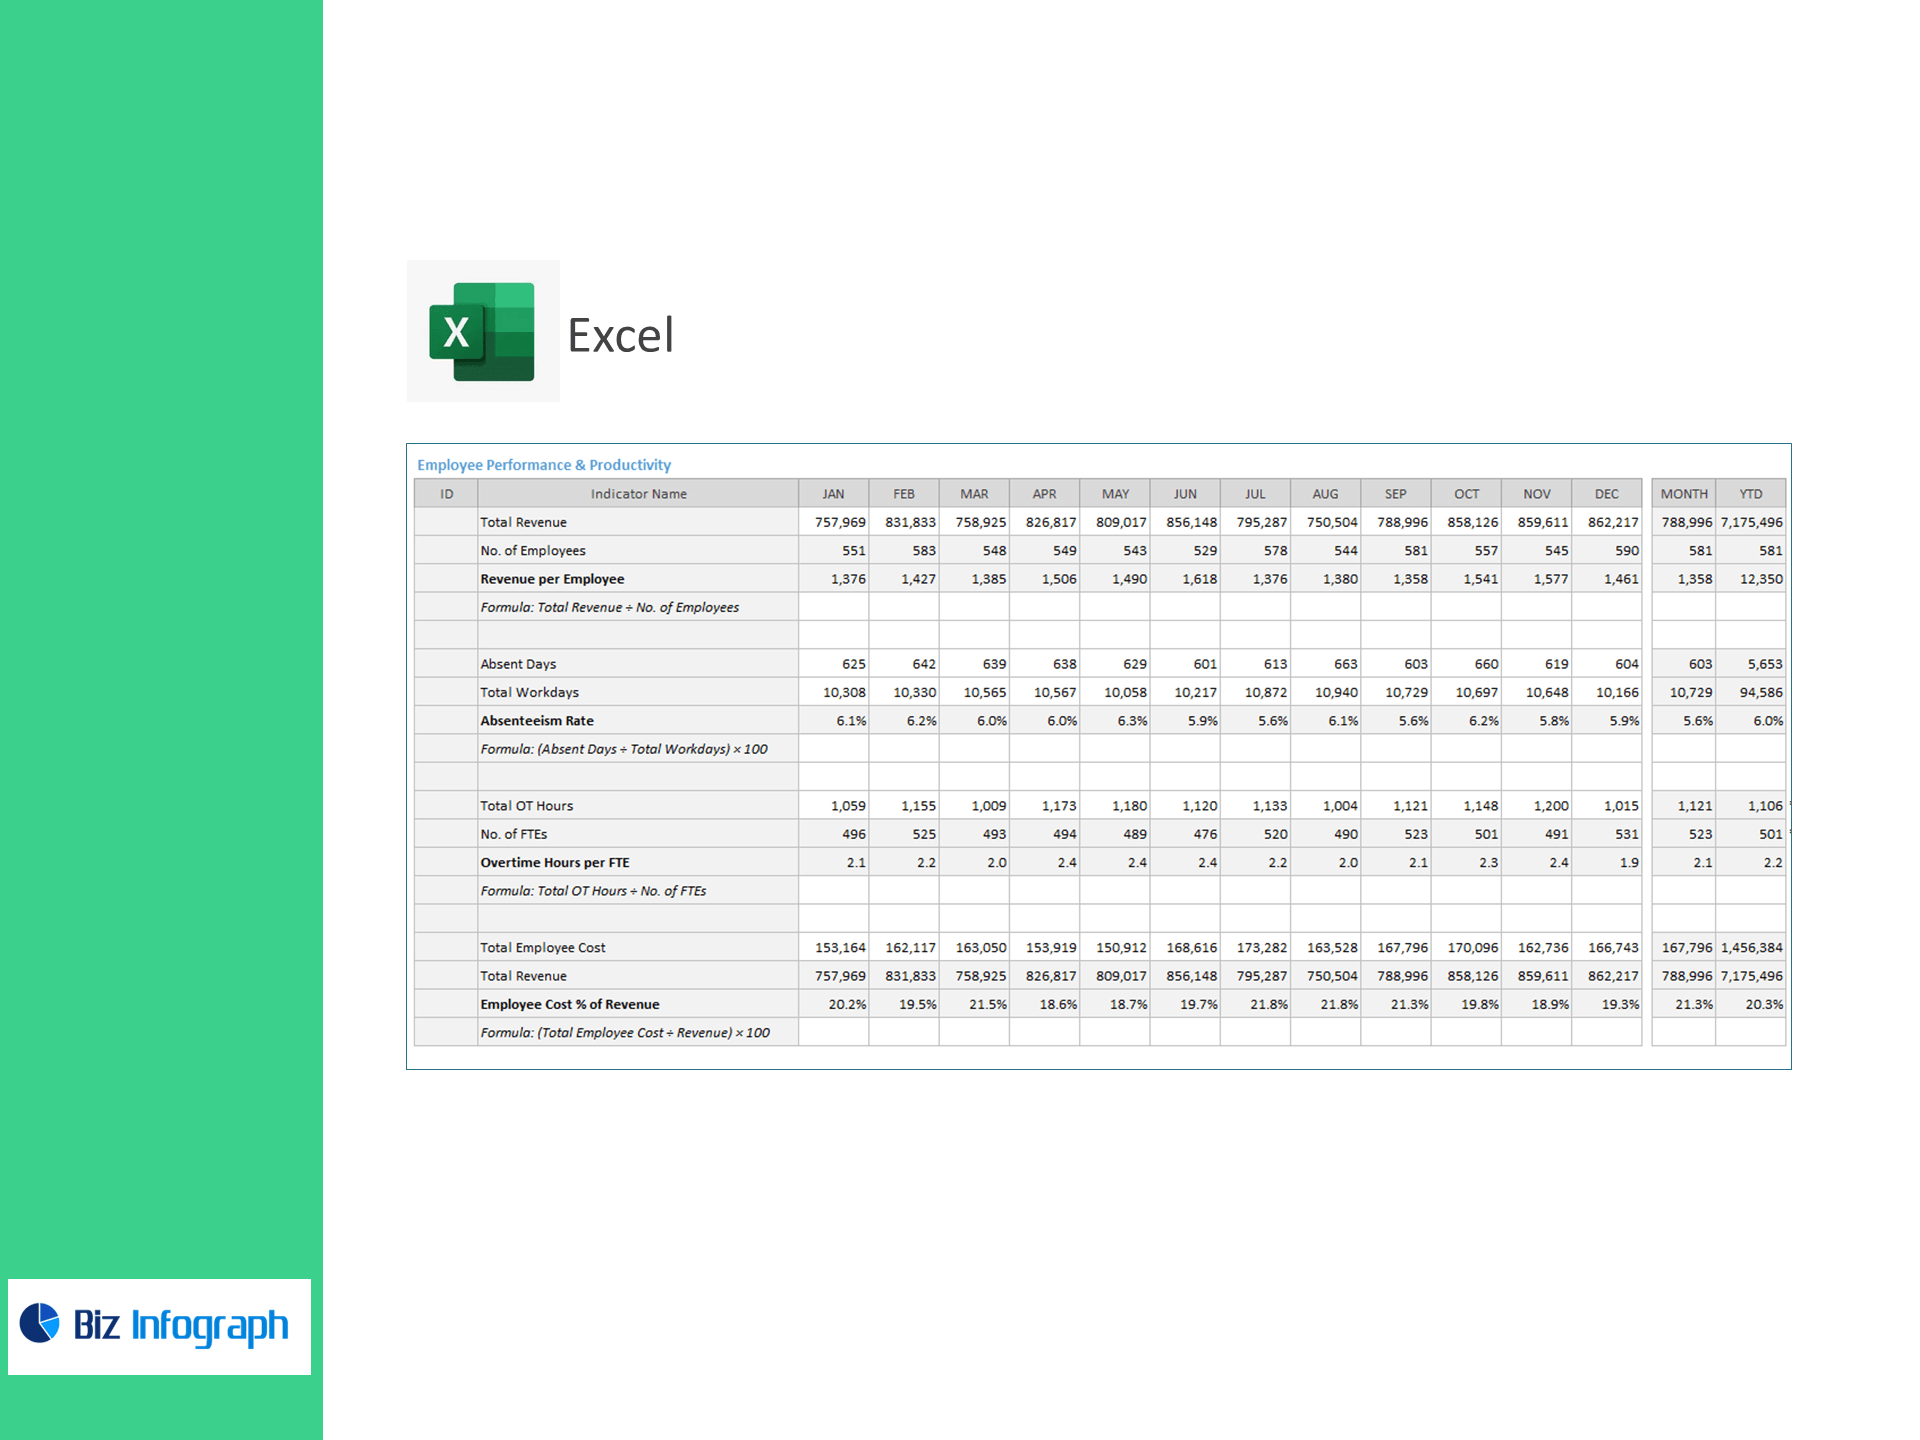
Employee Performance & Productivity
-
Revenue per Employee
Total Revenue ÷ No. of Employees
Attendance & Overtime
-
Absenteeism Rate (%)
(Absent Days ÷ Total Workdays) × 100 -
Overtime Hours per FTE
Total OT Hours ÷ No. of FTEs
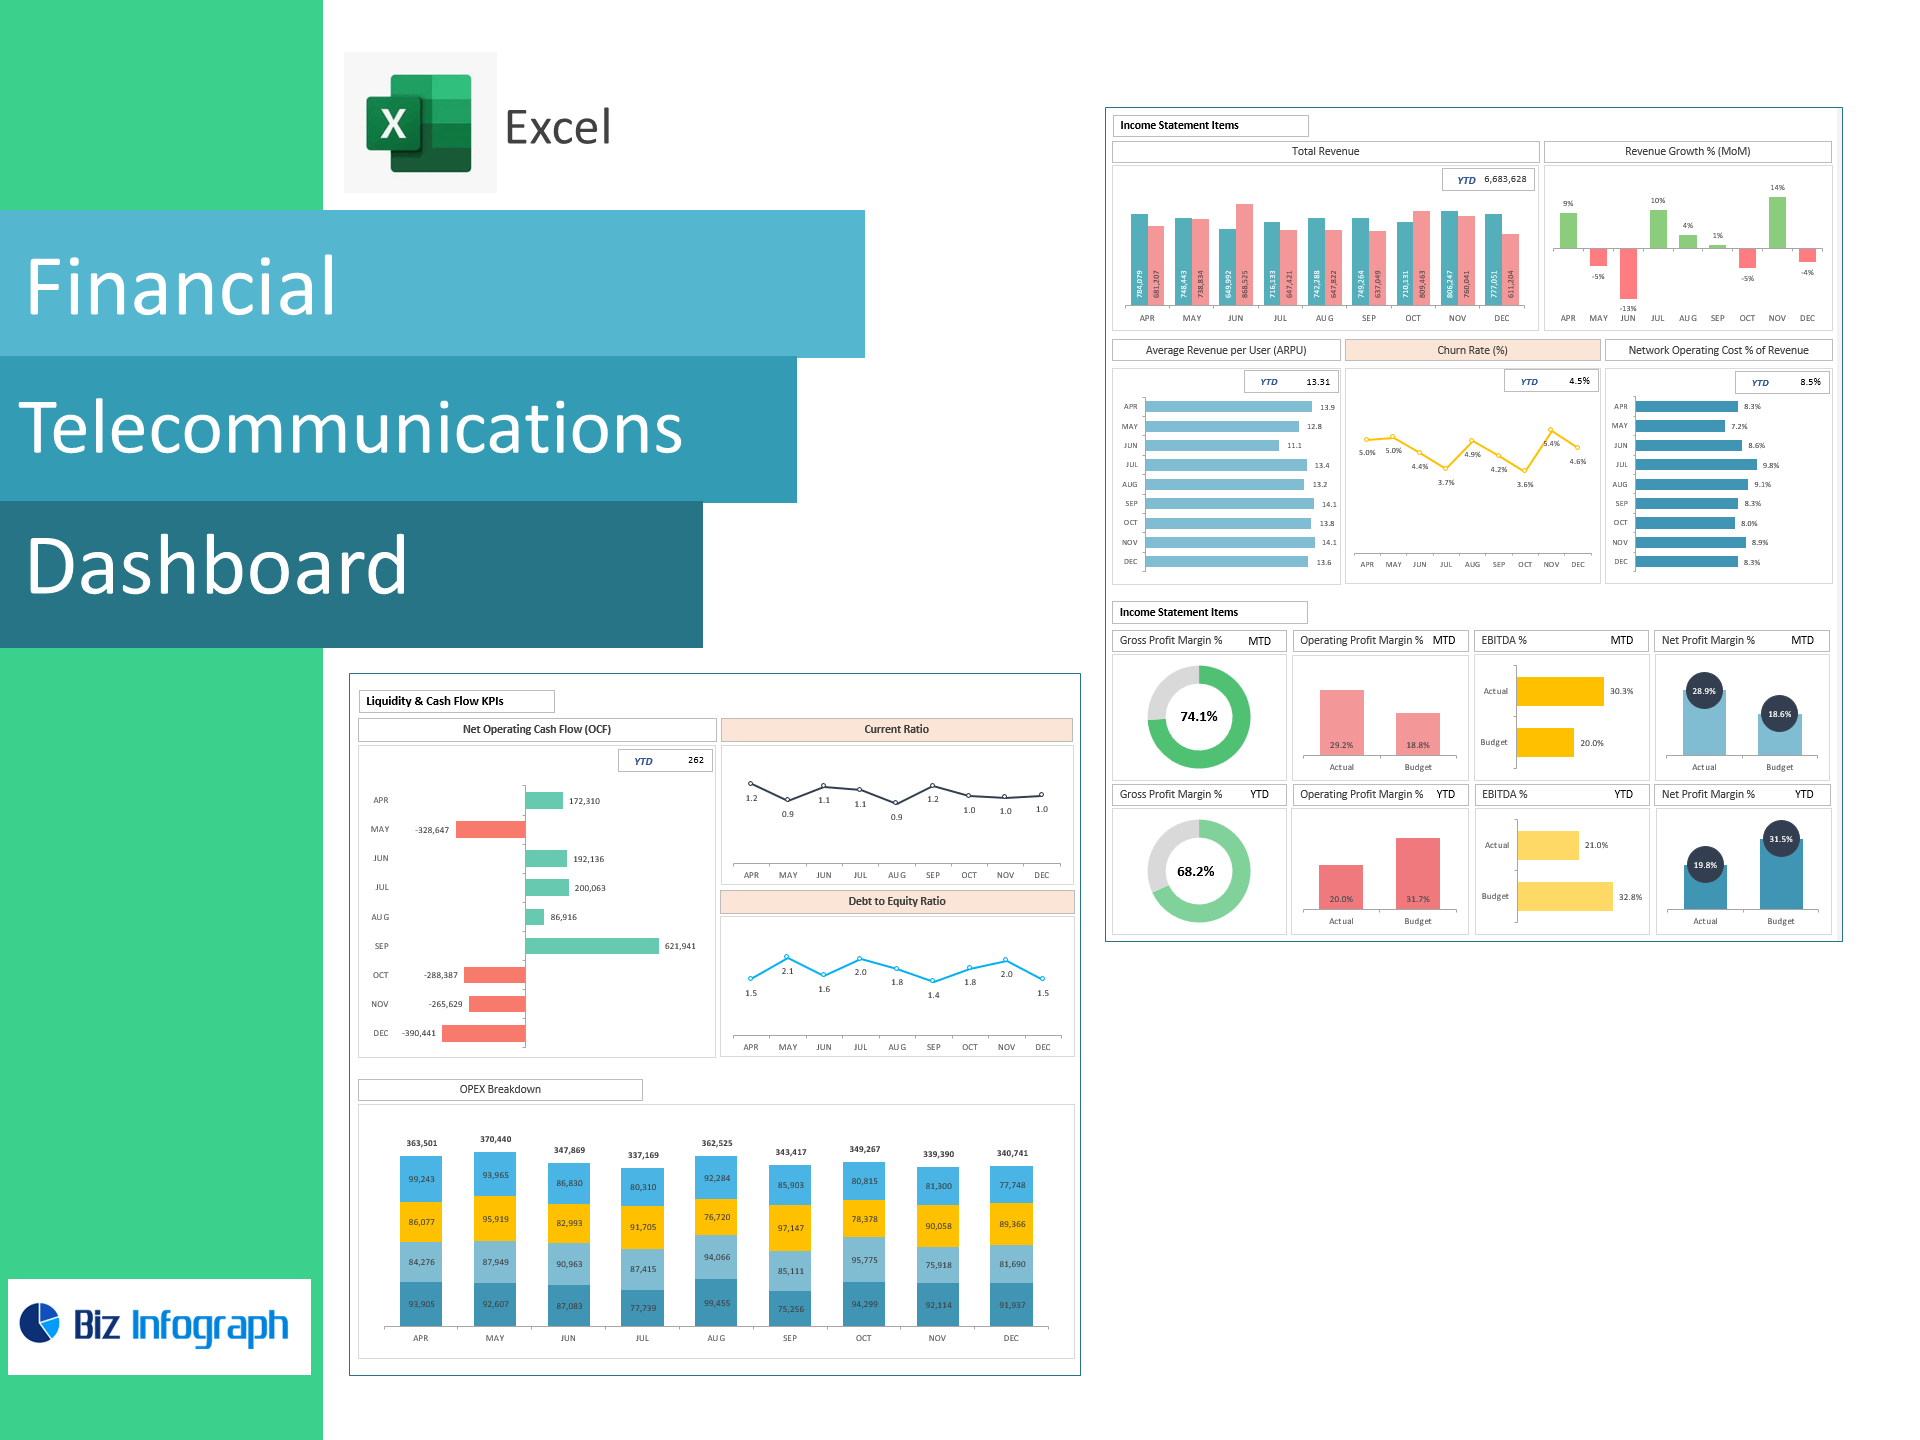
Cost Control
-
Employee Cost % of Revenue
(Total Employee Cost ÷ Revenue) × 100
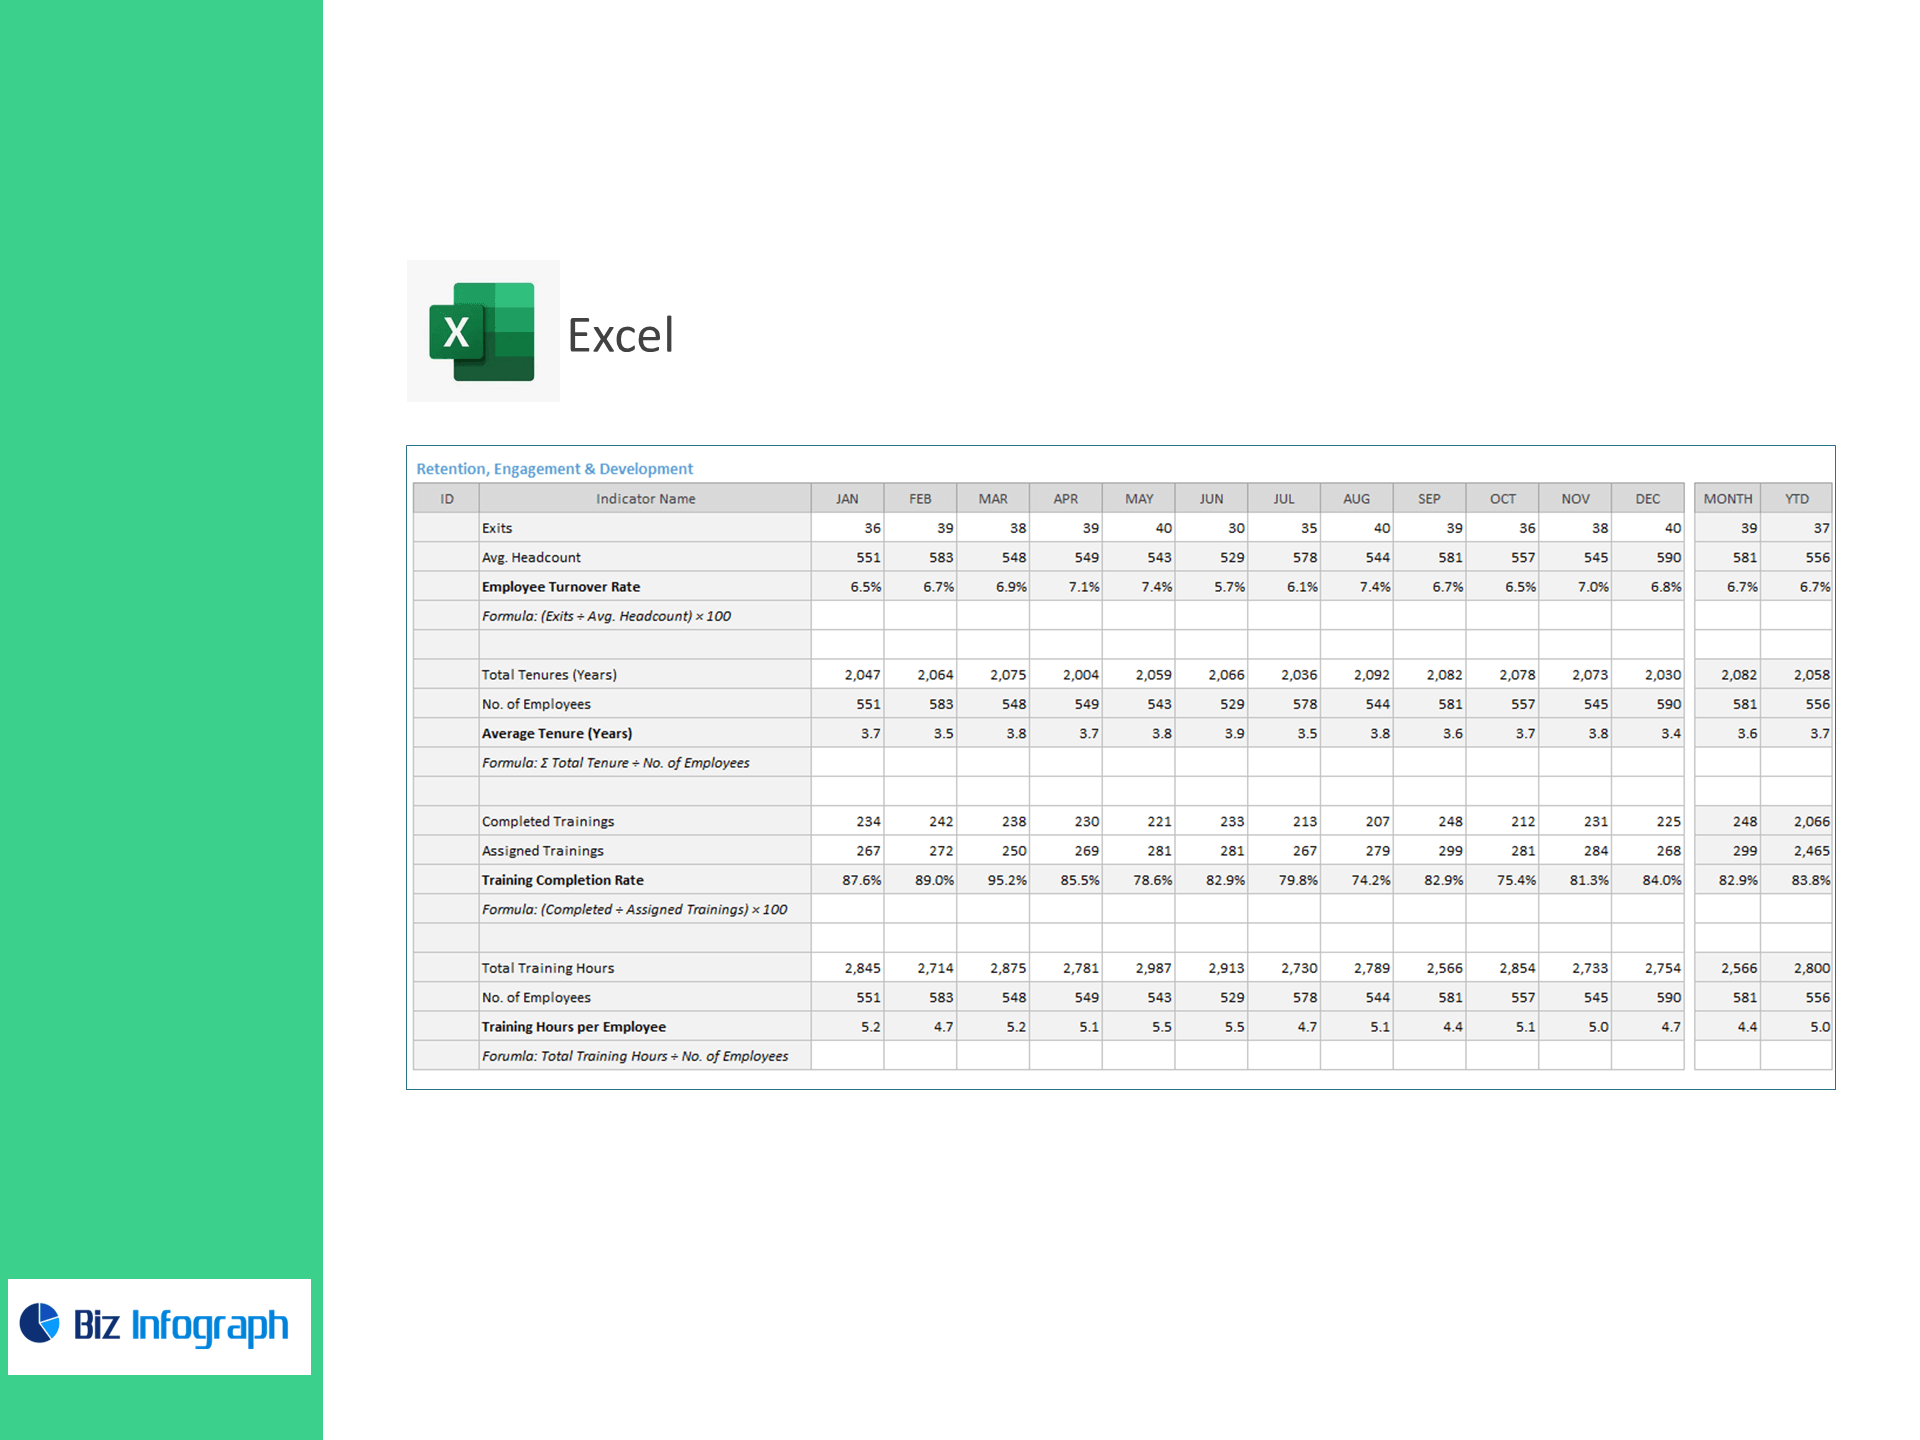
Retention & Experience
-
Employee Turnover Rate (%)
(Exits ÷ Avg. Headcount) × 100 -
Average Tenure (Years)
Σ Total Tenure ÷ No. of Employees
Learning & Compliance
-
Training Completion Rate (%)
(Completed Trainings ÷ Assigned Trainings) × 100 -
Training Hours per Employee
Total Training Hours ÷ No. of Employees
Why telecom teams choose this template
-
Connect HR to service KPIs: relate tickets/response/FCR to staffing, OT, and attrition.
-
Optimize coverage: see where absenteeism or slow hiring hits SLAs.
-
Control labor cost: monitor employee cost % of revenue and OT per FTE.
-
Improve retention & skills: track turnover, tenure, and training progress by team.
For ready-to-use Dashboard Templates: