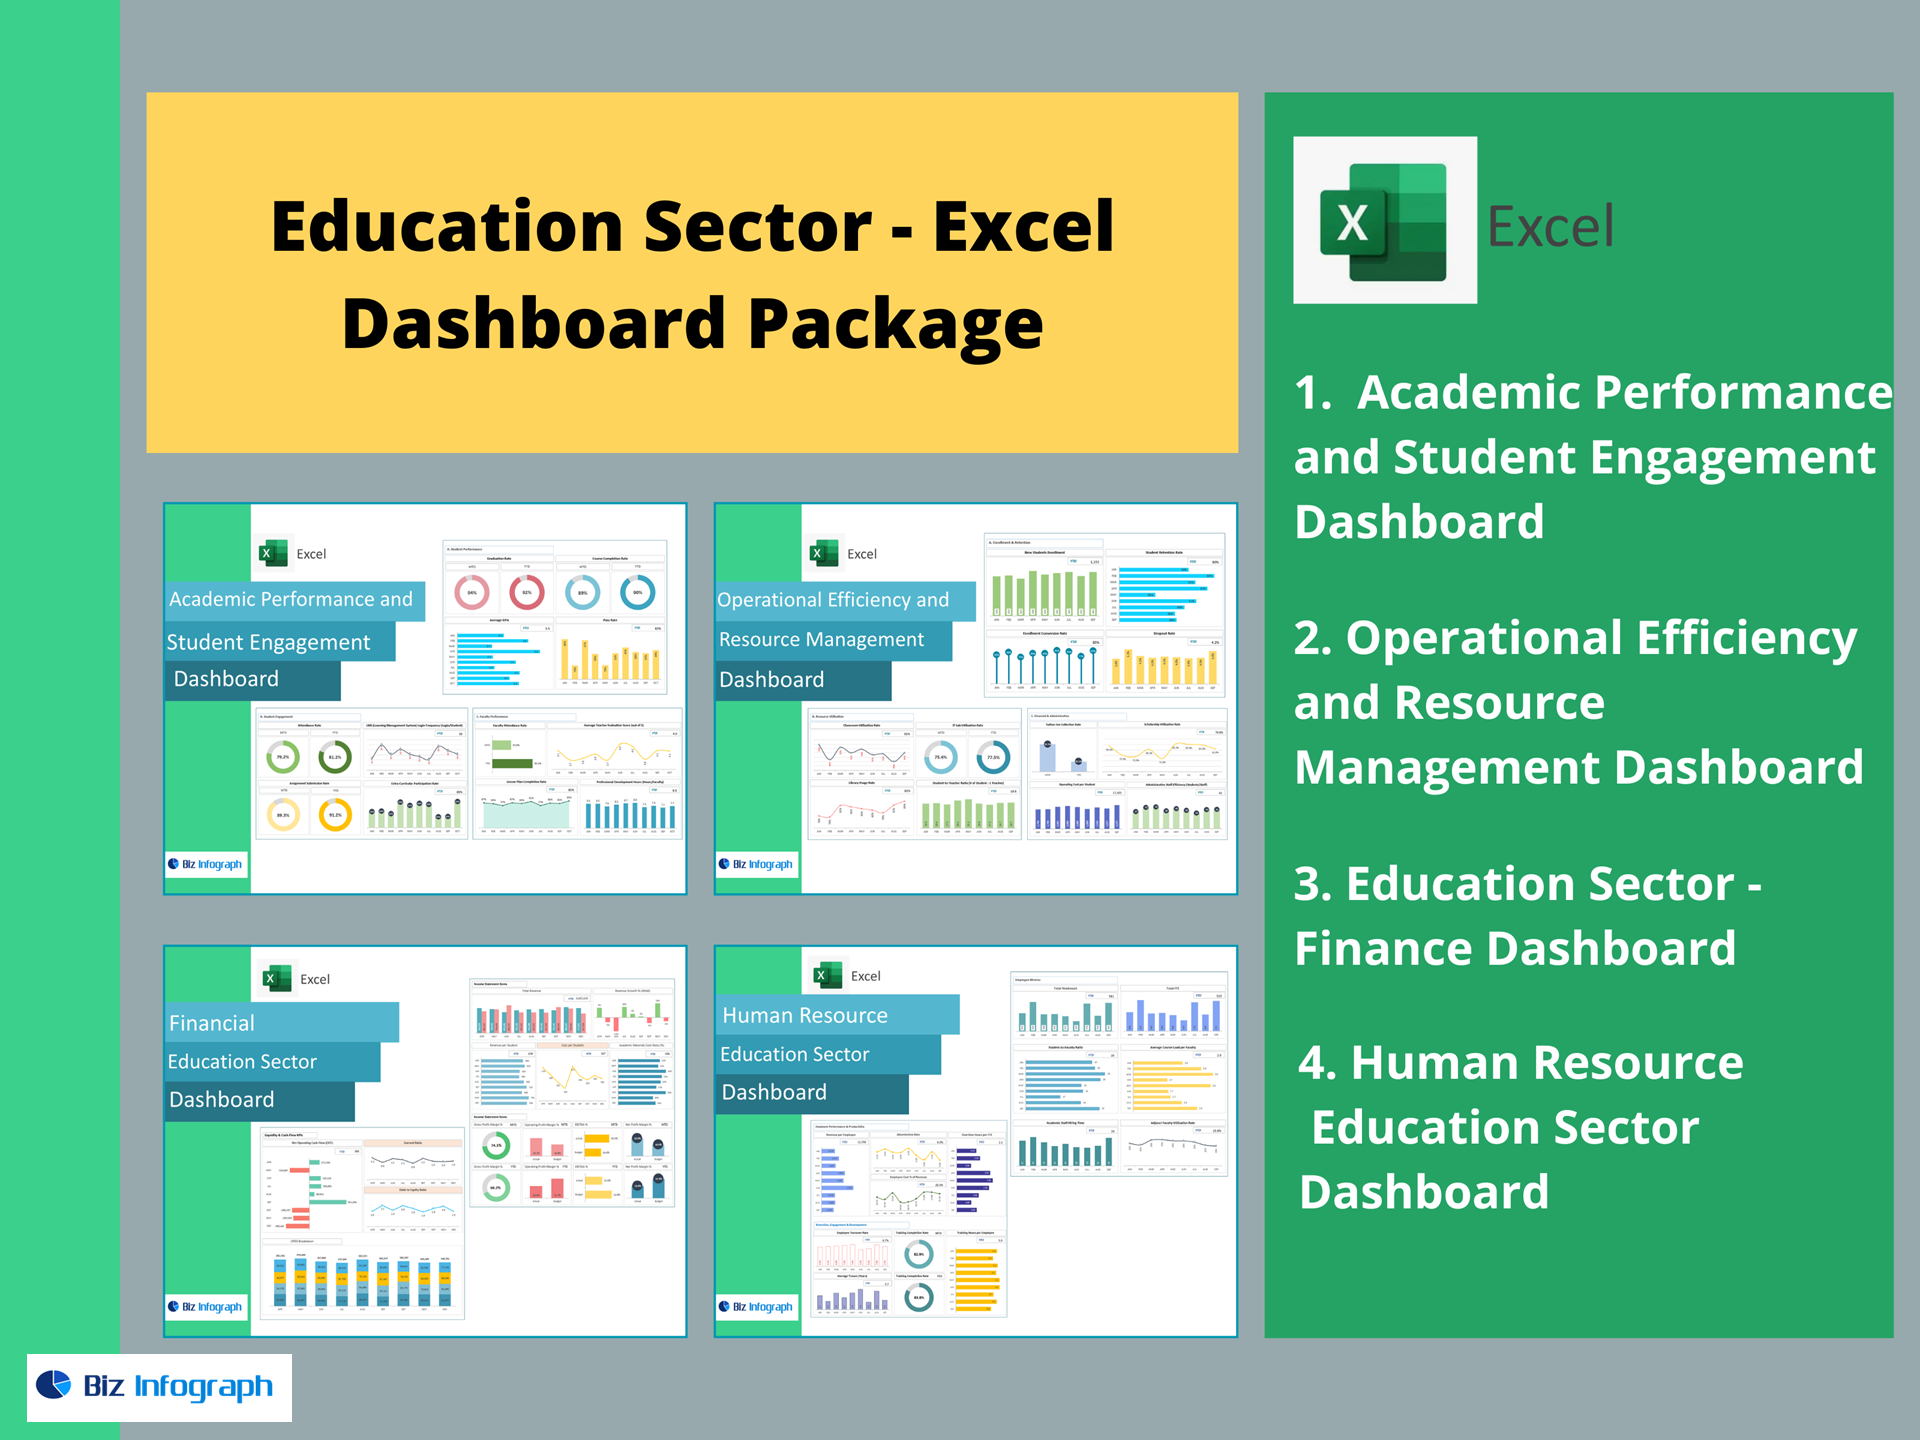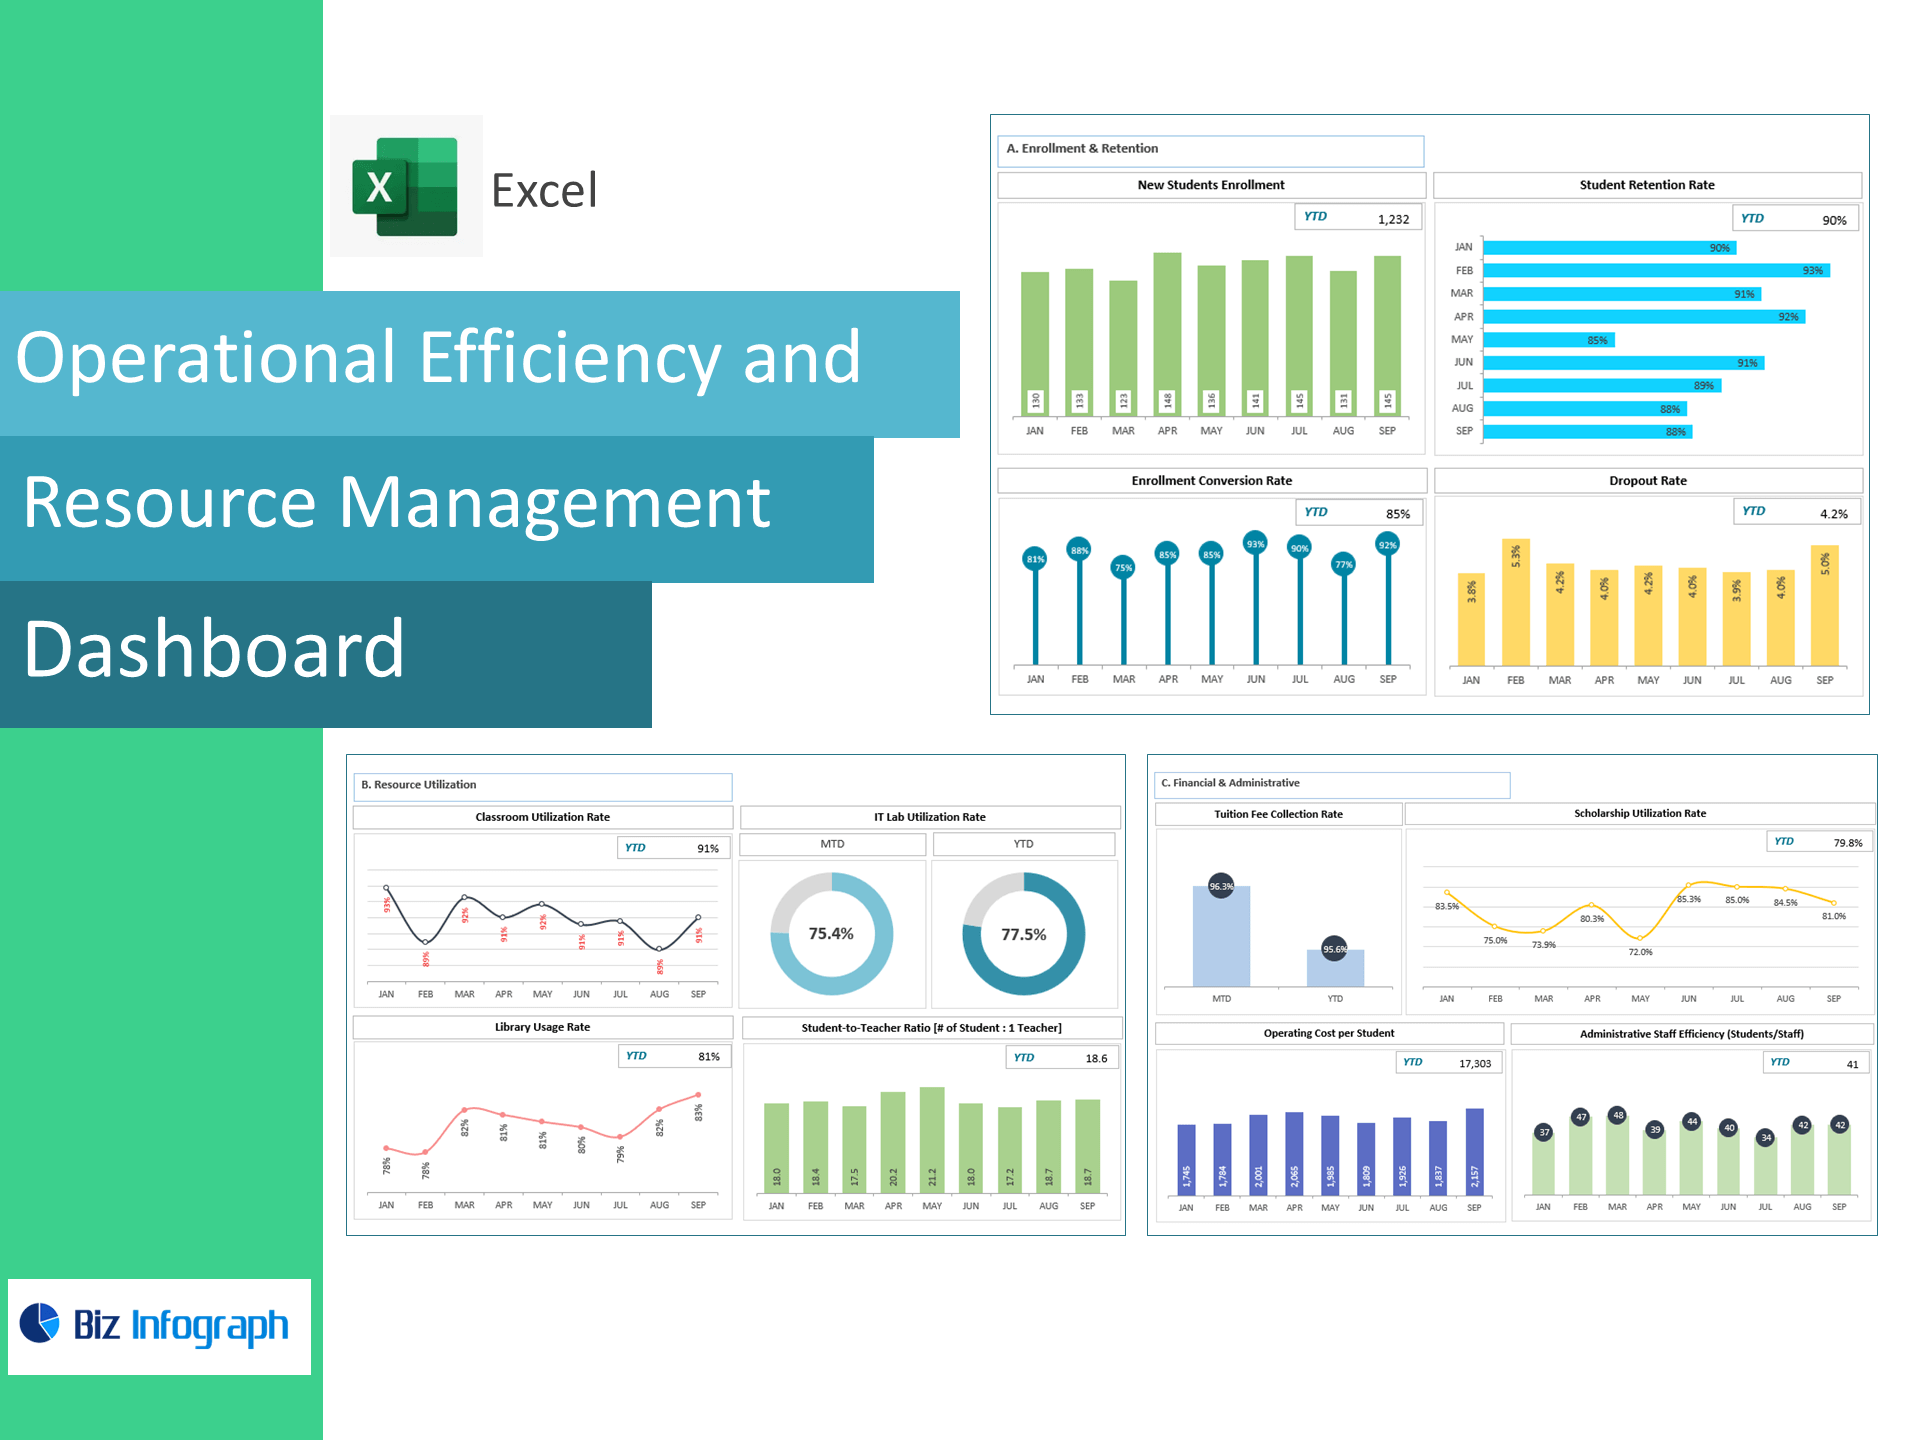
Operational Efficiency & Resource Management Dashboard — Excel Template
Run your campus like a high-performing operation. This ready-to-use Excel dashboard converts enrollment, retention, classroom and lab usage, library traffic, and finance/admin metrics into clear, decision-ready KPIs—no coding, no add-ins.
Who it’s for
School administrators, operations leaders, registrars, finance teams, and deans who need a single source of truth for capacity, utilization, and cost per student.
What you get
-
Interactive dashboard (Excel 2016+ Win/Mac; no macros).
-
Data entry sheets for enrollment, retention, rooms/labs, library, fees & scholarships, and admin staffing.
-
Targets & RAG status with MoM/YoY trends and variance to goal.
-
Filters by campus, department, grade/level, and term.
-
Print-ready views for board packs and accreditation reviews.
KPIs Included (with formulas)
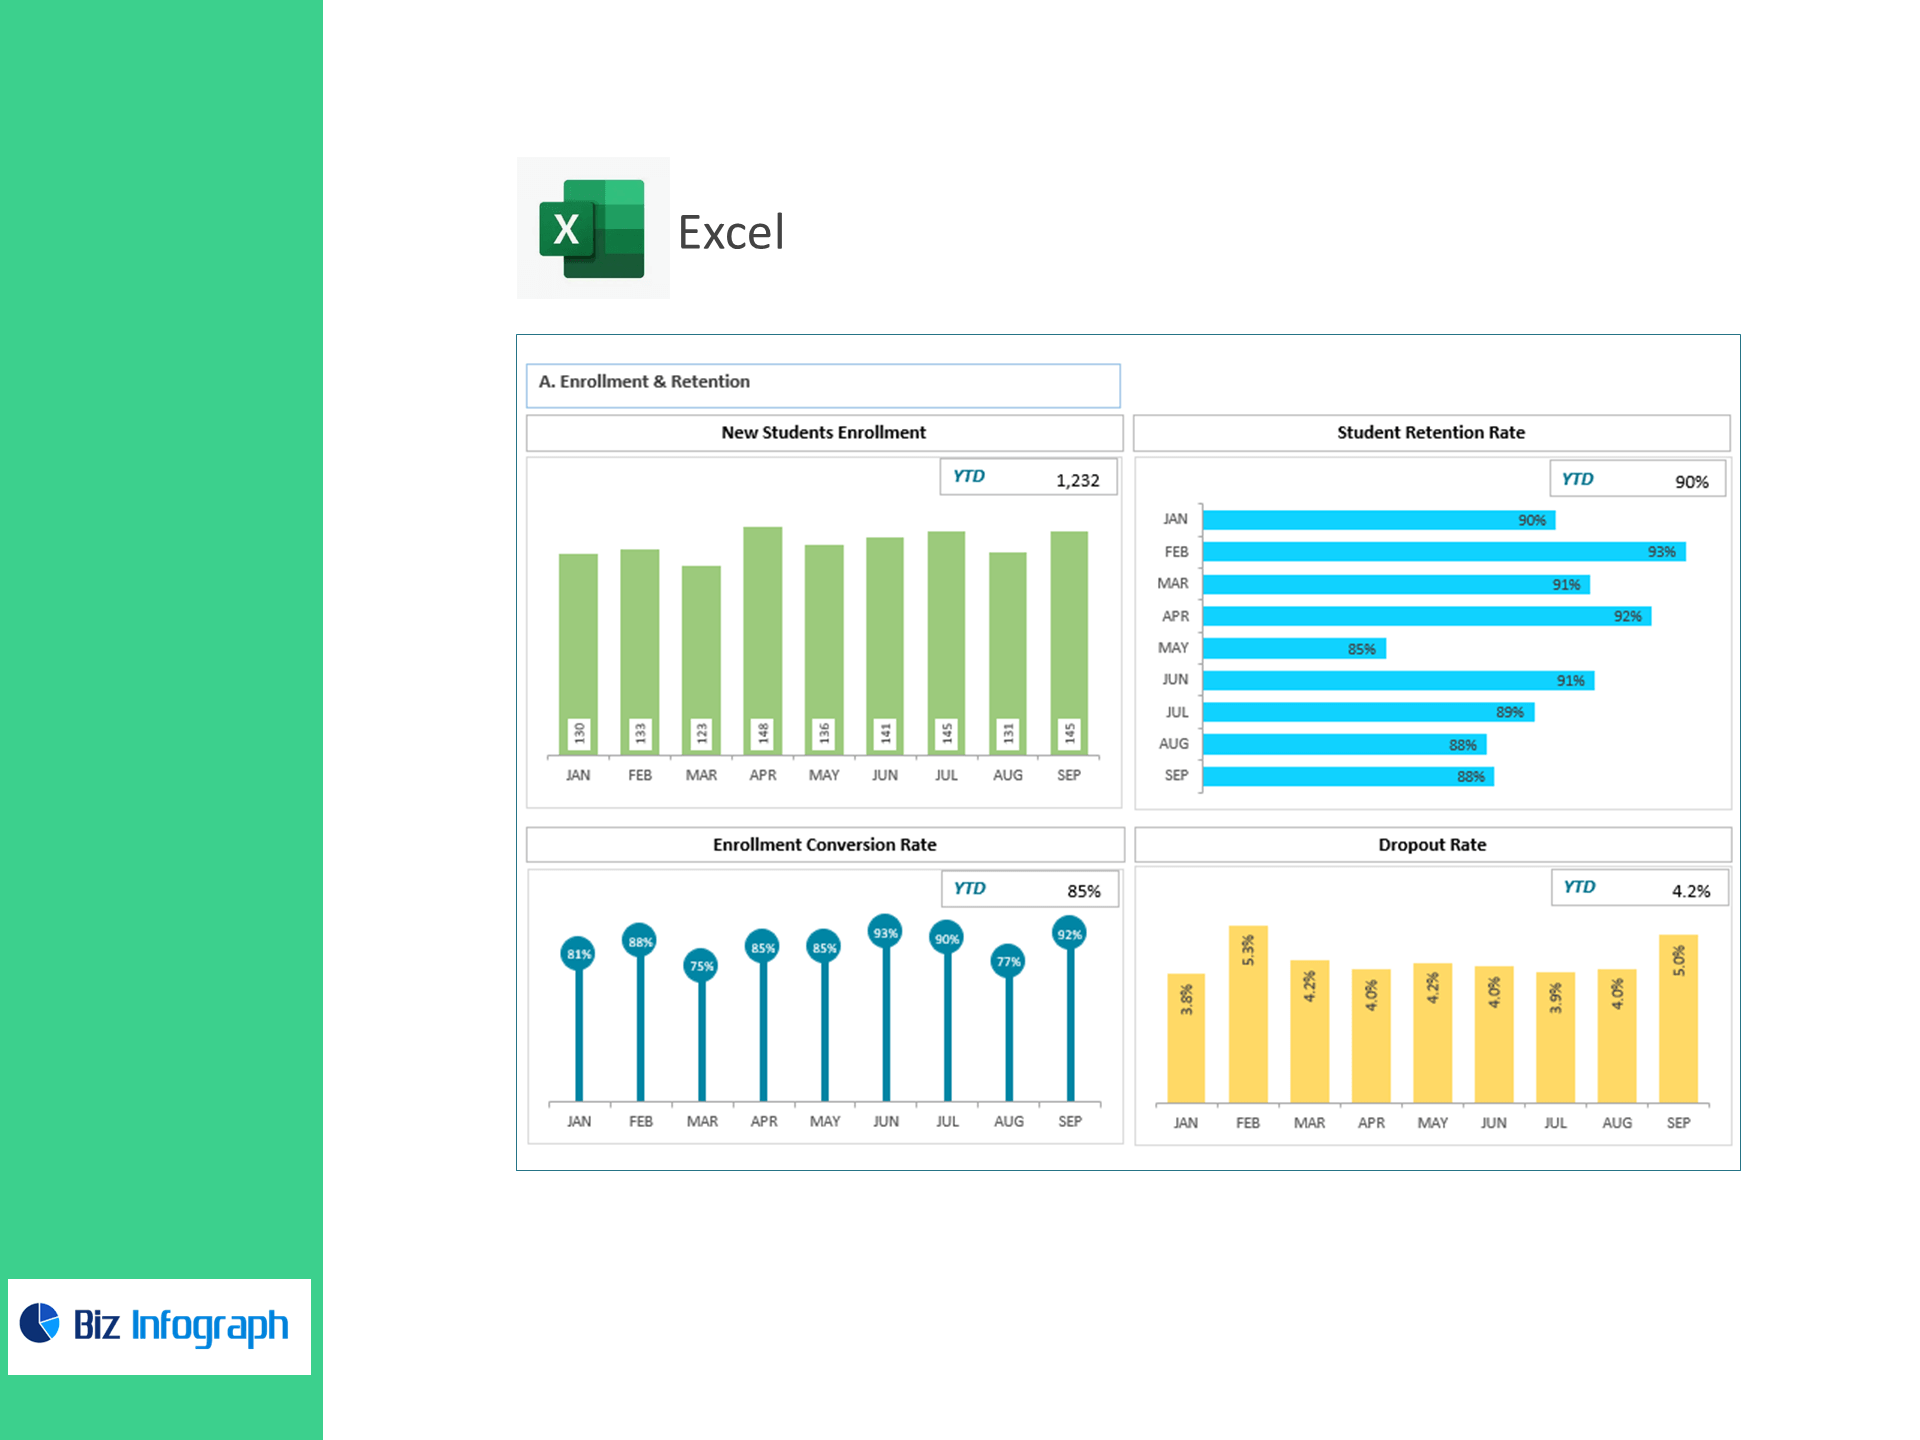
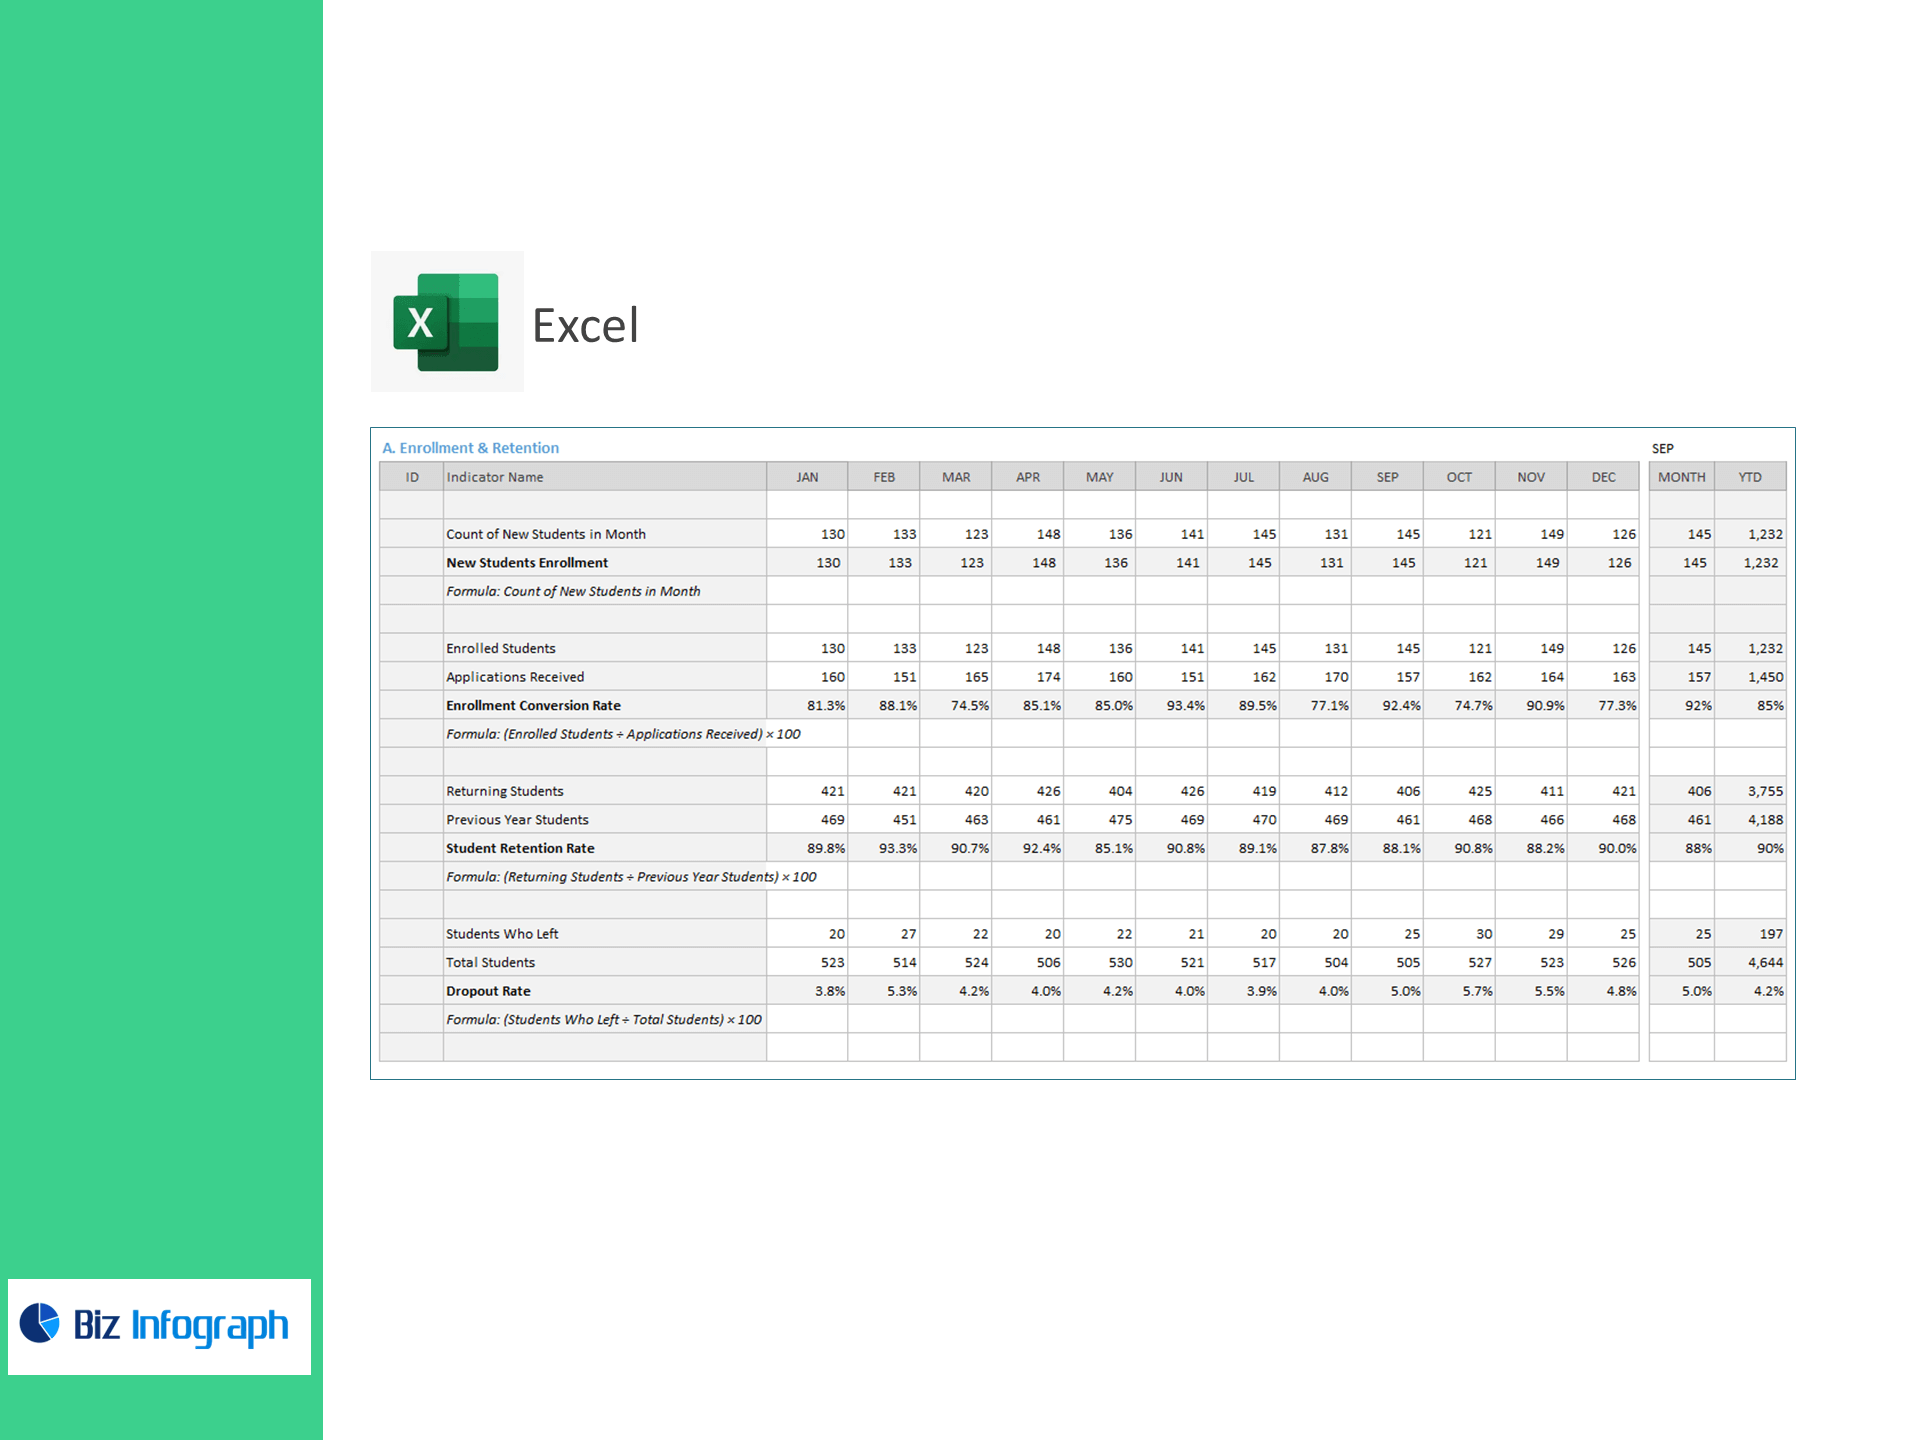
A) Enrollment & Retention
-
New Students Enrollment = Count of new students in month
-
Enrollment Conversion Rate (%) =
(Enrolled Students ÷ Applications Received) × 100 -
Student Retention Rate (%) =
(Returning Students ÷ Previous Year Students) × 100 -
Dropout Rate (%) =
(Students Who Left ÷ Total Students) × 100
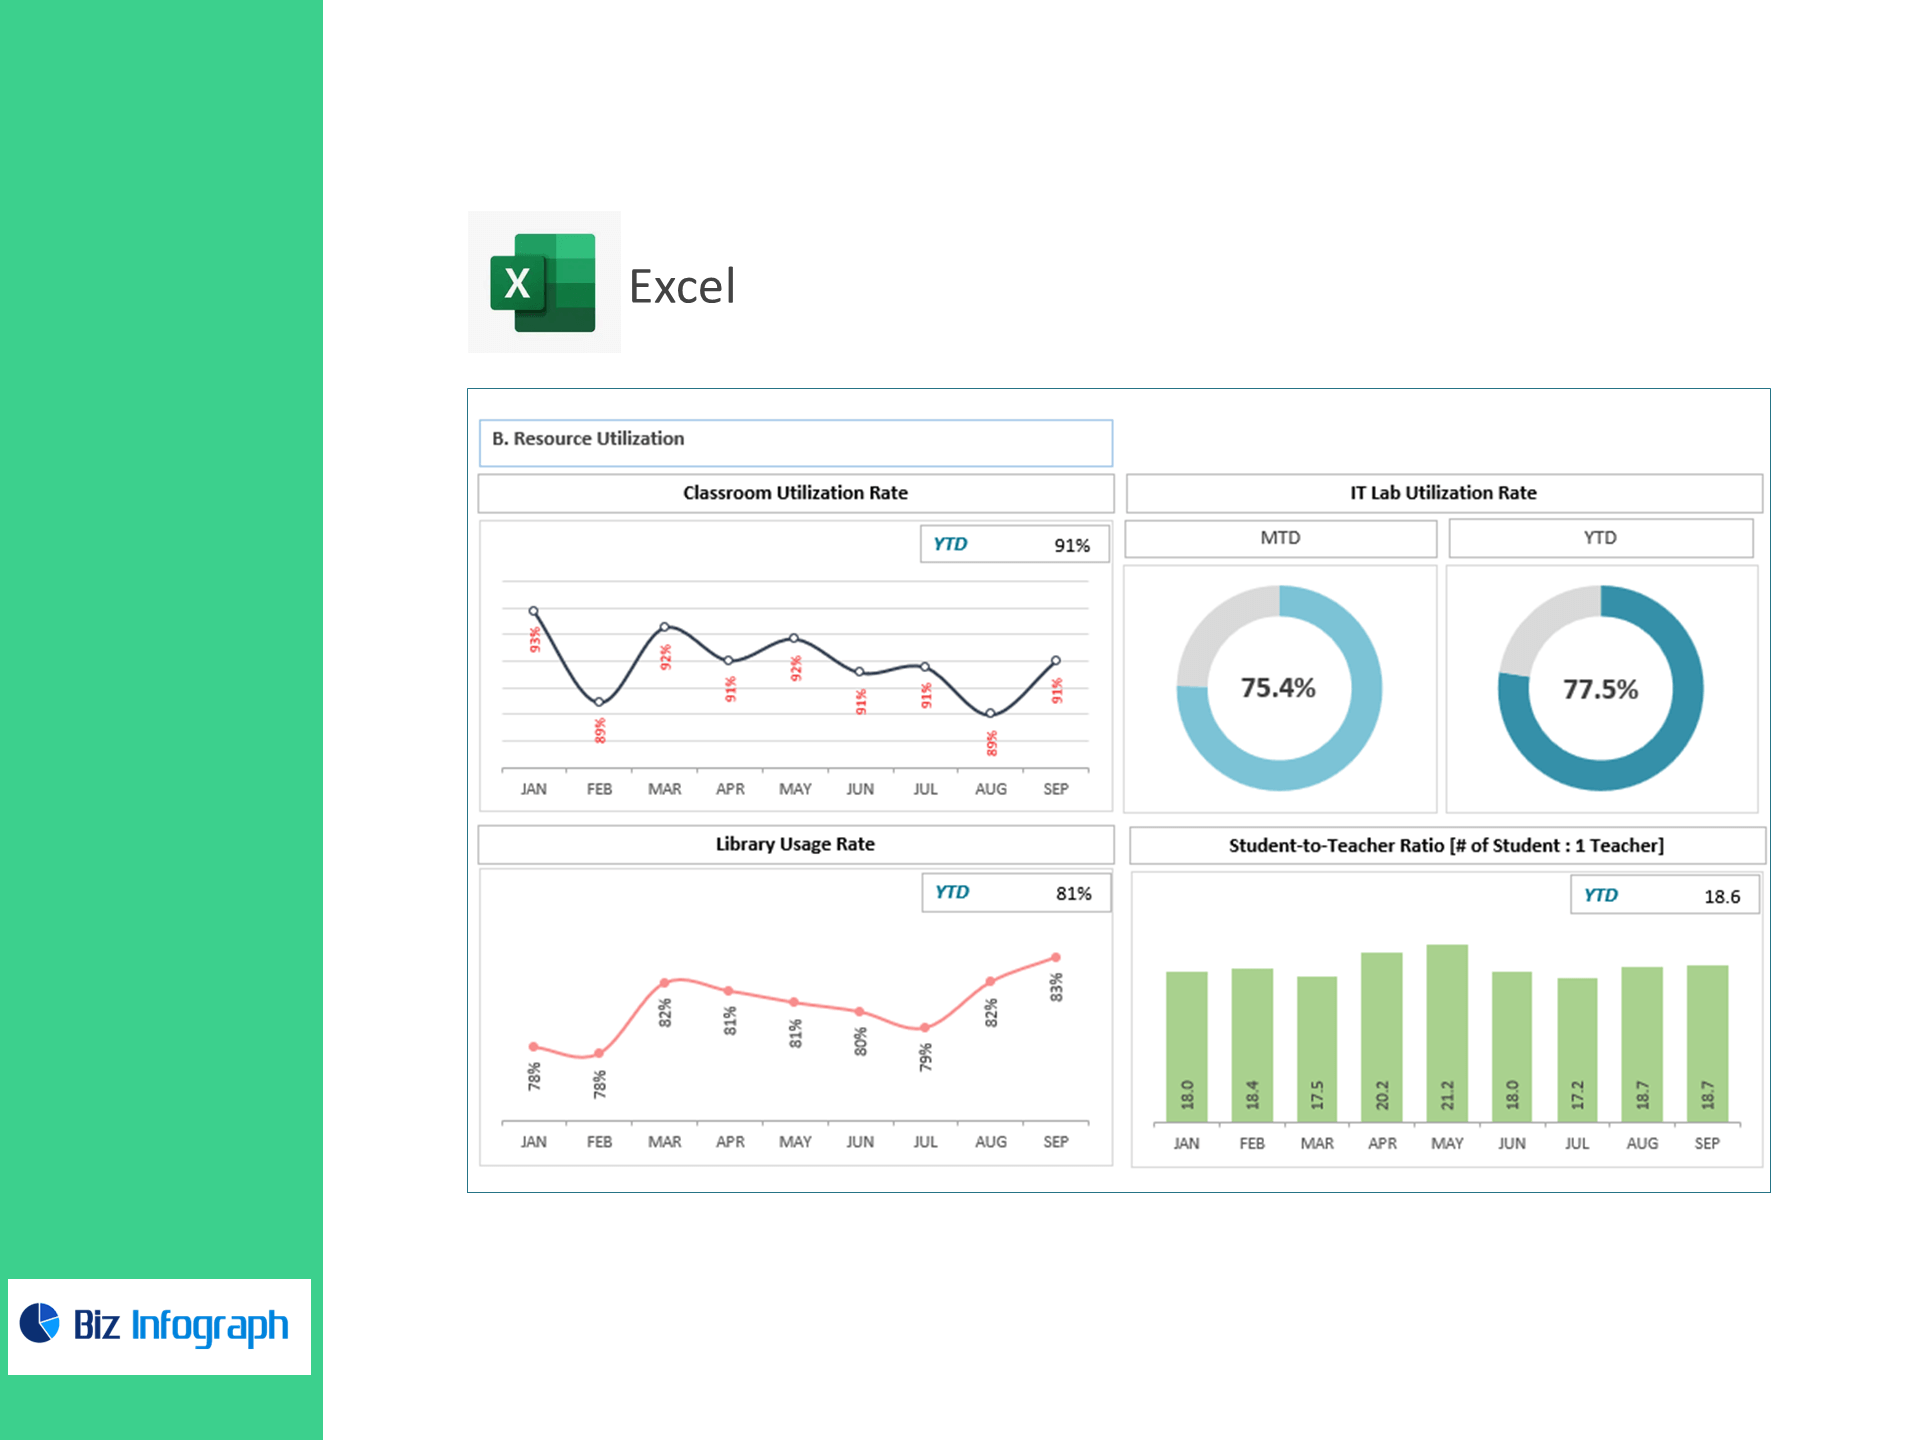
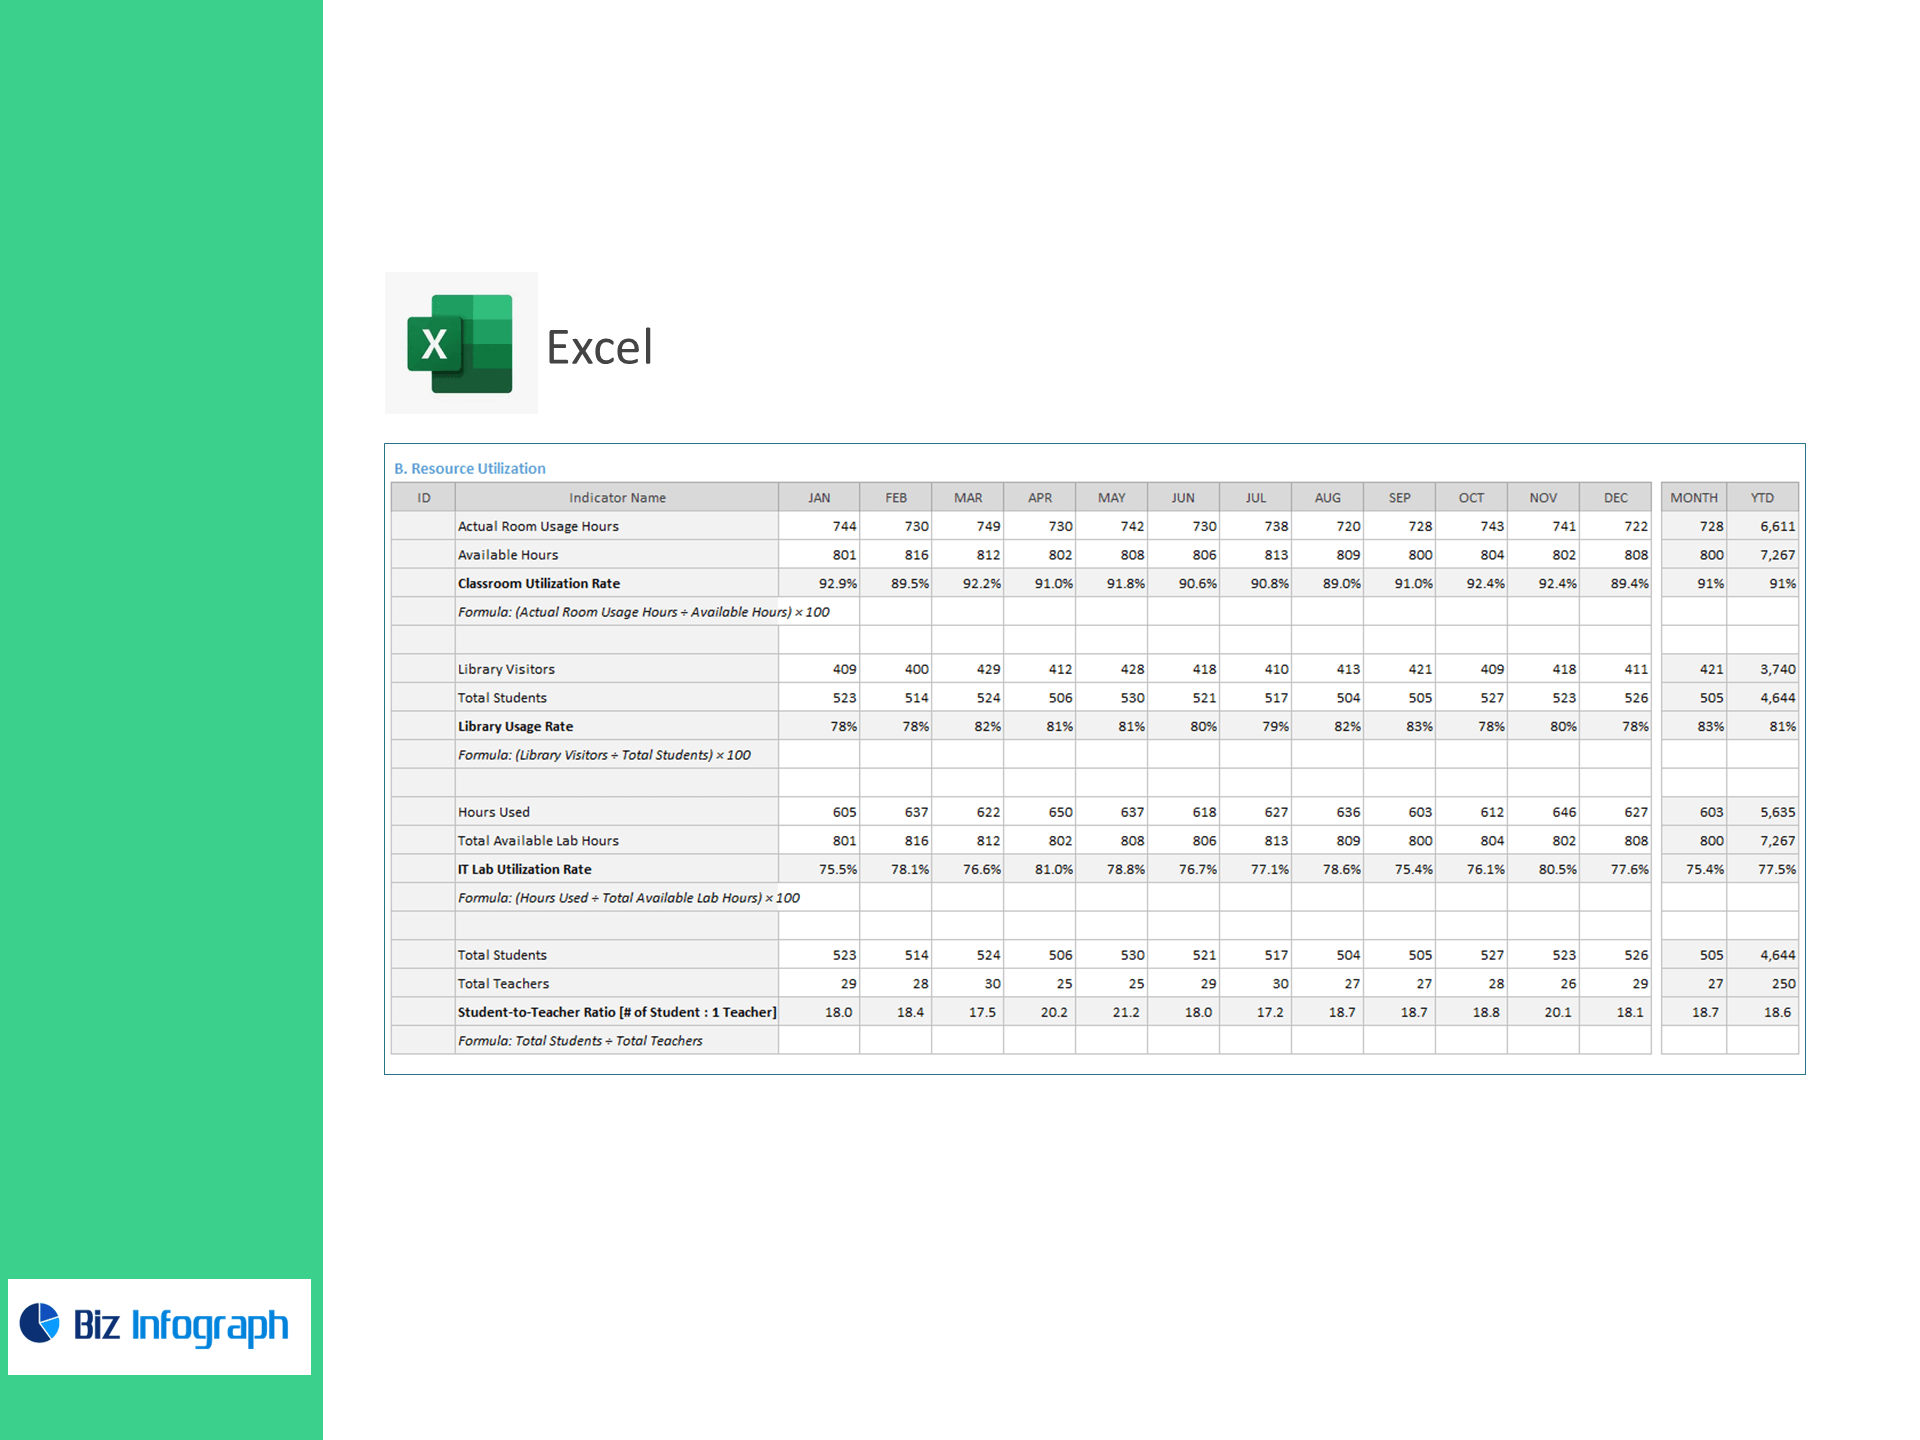
B) Resource Utilization
-
Classroom Utilization Rate (%) =
(Actual Room Usage Hours ÷ Available Hours) × 100 -
Library Usage Rate (%) =
(Library Visitors ÷ Total Students) × 100 -
IT Lab Utilization Rate (%) =
(Hours Used ÷ Total Available Lab Hours) × 100 -
Student-to-Teacher Ratio =
Total Students ÷ Total Teachers(# students : 1 teacher)
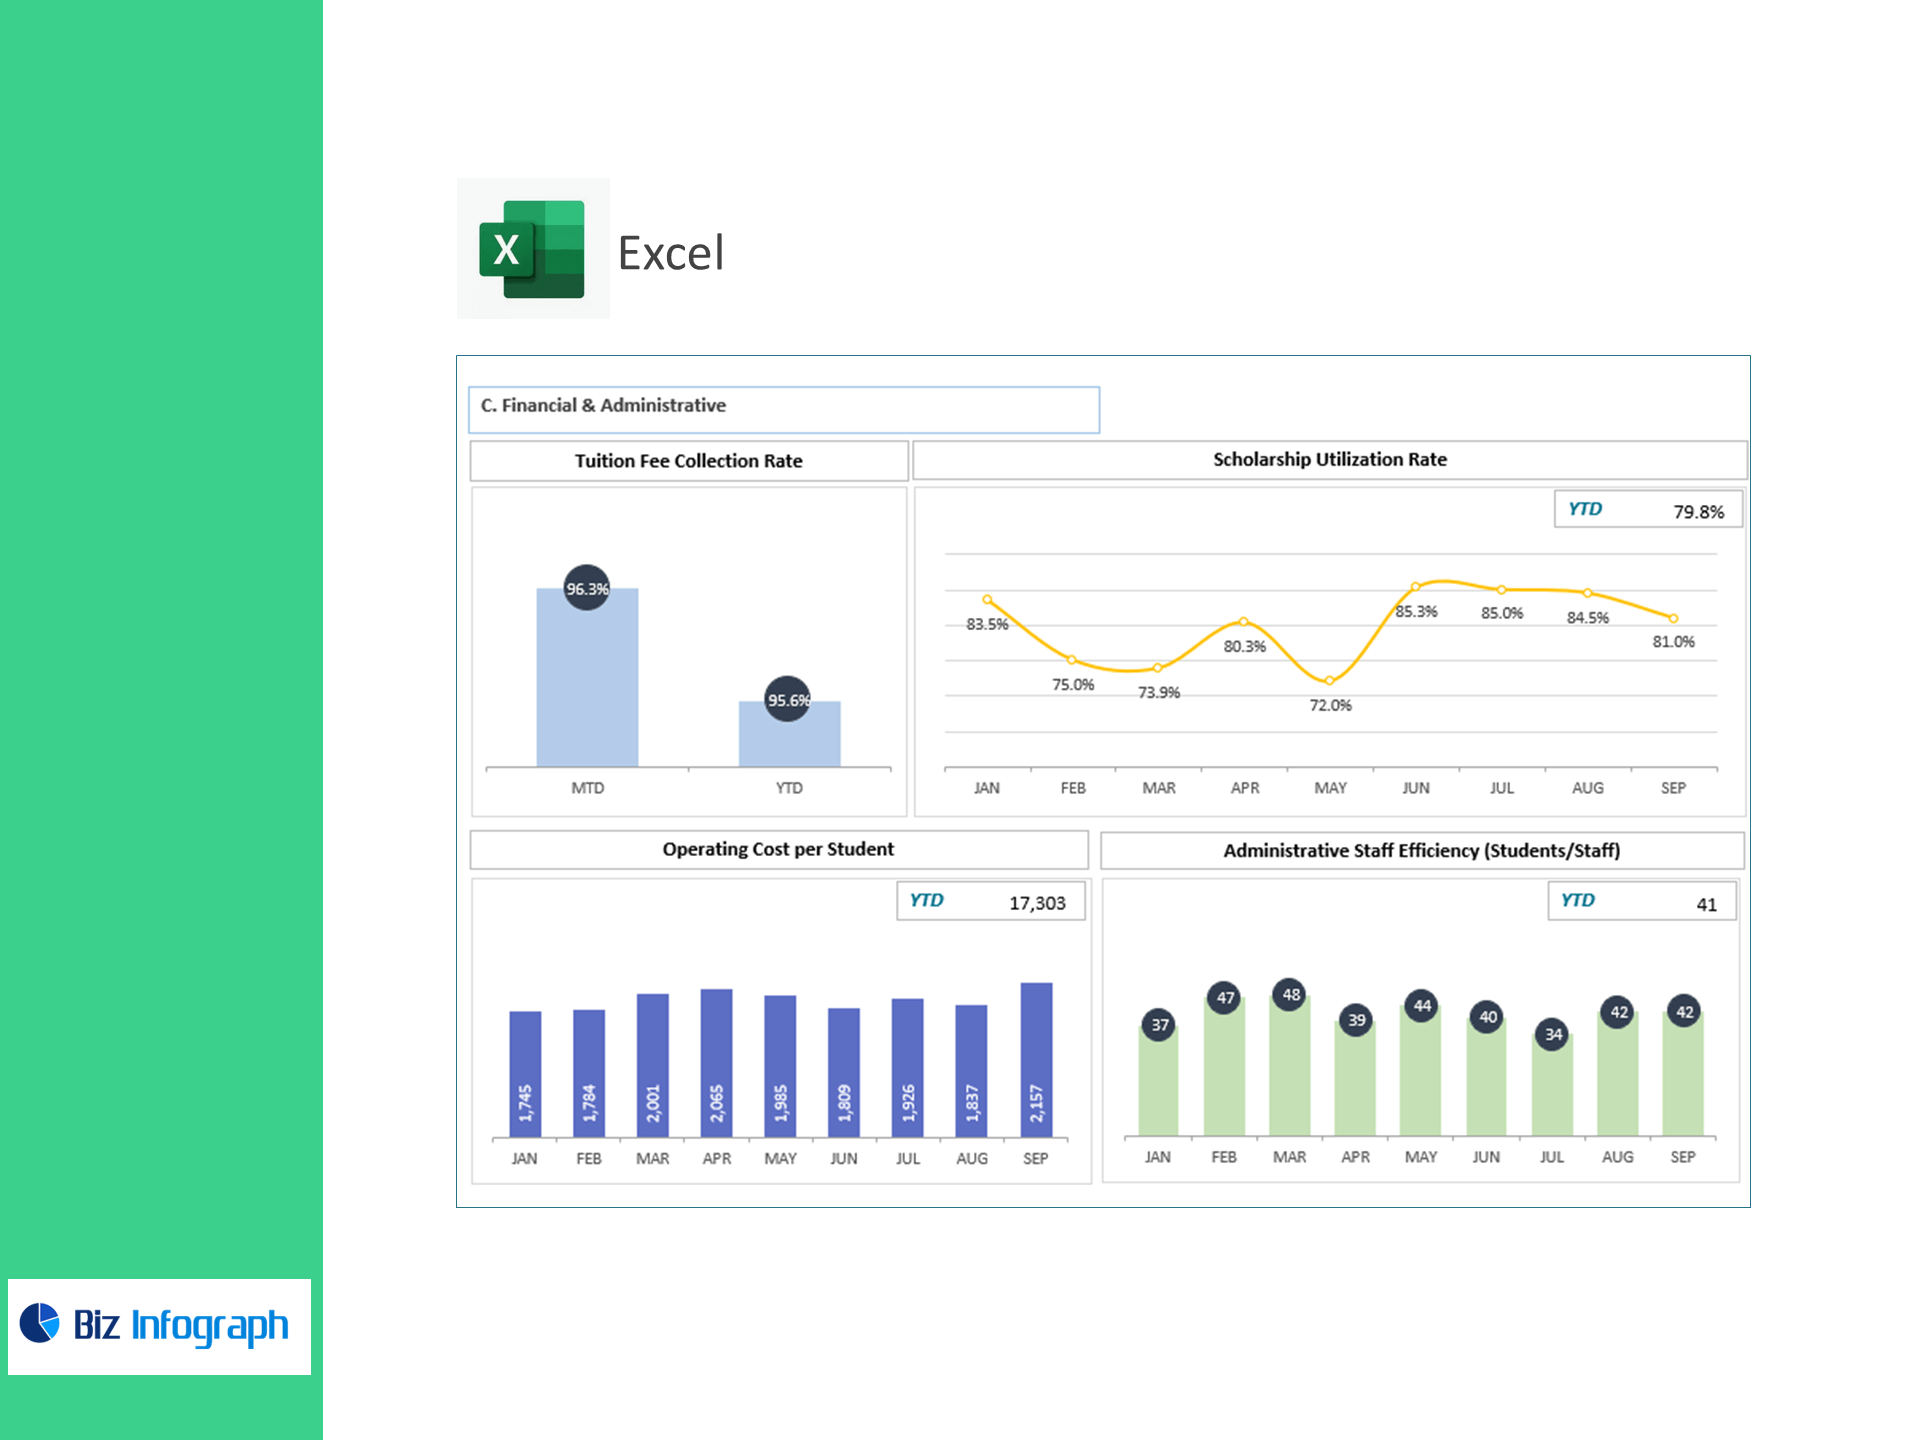
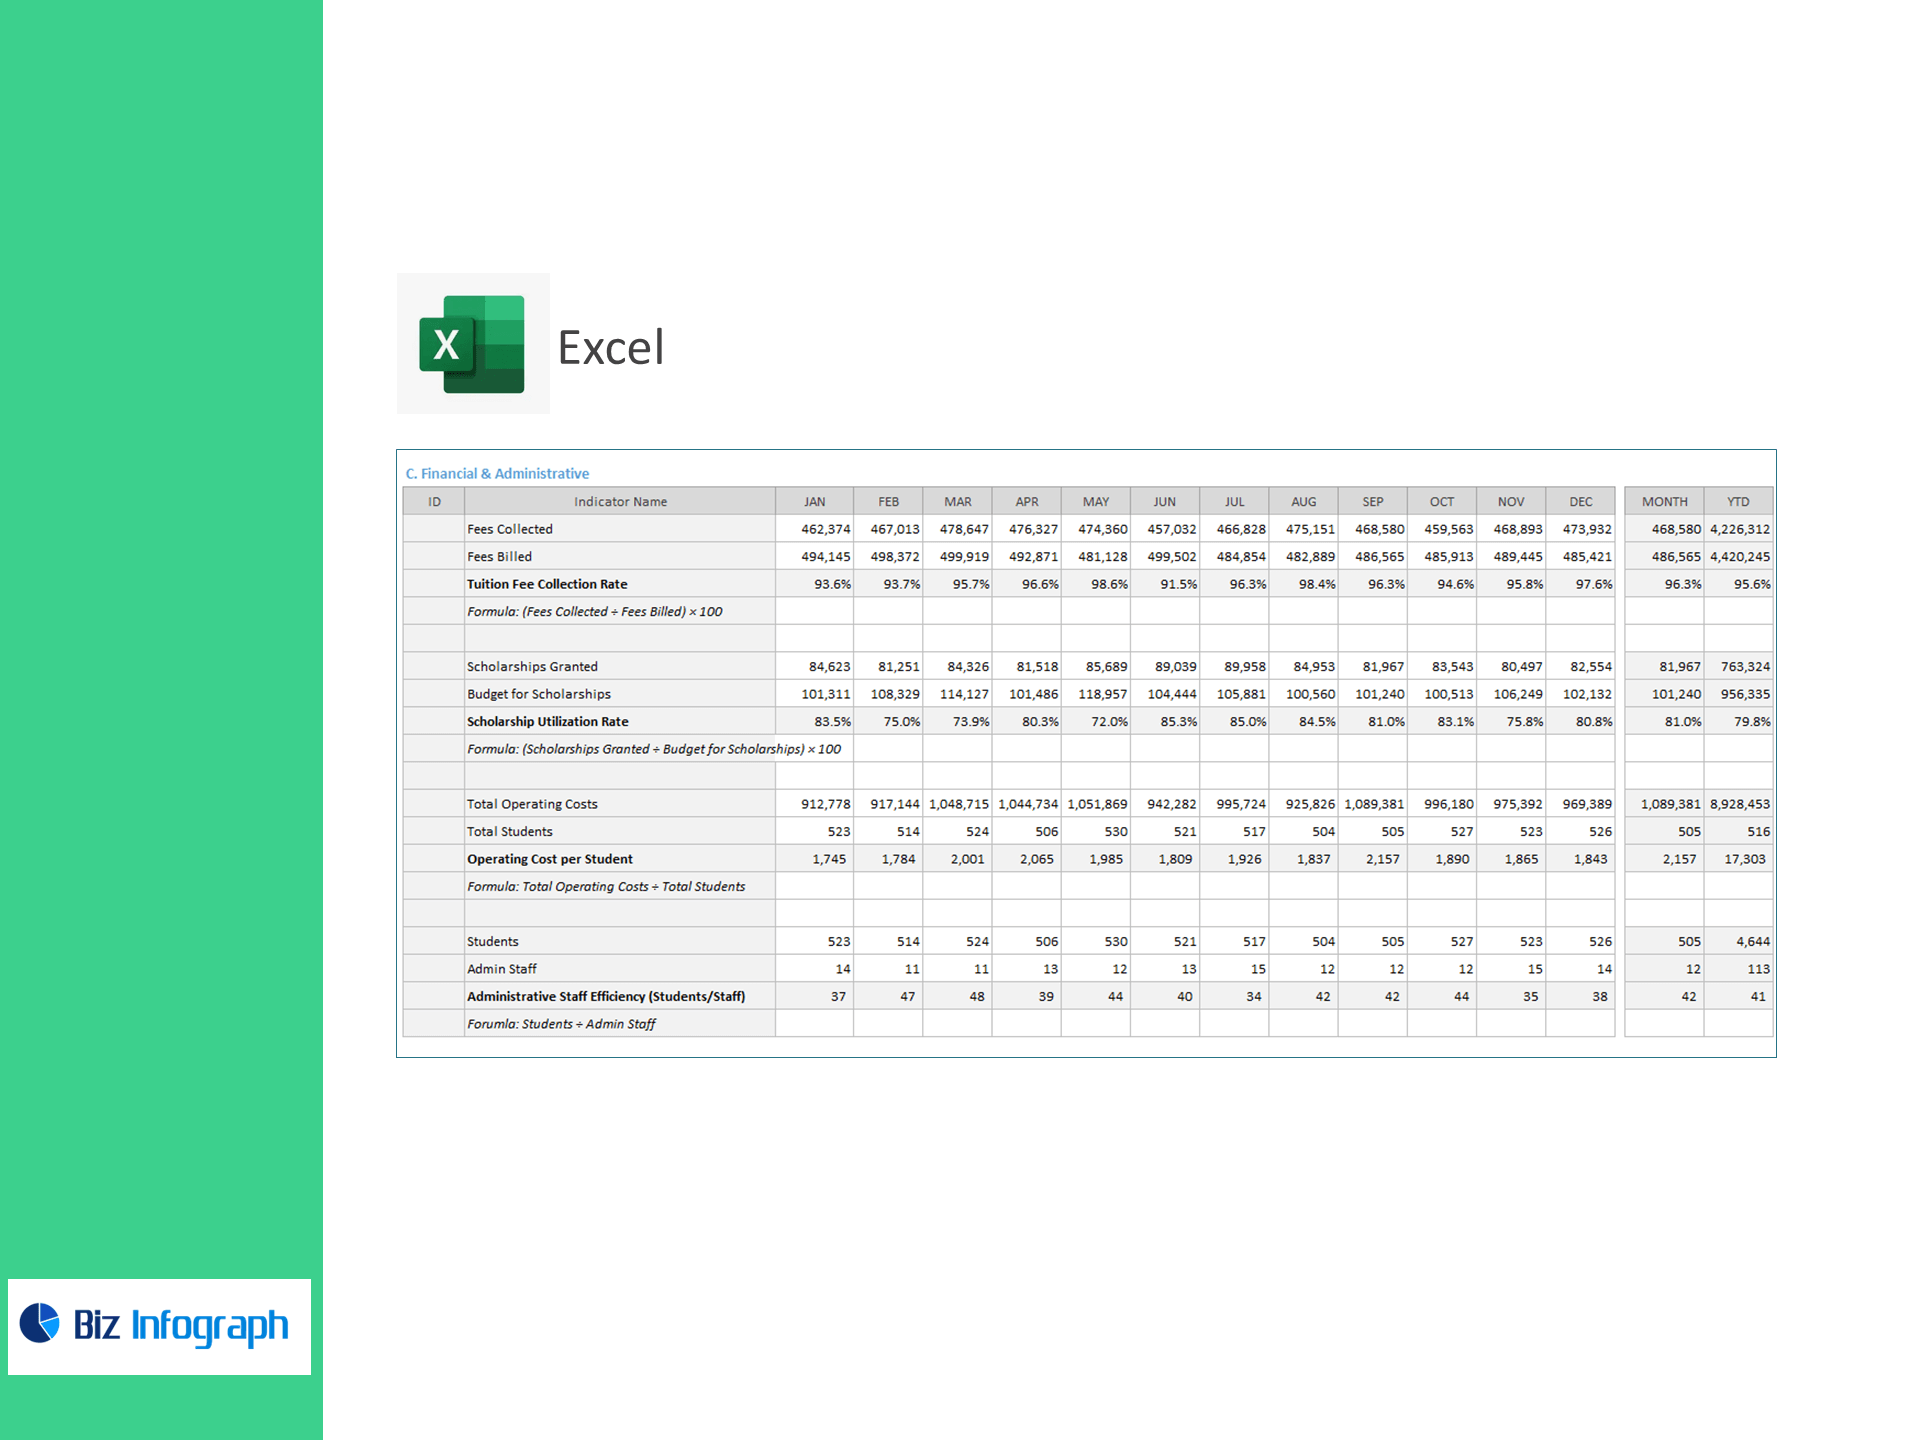
C) Financial & Administrative
-
Tuition Fee Collection Rate (%) =
(Fees Collected ÷ Fees Billed) × 100 -
Scholarship Utilization Rate (%) =
(Scholarships Granted ÷ Budget for Scholarships) × 100 -
Operating Cost per Student =
Total Operating Costs ÷ Total Students -
Administrative Staff Efficiency (Students/Staff) =
Students ÷ Admin Staff
Why operations teams choose this template
-
Right-size capacity: match enrollment & retention with classroom/lab utilization to reduce bottlenecks.
-
Improve cash flow: track fee collection and scholarship usage to stay on budget.
-
Do more with less: monitor operating cost per student and admin efficiency across campuses.
-
Act fast: exception flags highlight declining conversion, rising dropout, or underused facilities.
What’s inside the workbook
-
Executive Overview: conversion, retention, dropout, utilization, and cost KPIs at a glance.
-
Drill-downs: room/lab heatmaps by day/hour; cohort trends for retention and conversion.
-
Settings: KPI targets, academic calendar, campus/department mappings.
-
Documentation: plain-English definitions & step-by-step setup.
For ready-to-use Dashboard Templates: