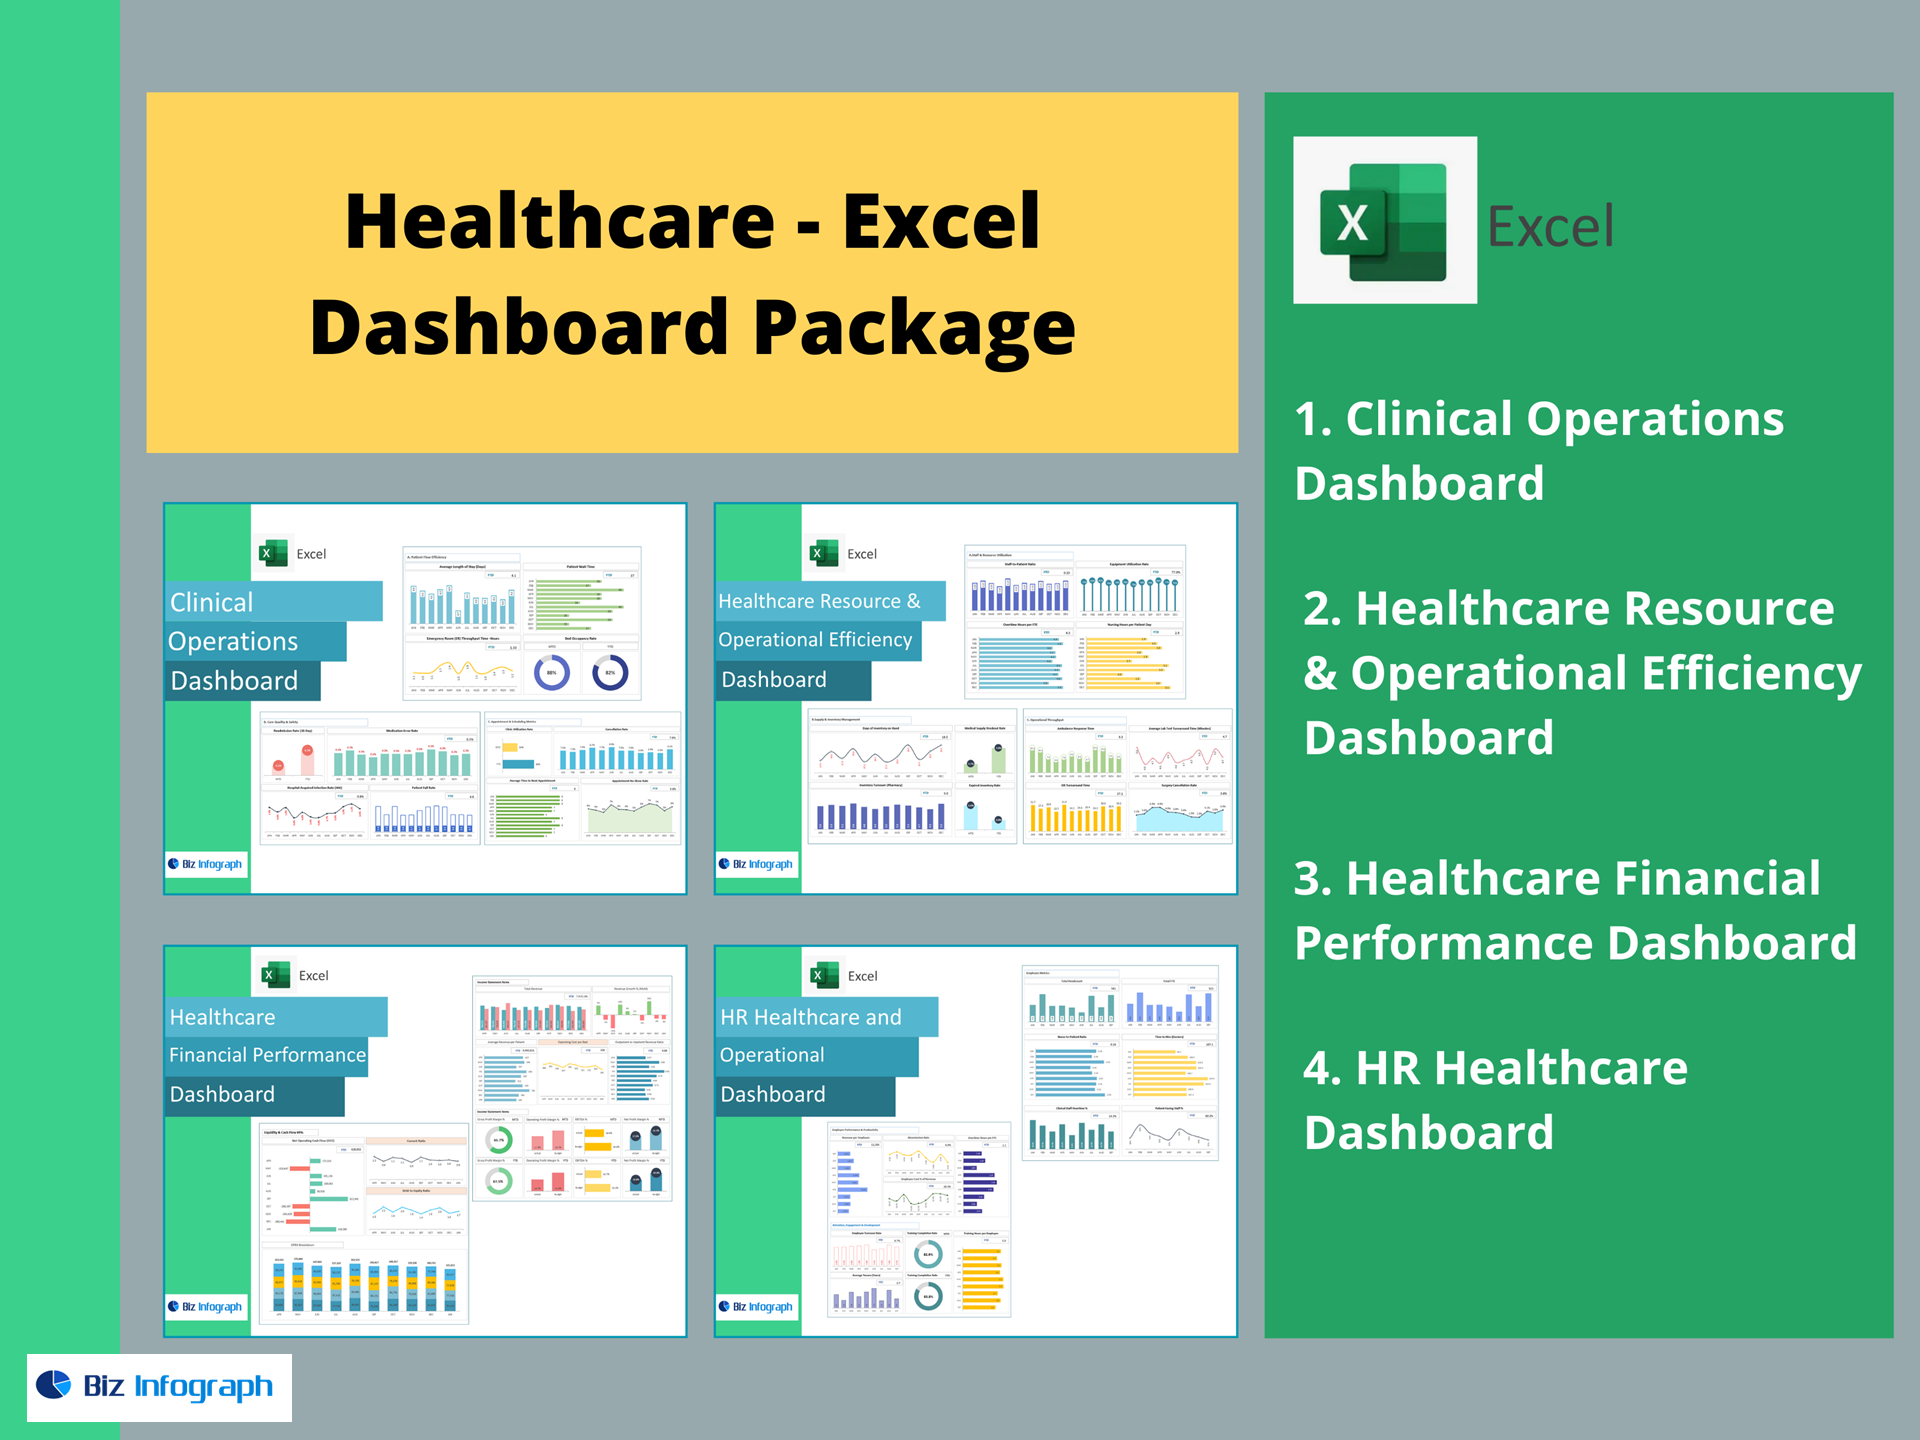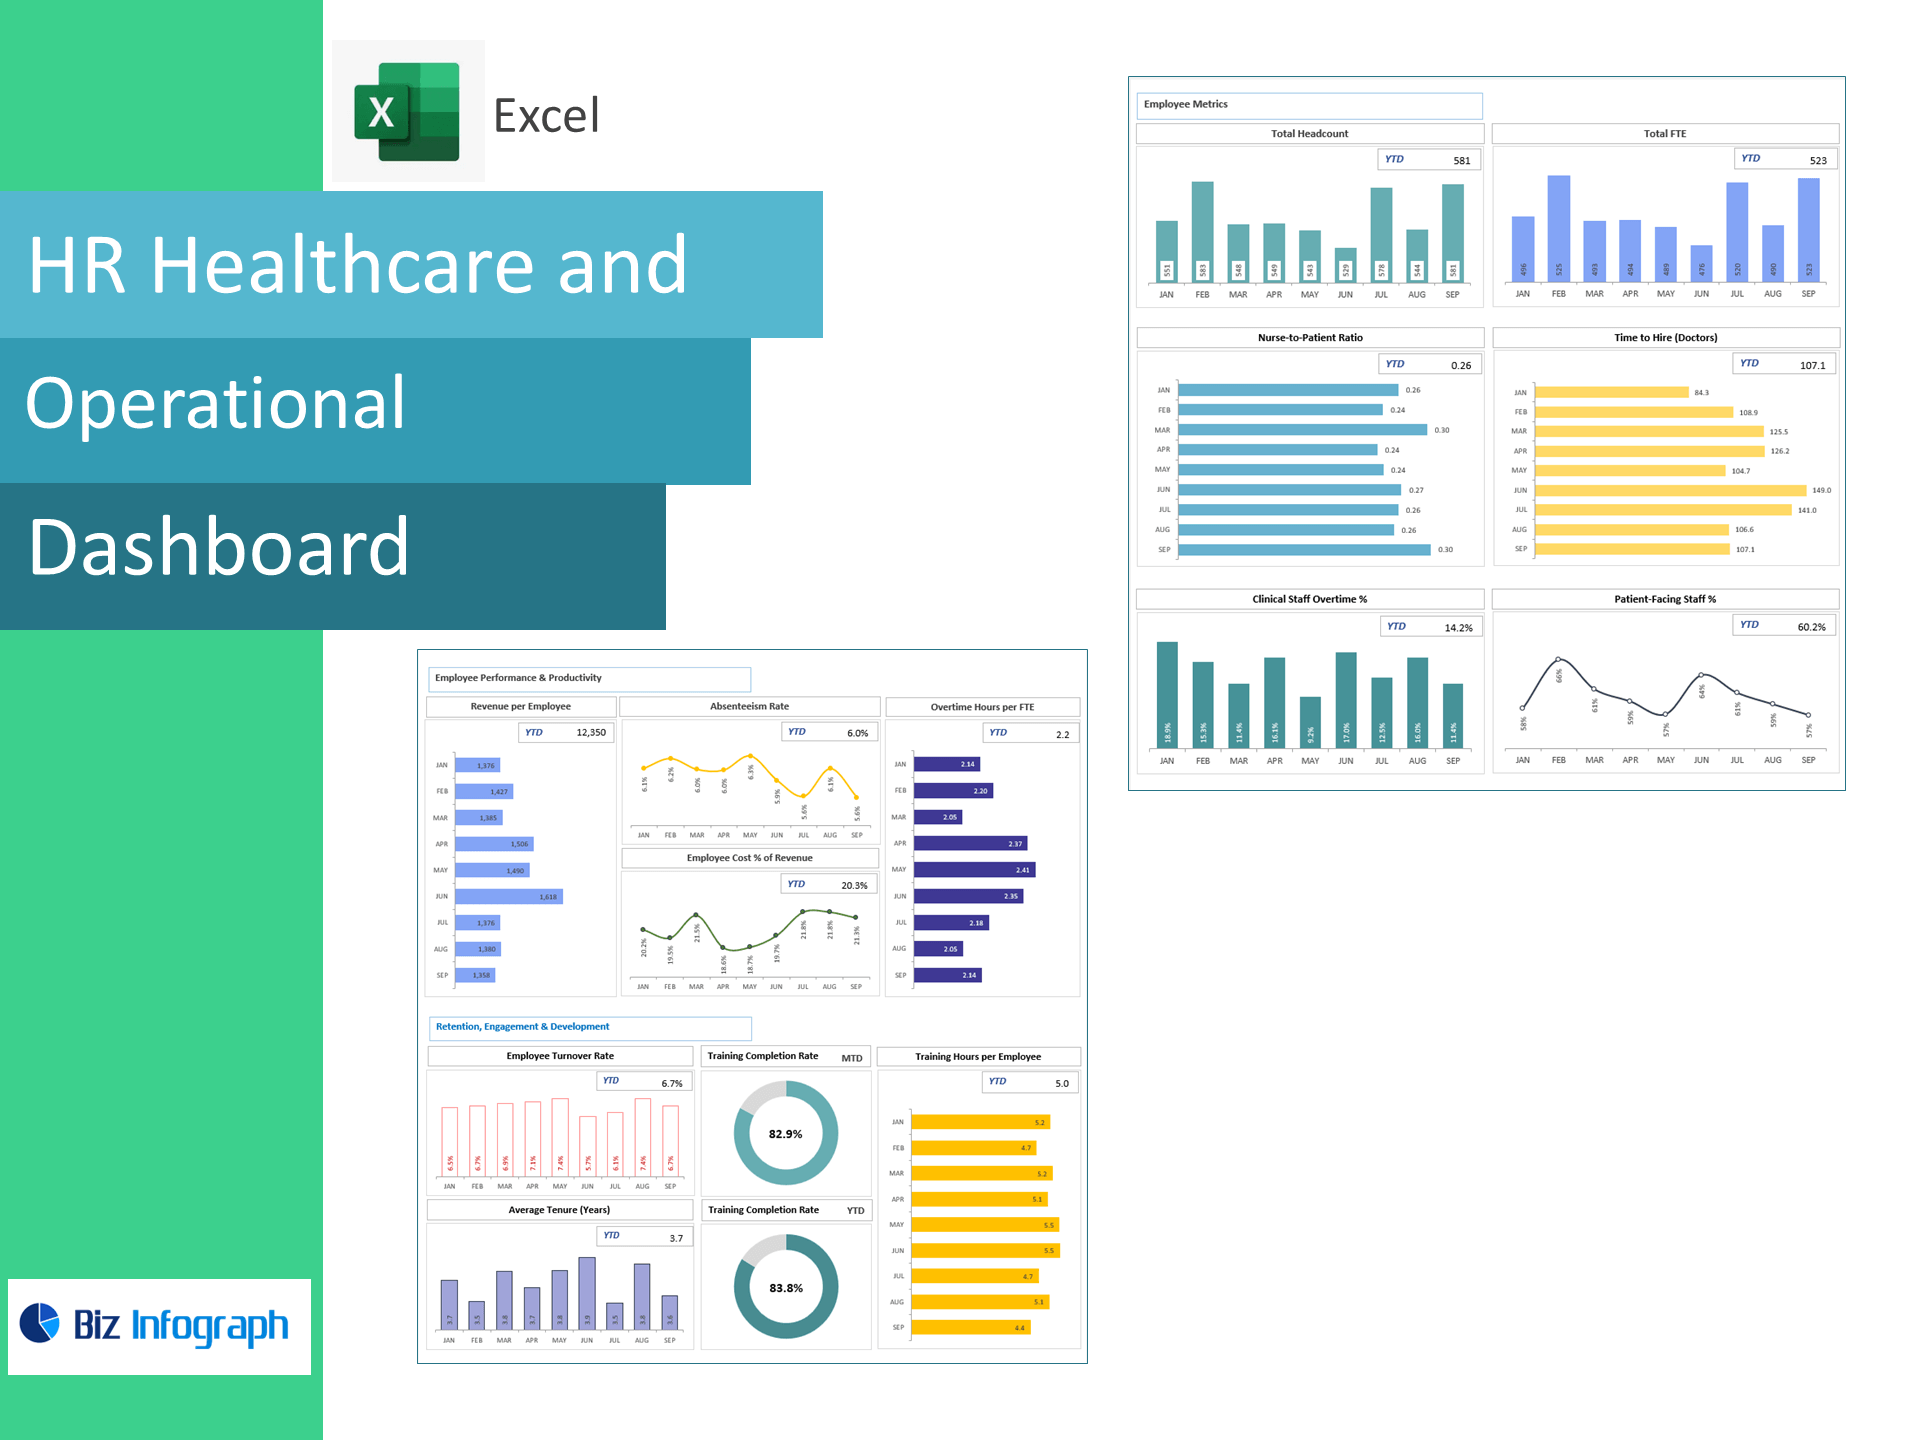
HR Healthcare Dashboard — Excel Template
Staff smarter, reduce overtime, and improve patient care—right in Excel. Purpose-built for hospitals and clinics, this template converts HR, scheduling, and payroll data into a live dashboard tracking Nurse-to-Patient Ratio, Time to Hire (Doctors), Clinical Staff Overtime %, Patient-Facing Staff %, Revenue per Employee, Absenteeism, OT Hours per FTE, Employee Cost % of Revenue, Turnover, Average Tenure, Training Completion Rate, and Training Hours per Employee.
Why healthcare teams choose this template
-
Workforce + care alignment: See how staffing levels and mix affect patient coverage and cost.
-
Control labor spend: Monitor overtime/FTE and employee cost % of revenue with instant variance flags.
-
Hire & retain faster: Track time to hire, turnover, tenure, and training to stabilize teams.
-
Excel-native: Paste your data and the workbook calculates everything—no add-ins or BI required.
KPIs included (ready-made formulas)
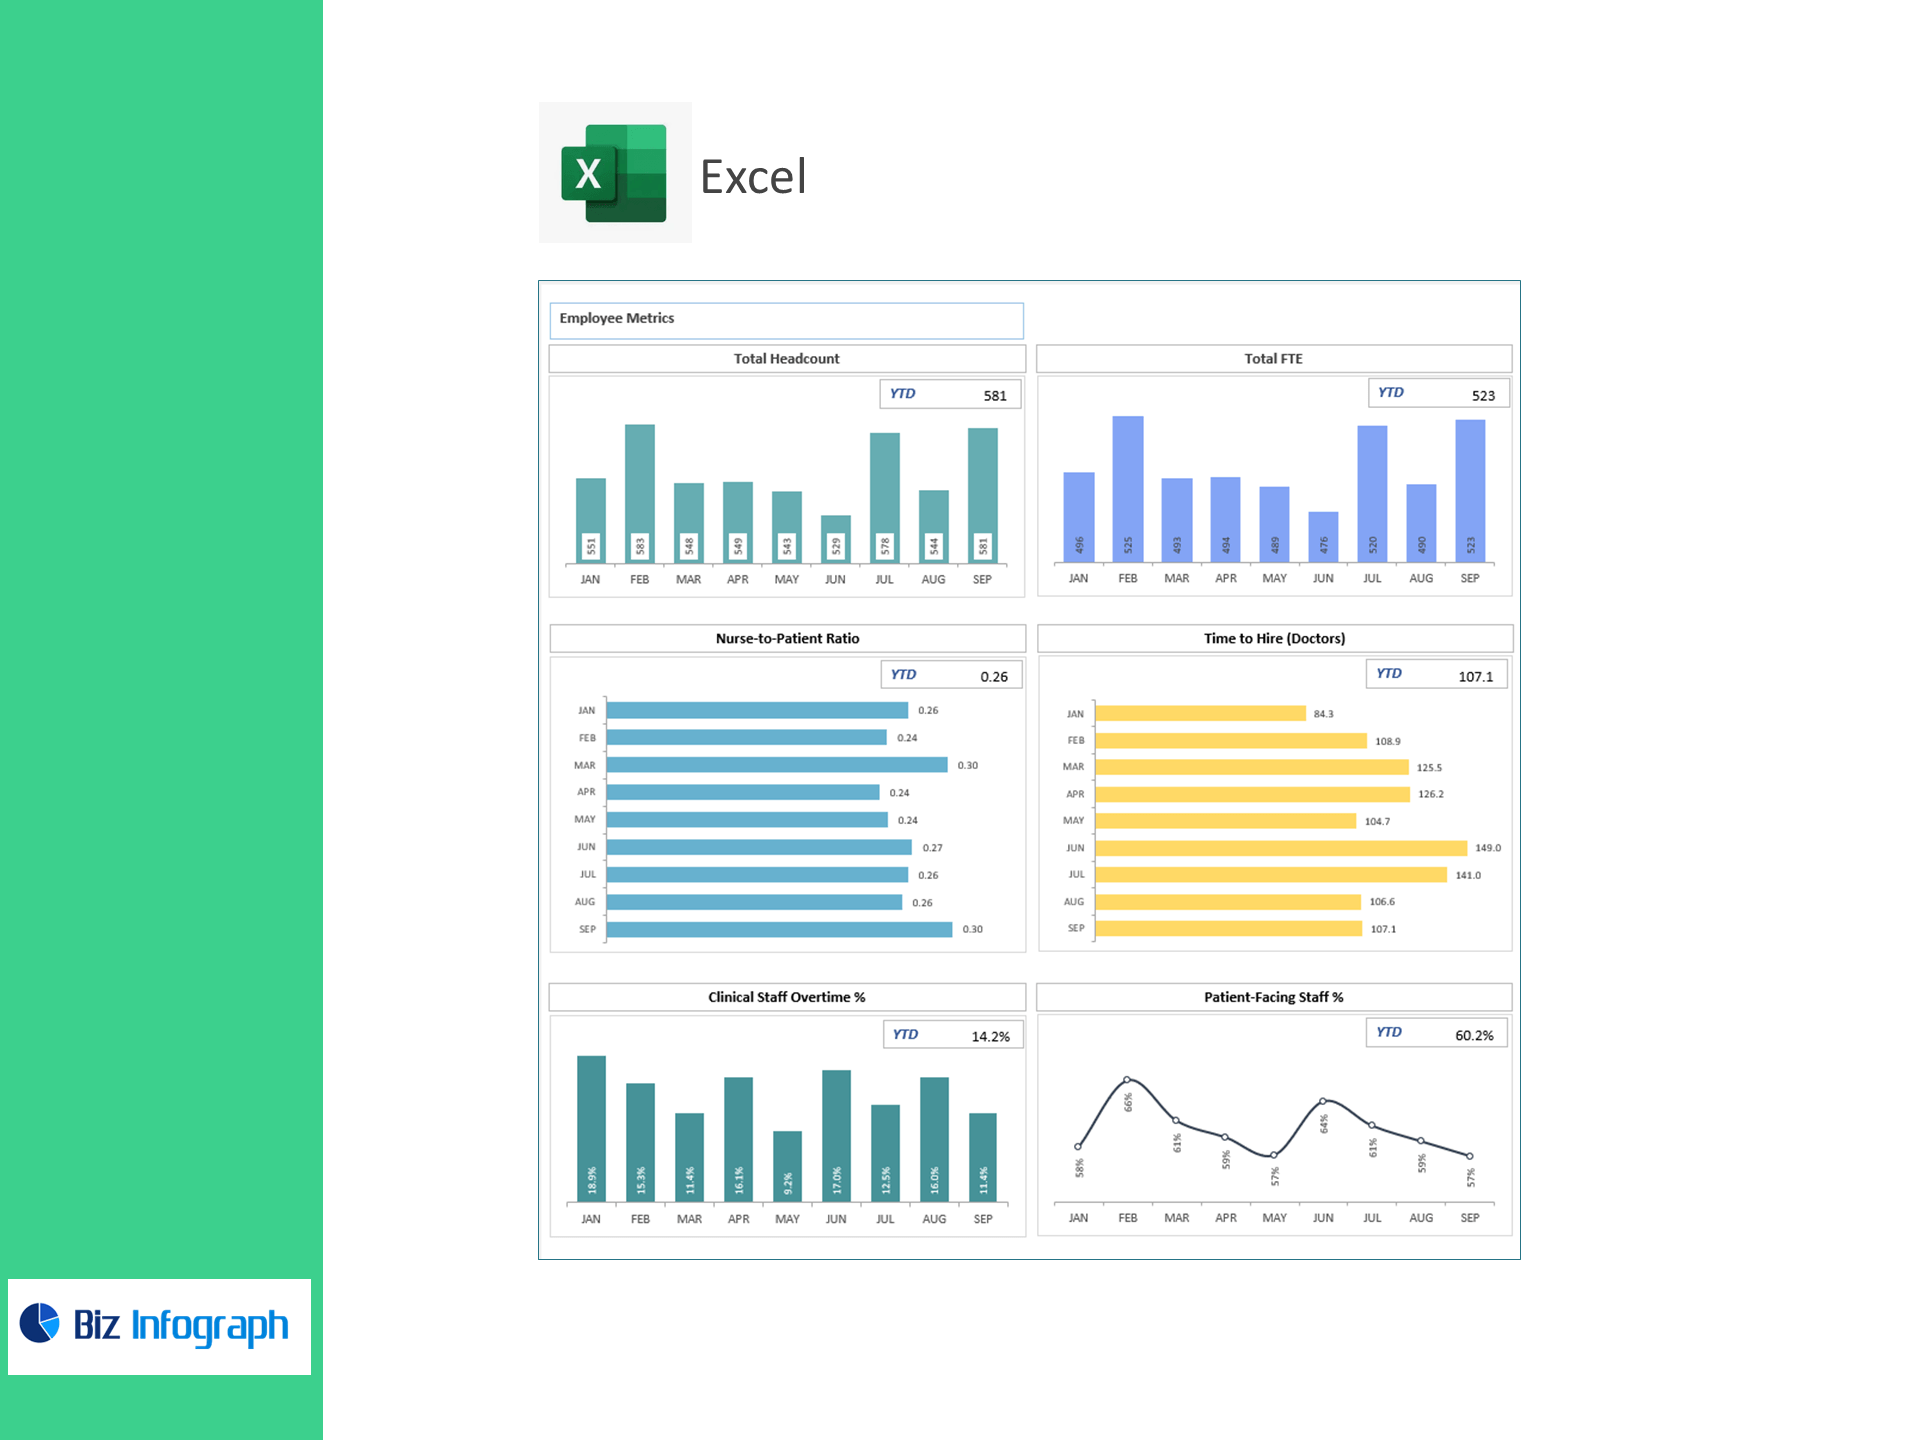
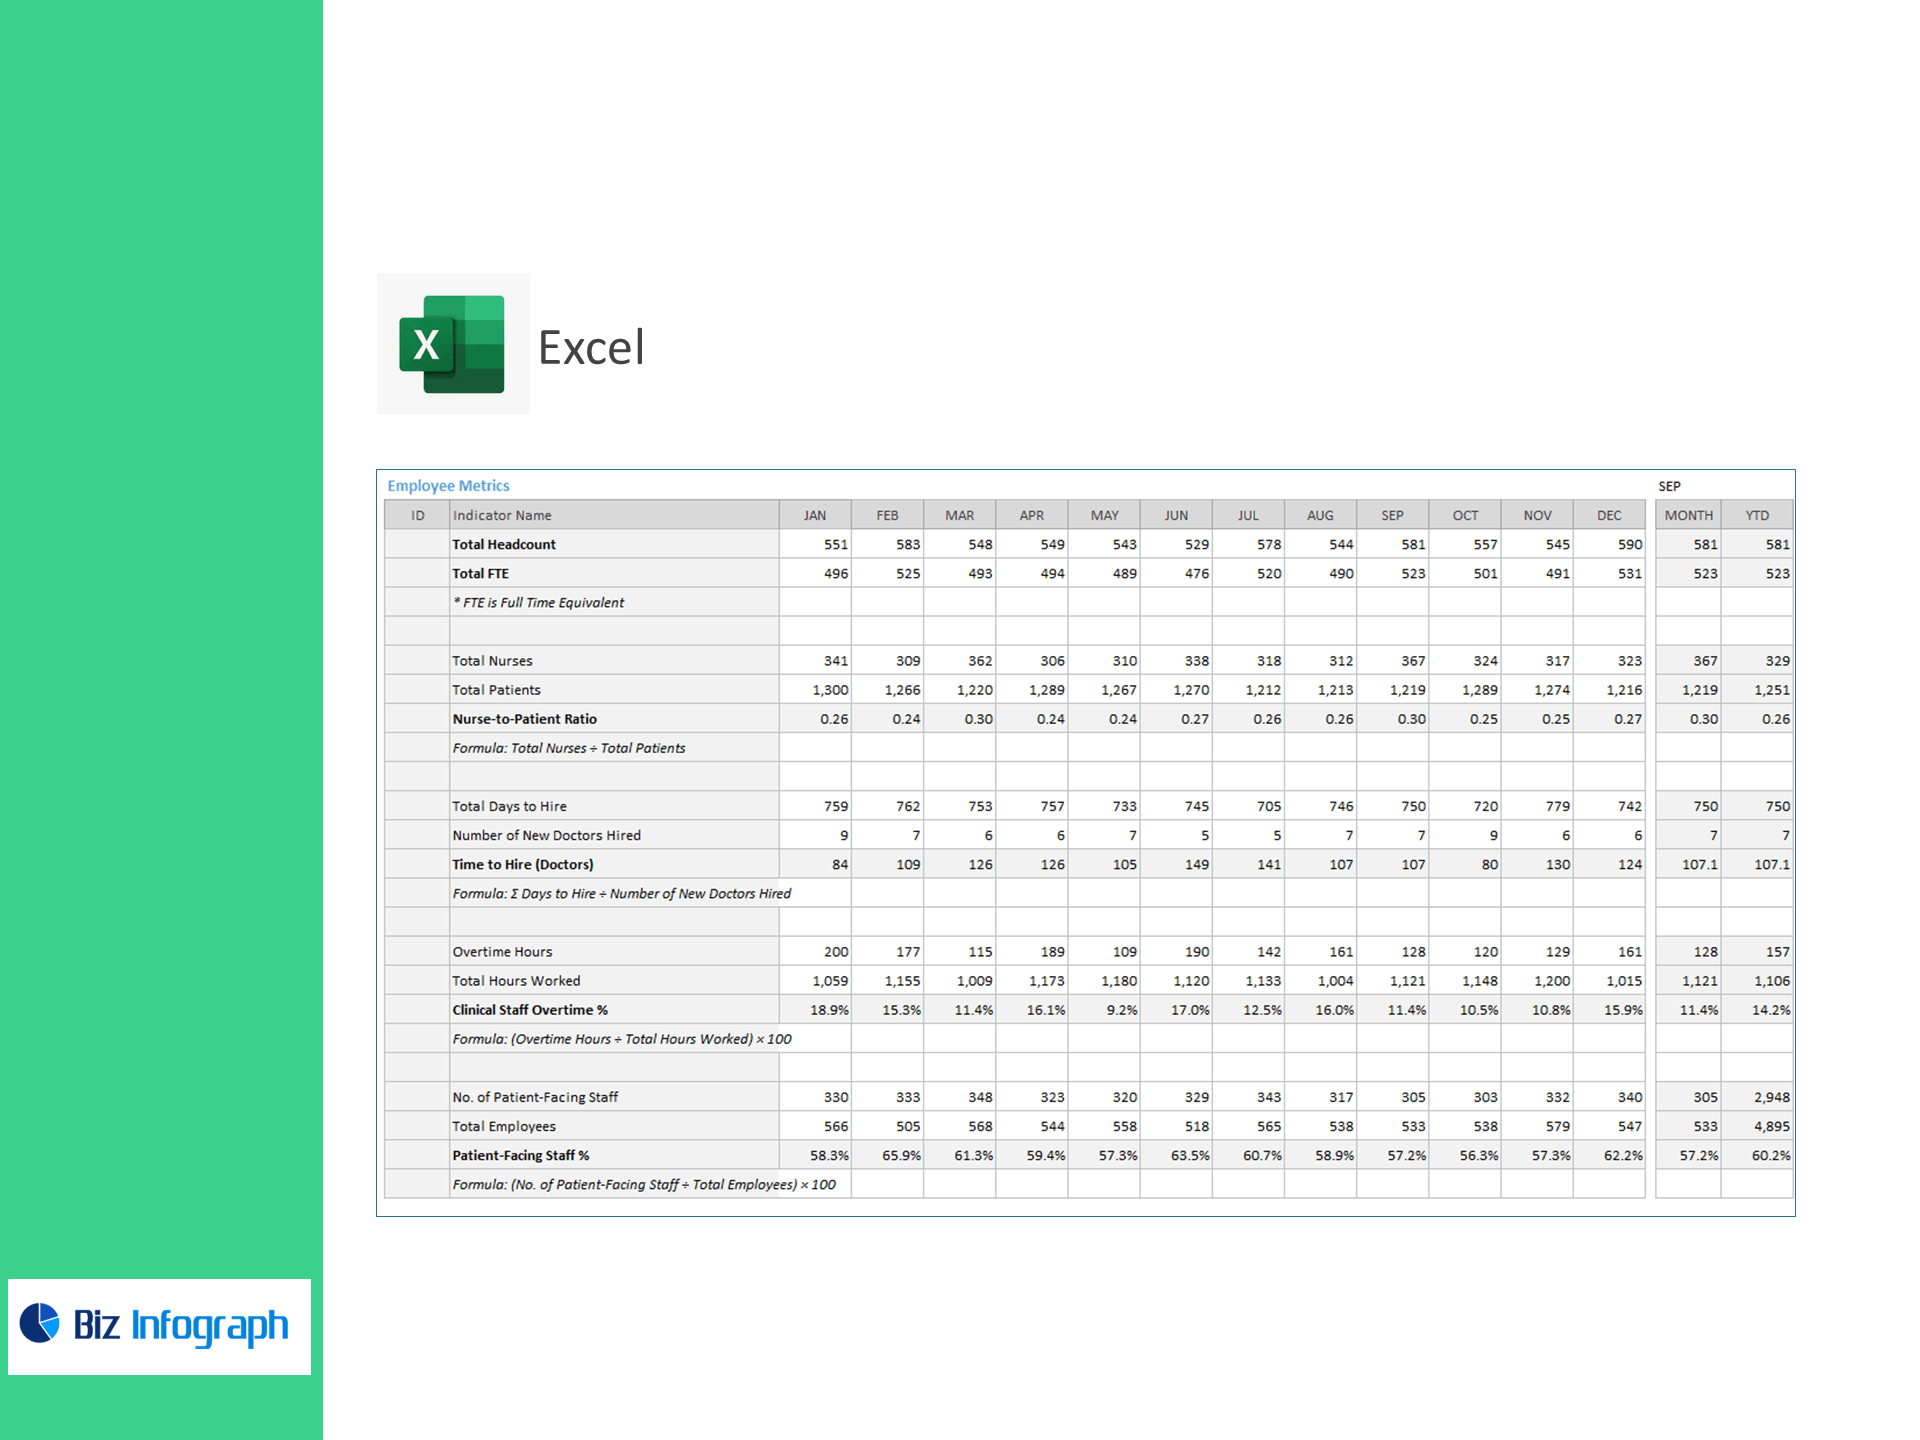
Capacity & Coverage
-
Total Headcount, Total FTE
-
Nurse-to-Patient Ratio = Total Nurses ÷ Total Patients
-
Patient-Facing Staff % = Patient-Facing Staff ÷ Total Employees × 100
Hiring & Scheduling
-
Time to Hire (Doctors) = Σ Days to Hire ÷ New Doctors Hired
-
Clinical Staff Overtime % = Overtime Hours ÷ Total Hours Worked × 100
-
Overtime Hours per FTE = Total OT Hours ÷ FTEs
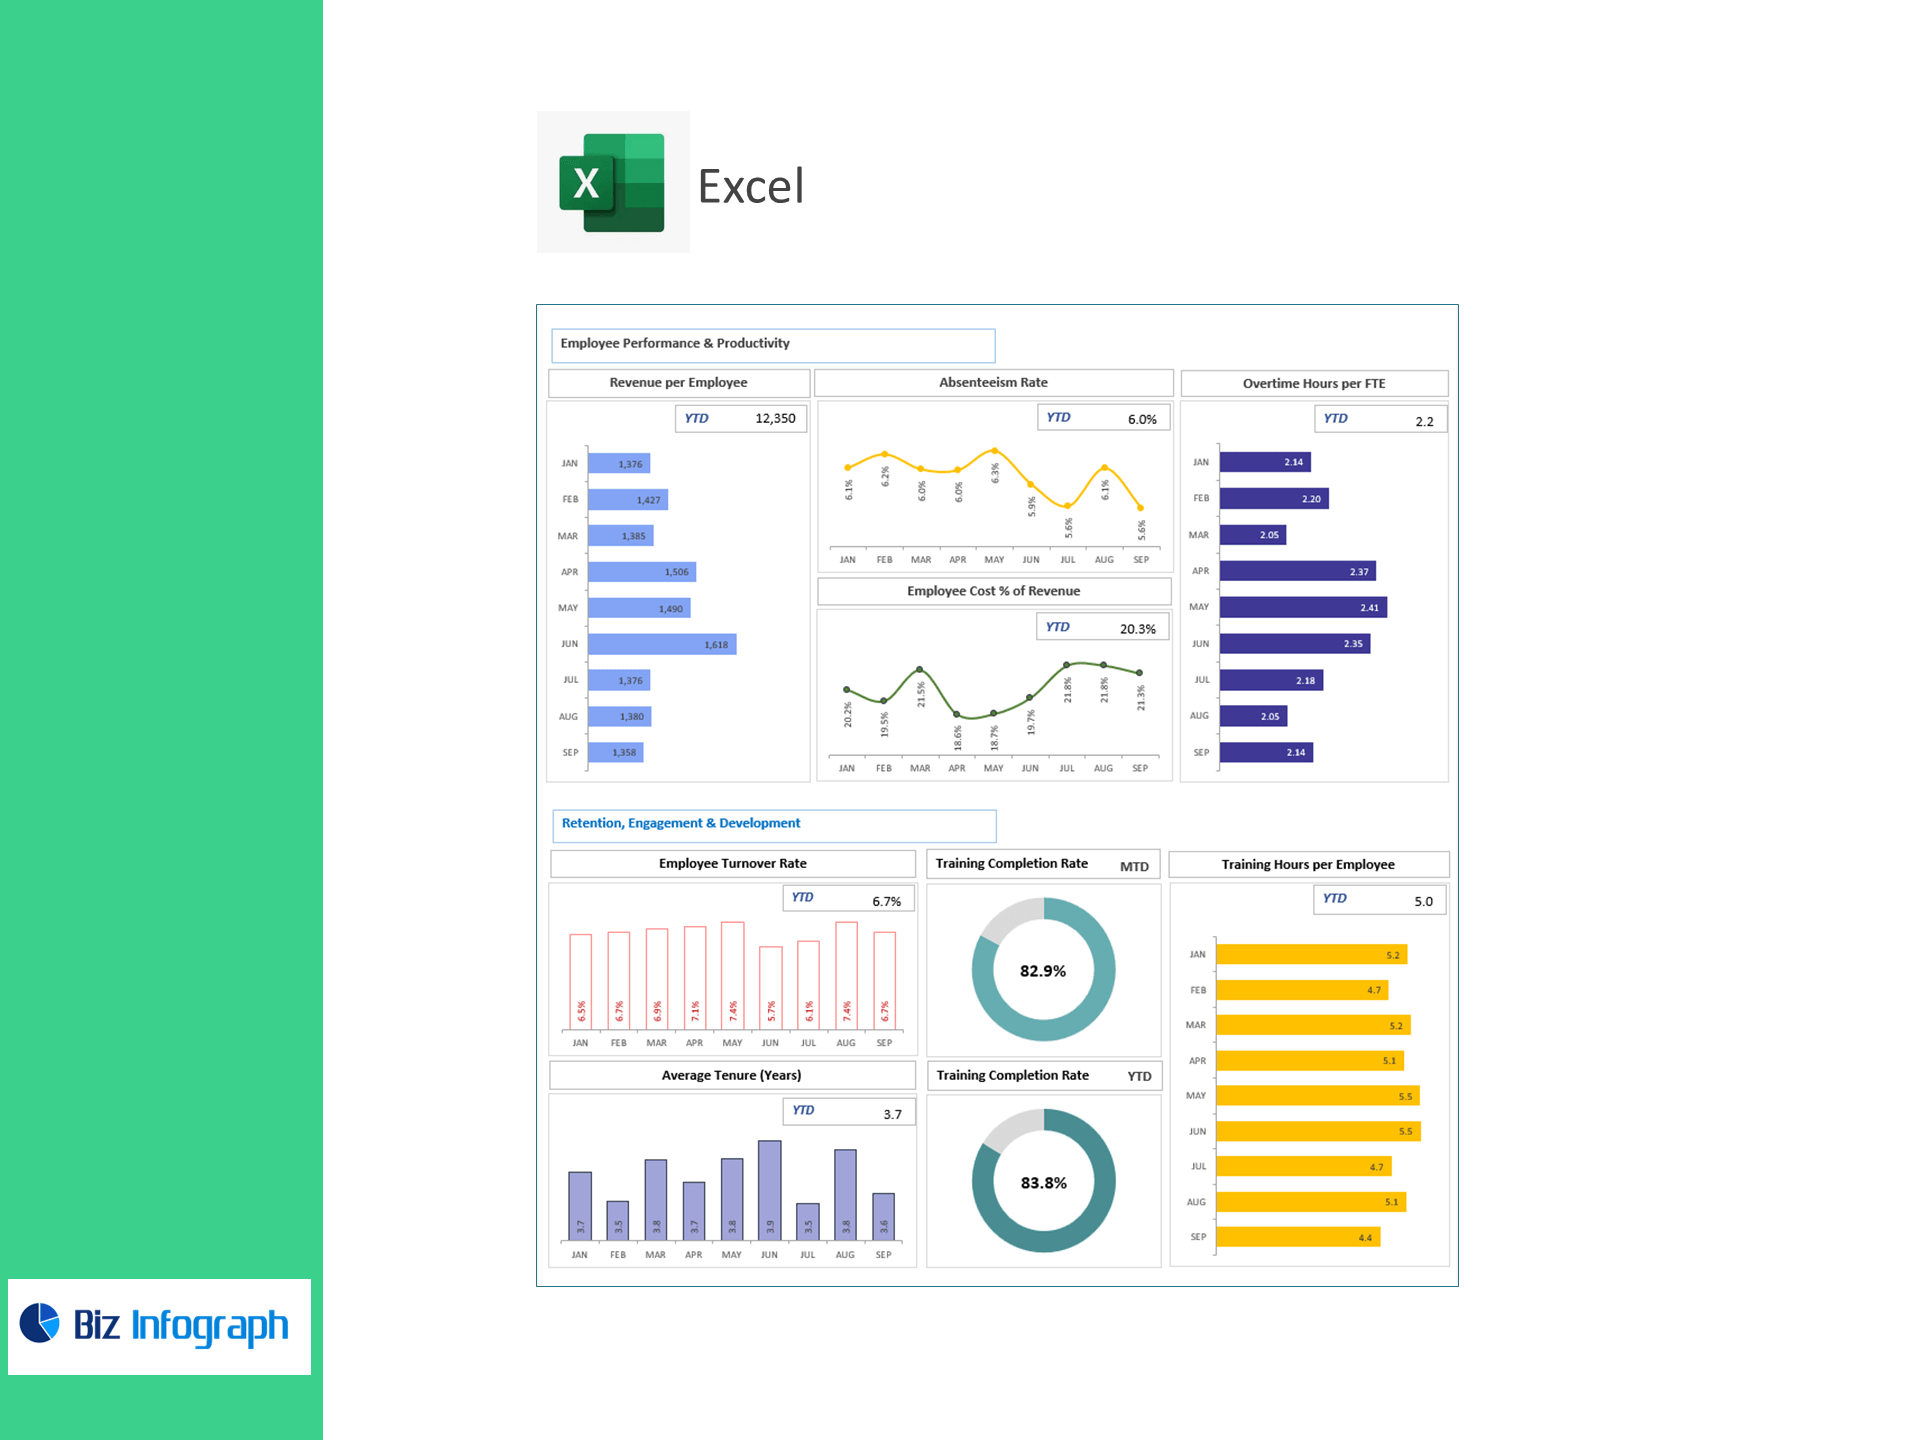
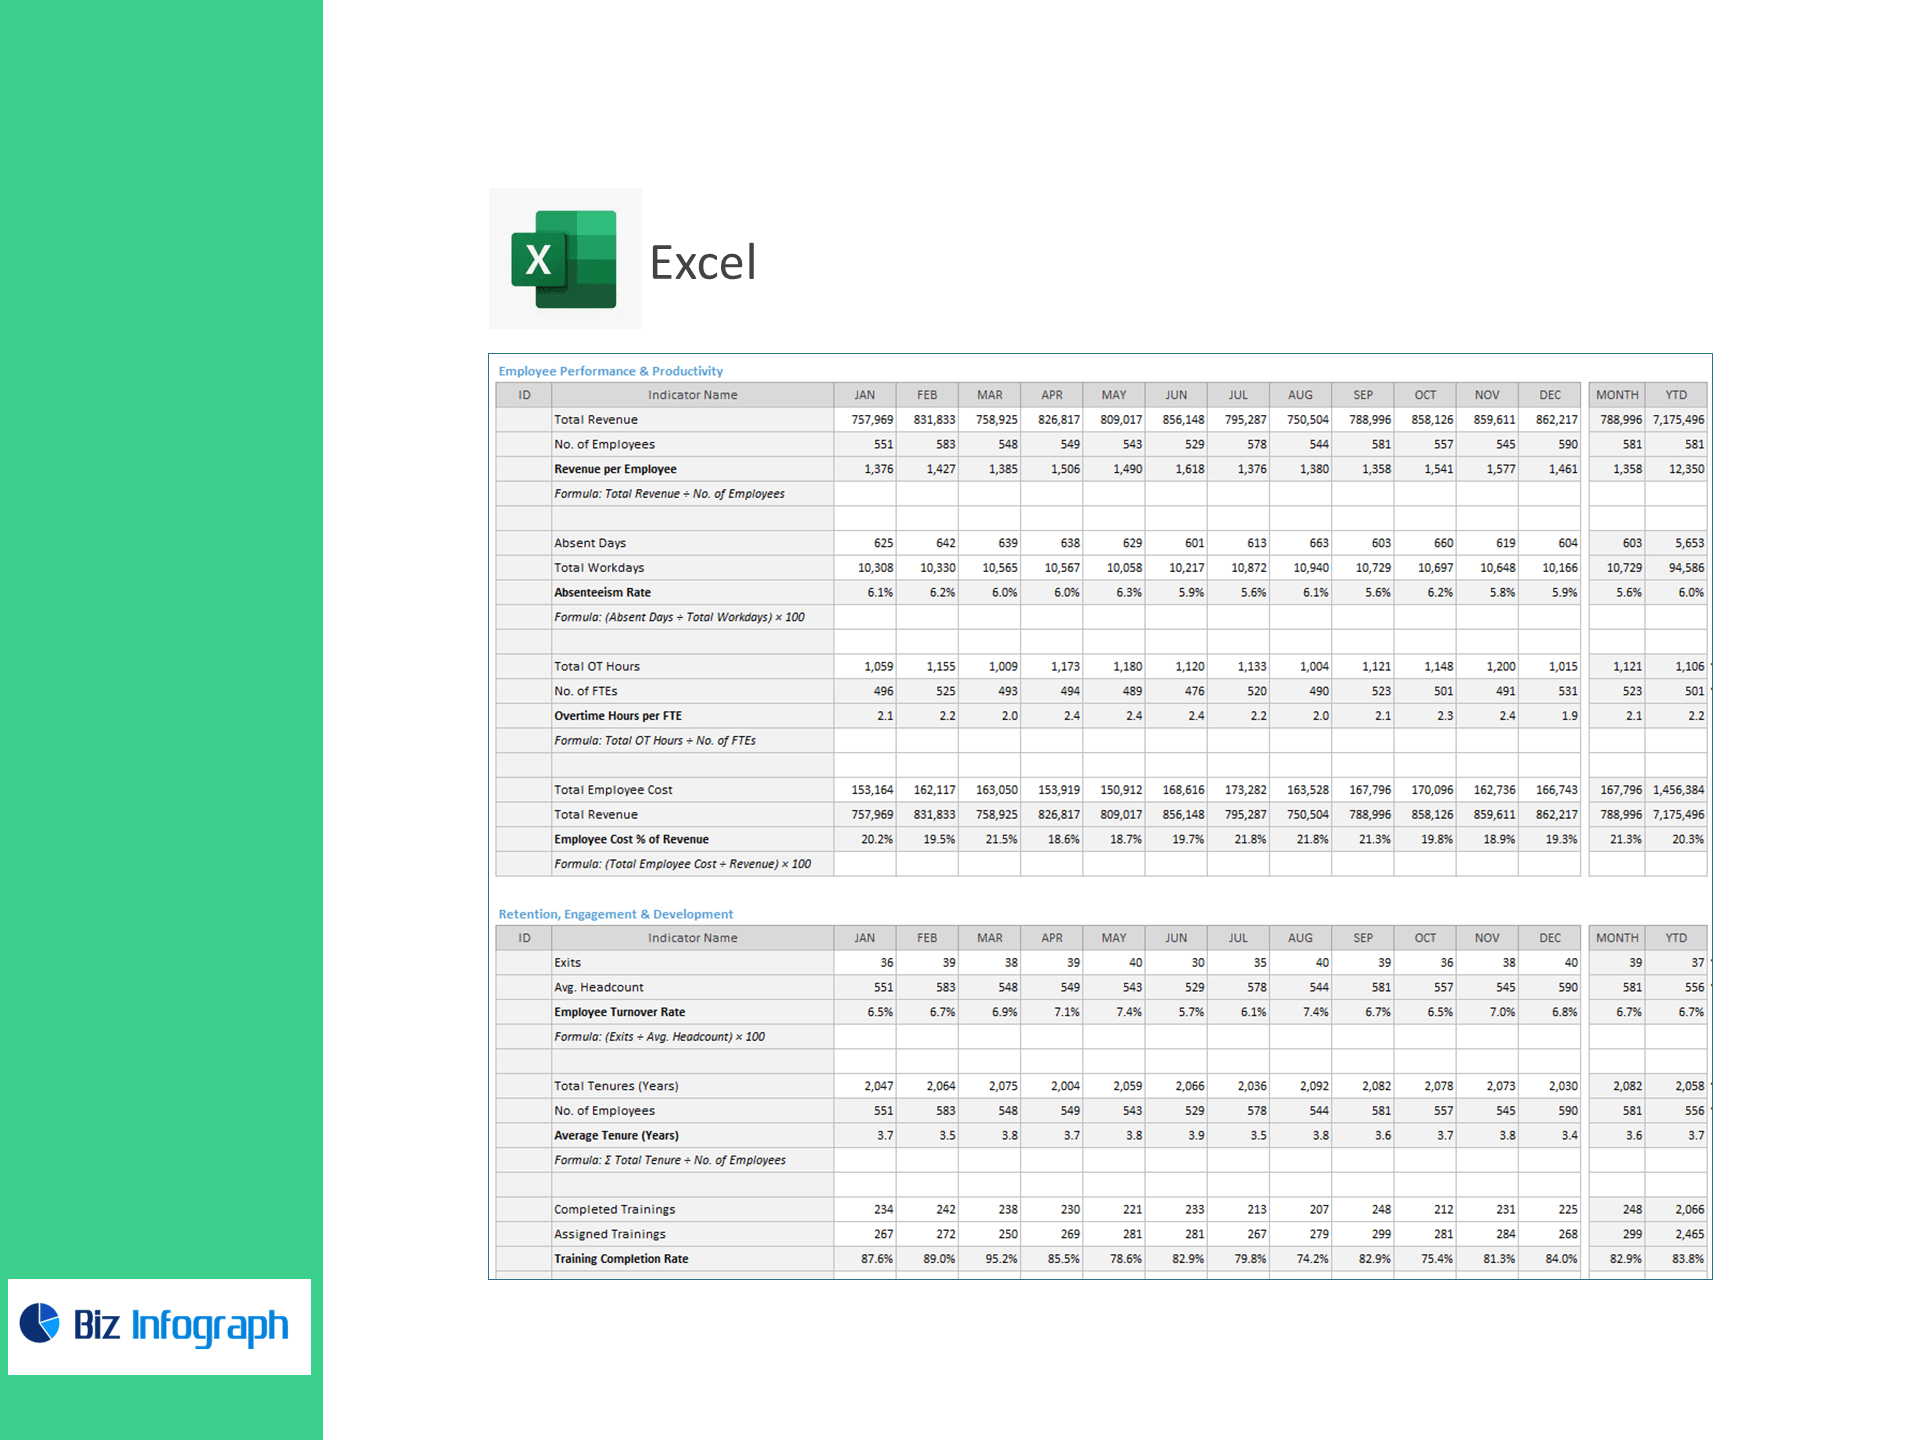
Productivity & Cost
-
Revenue per Employee = Total Revenue ÷ Employees
-
Employee Cost % of Revenue = Total Employee Cost ÷ Revenue × 100
-
Absenteeism Rate = Absent Days ÷ Workdays × 100
Retention, Engagement & Development
-
Employee Turnover Rate = Exits ÷ Avg. Headcount × 100
-
Average Tenure (Years) = Σ Tenure ÷ Employees
-
Training Completion Rate = Completed ÷ Assigned Trainings × 100
-
Training Hours per Employee = Total Training Hours ÷ Employees
What’s inside
-
Executive Dashboard: Tiles for coverage, overtime, hiring speed, productivity, cost %, turnover, tenure, and training—with trend & variance to target.
-
Staffing Mix & Scheduling: Patient-facing ratios, OT hotspots, and shift patterns by unit.
-
Hiring & Retention Hub: Pipeline speed, exits, and tenure by role/department.
-
Learning & Compliance: Completion rates and hours by unit, role, and course.
-
Targets & Assumptions: Enter KPI targets; automatic Above/Below Target highlighting.
-
Clean Data Sheets: Import-ready tables for Headcount/FTE, Hours & OT, Hiring, Absences, Payroll/Cost, Revenue, and Training.
How it works
-
Paste CSV/Excel exports into the provided tables.
-
Set reporting periods and KPI targets.
-
Review visuals to right-size staffing, cut avoidable OT, and strengthen retention.
Benefits
-
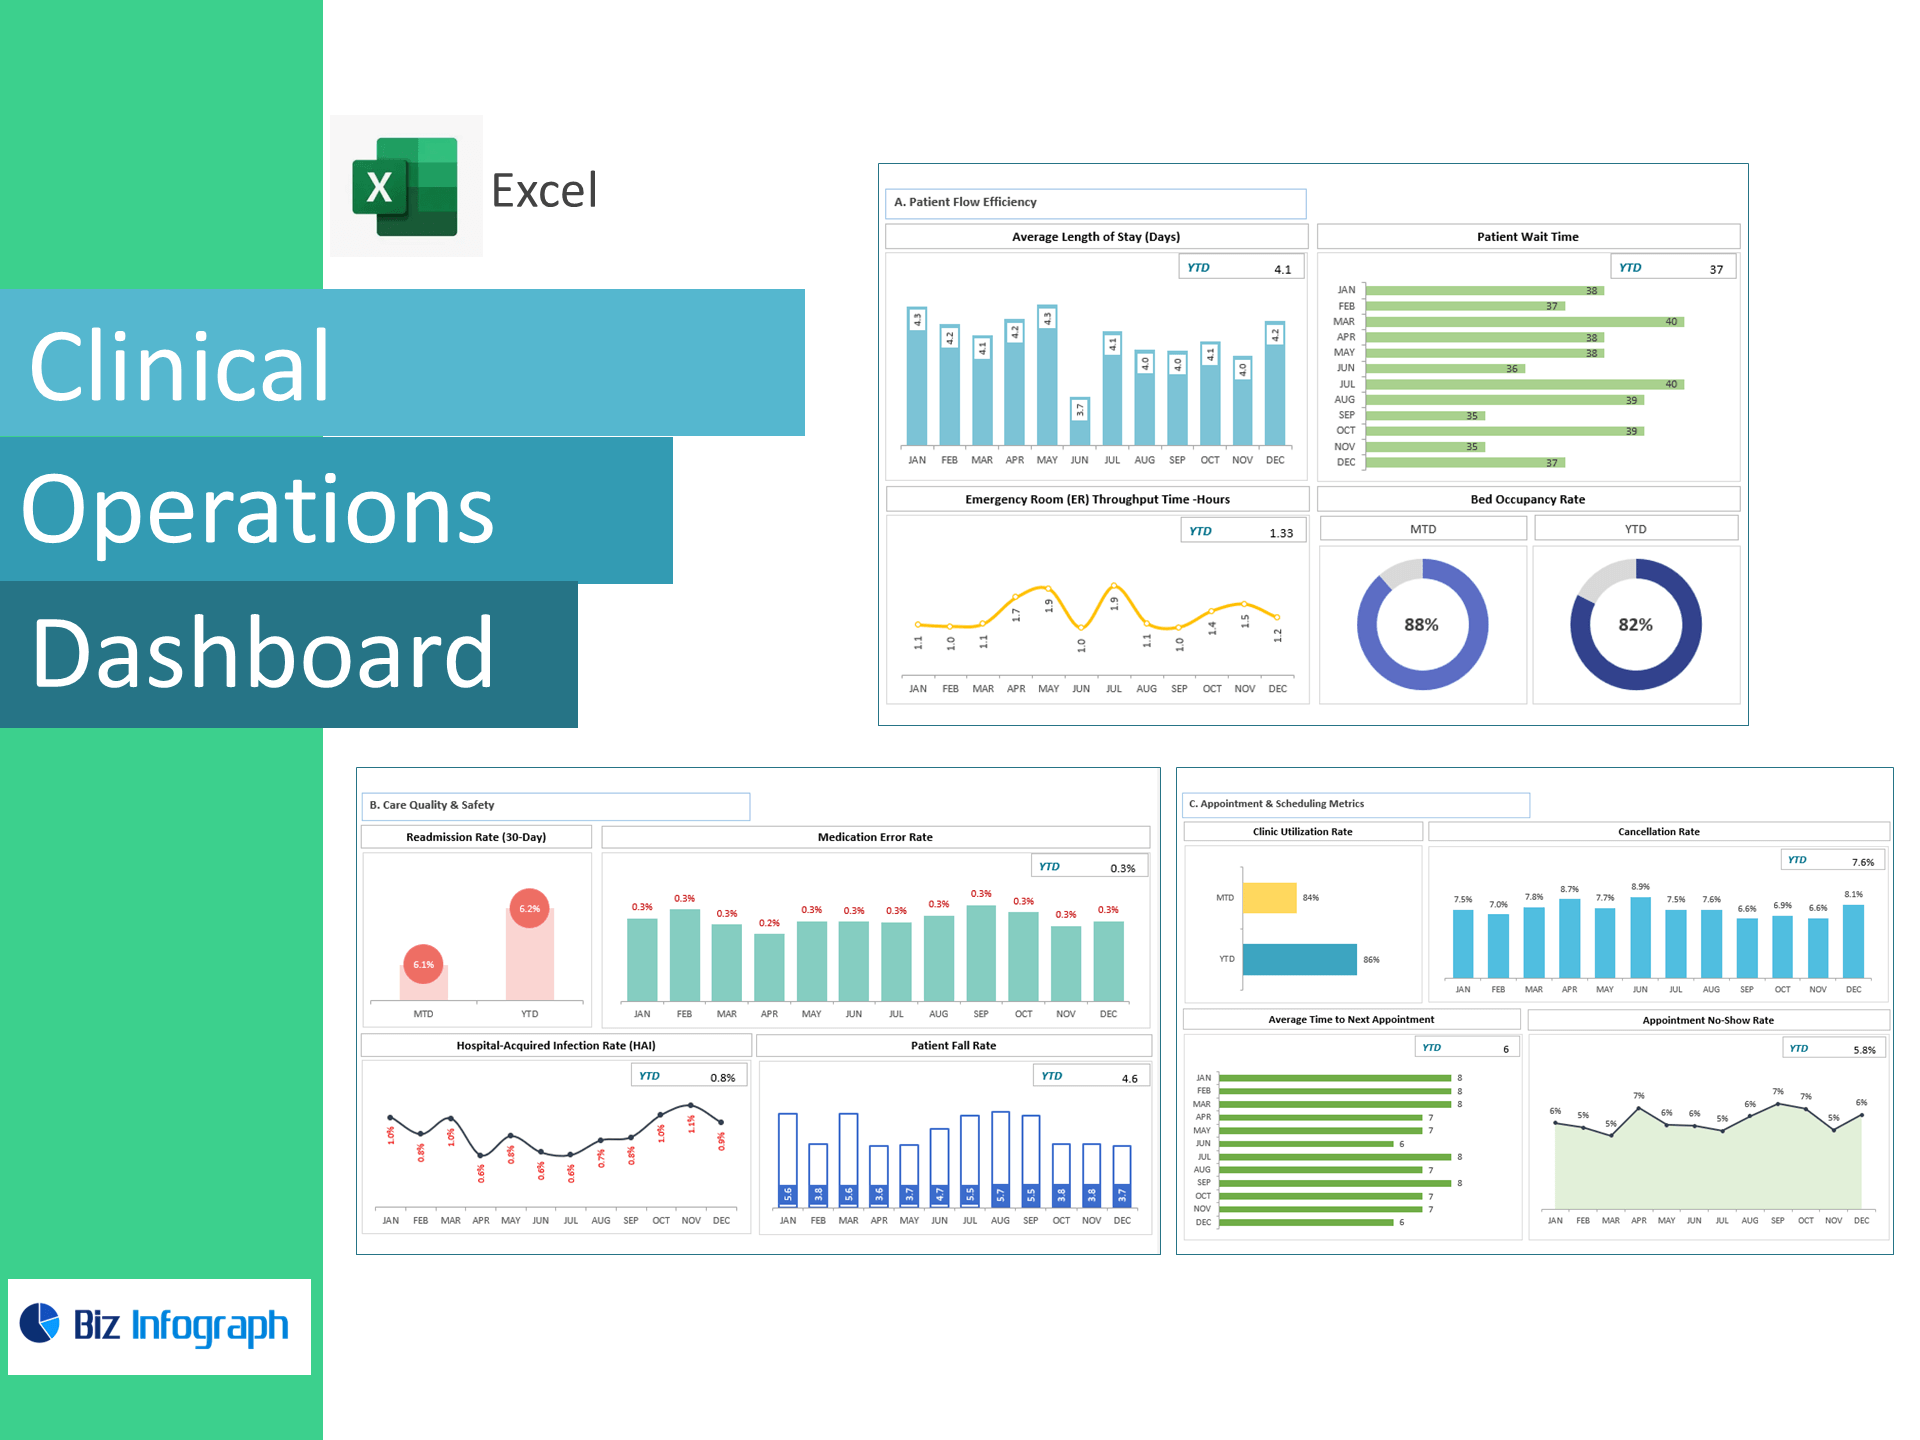
Improve coverage & safety: Monitor nurse-to-patient ratios in real time.
-
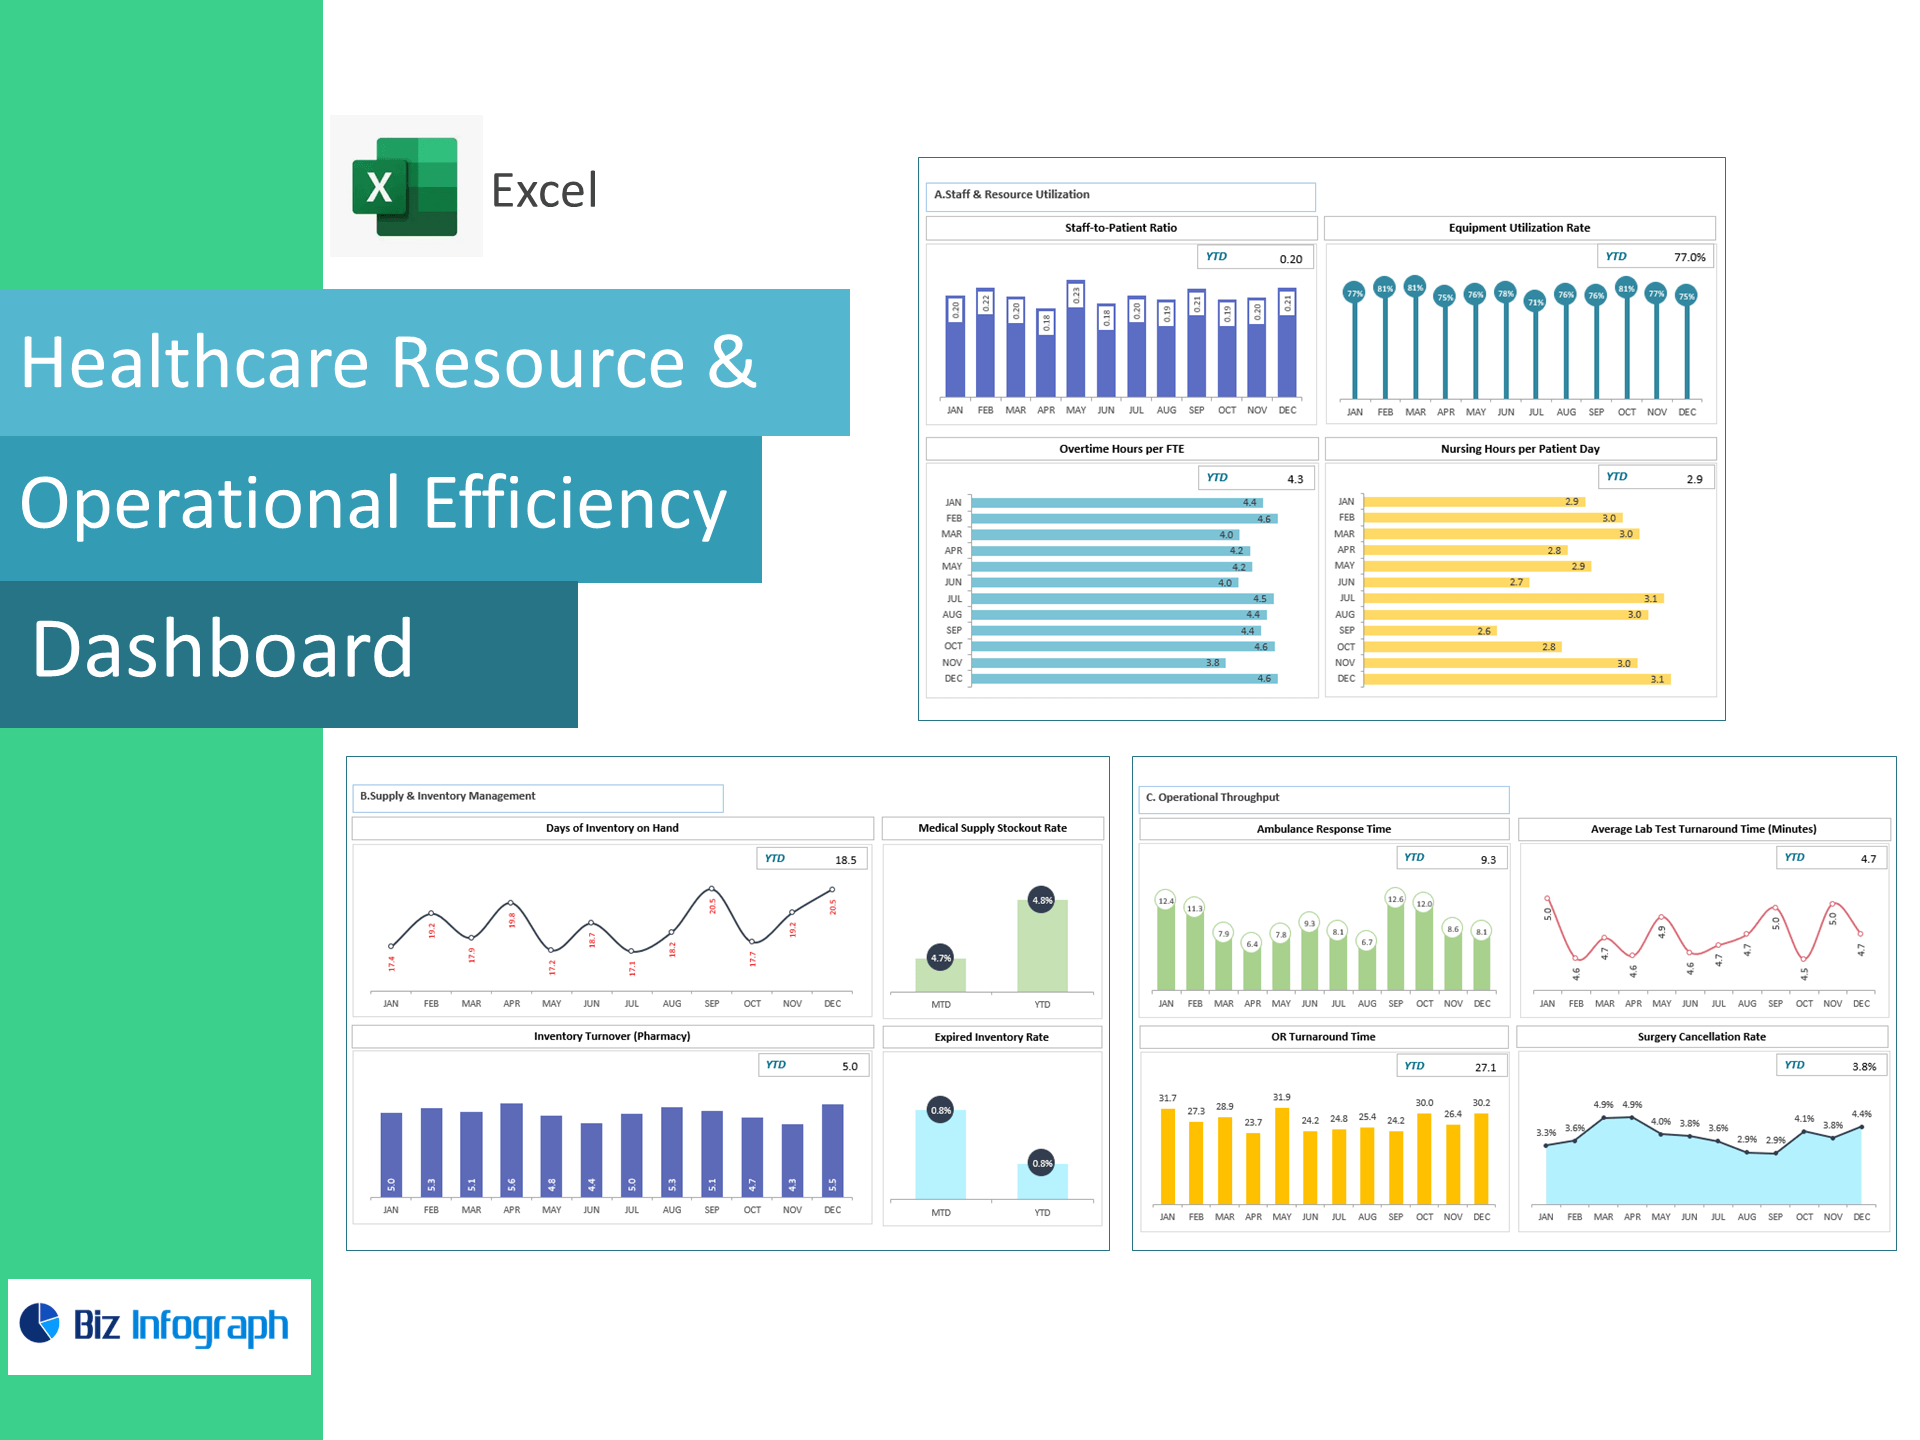
Reduce labor waste: Identify OT/FTE and absenteeism drivers quickly.
-
Hire & onboard faster: Shorten time to hire and lift training completion.
-
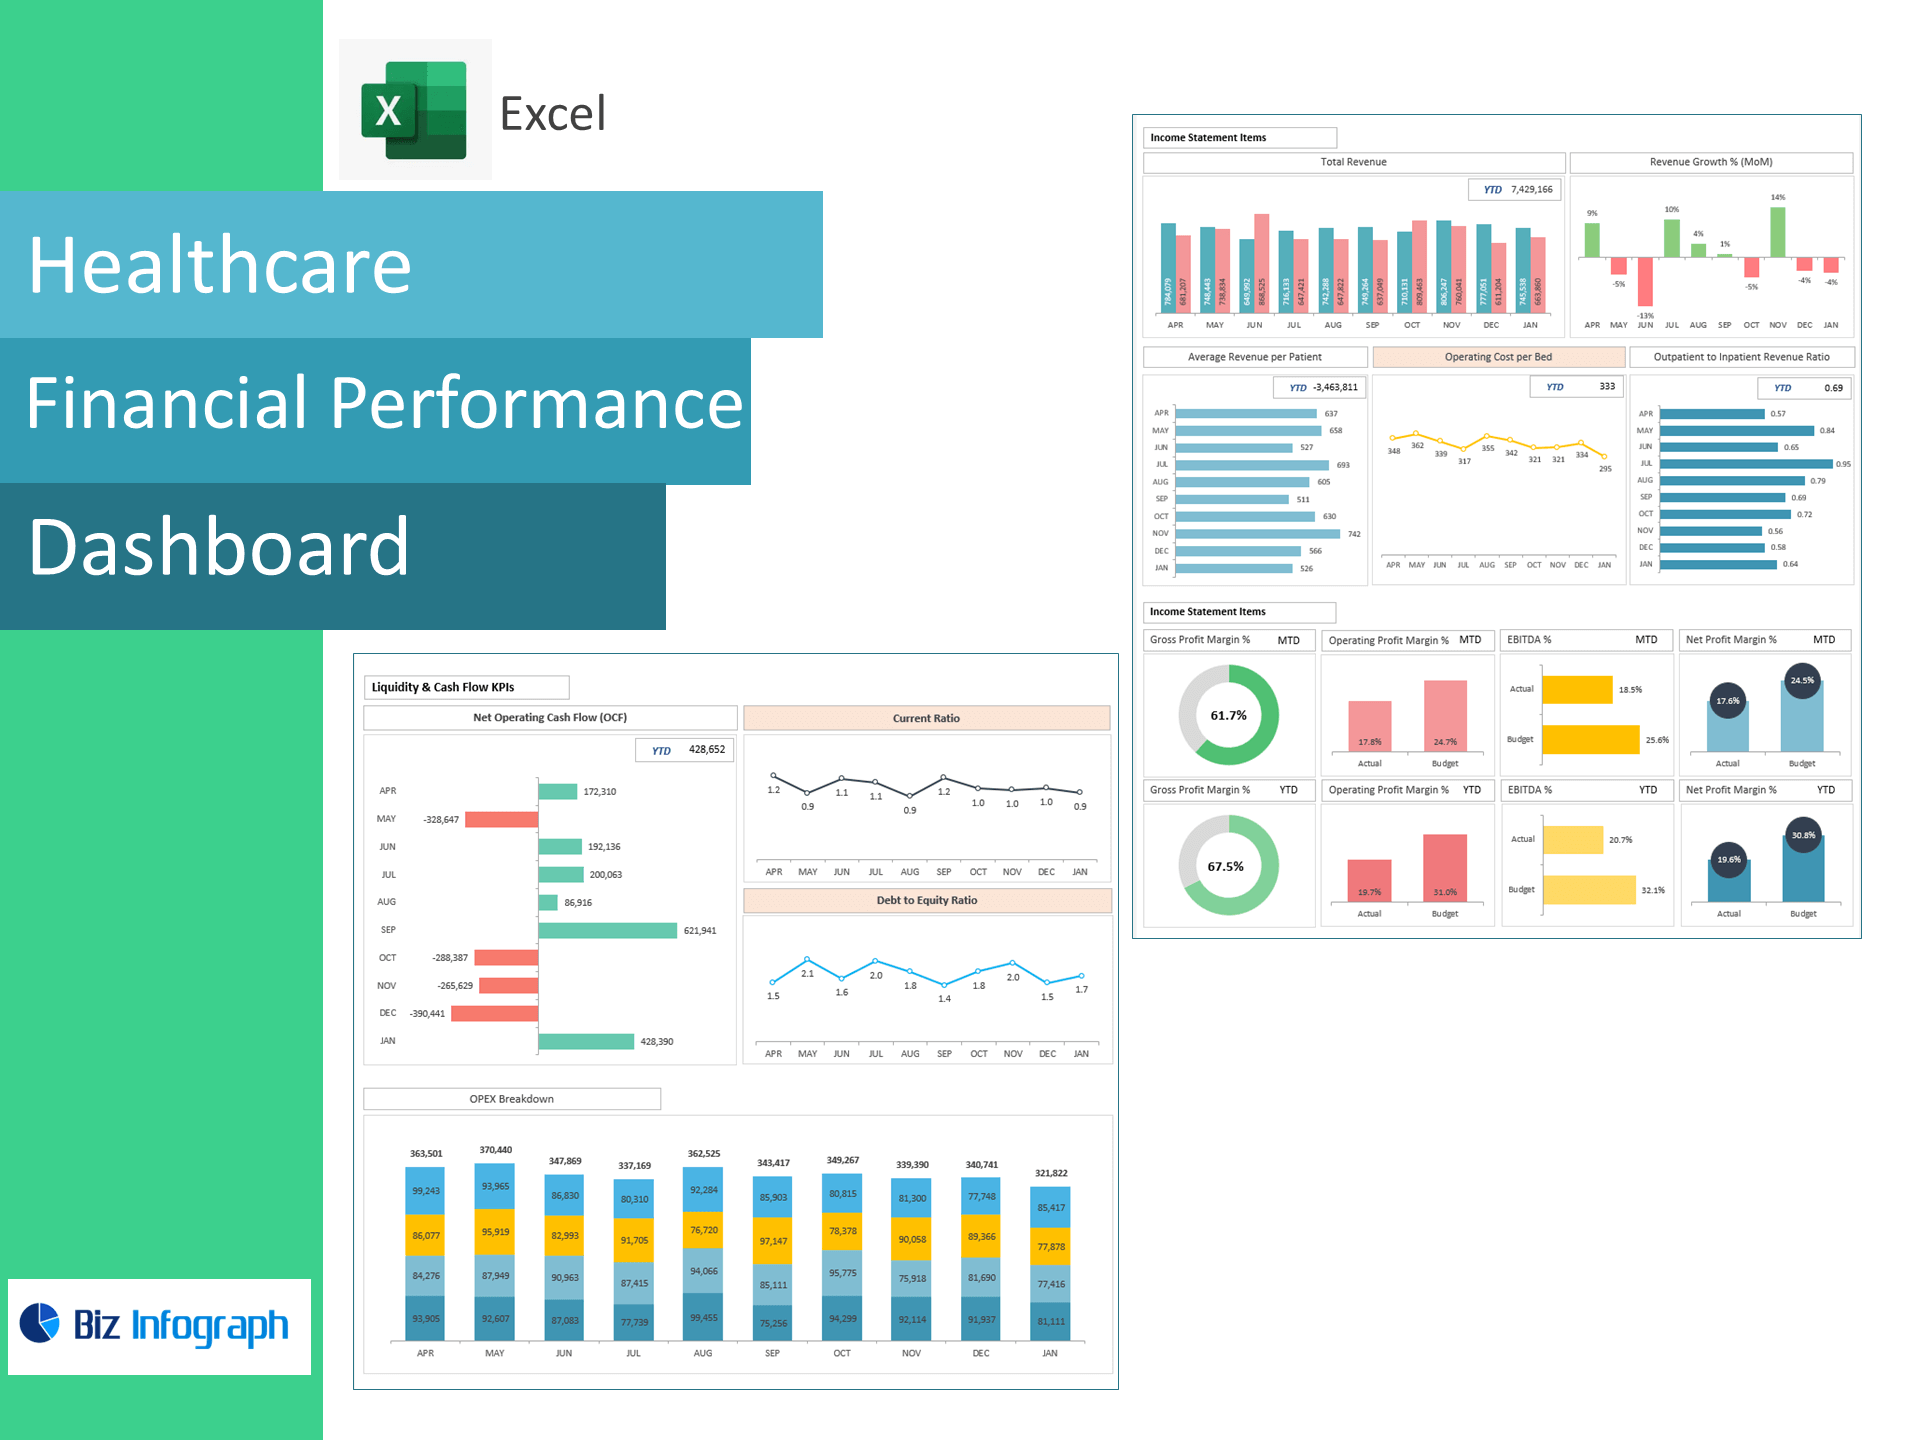
Prove ROI: Link HR actions to revenue per employee and cost outcomes.
For ready-to-use Dashboard Templates: