IRR in Excel is a cornerstone metric in financial analysis, offering a comprehensive gauge of an investment’s profitability over its lifespan. Whether you’re a seasoned financial analyst, an aspiring entrepreneur, or a project manager keen on maximizing project value, understanding how to calculate the Internal Rate of Return (IRR) in Excel is paramount. This guide will meticulously walk you through the nuances of IRR, providing you with a clear, step-by-step methodology to harness this powerful function in Excel. By mastering IRR in Excel, you’ll be equipped to make astute, data-driven decisions, ensuring your investments and projects are aligned with your financial goals and benchmarks.
1. IRR in Excel Function– Syntax
IRR Formula
=IRR(values,[guess])
The IRR function uses the following arguments:
Values (required argument) – This is a collection of values that depicts a stream of cash flows. Investment values and net income values are part of cash flows. To determine the internal rate of return, values must have at least one positive and one negative value.
[Guess] (optional argument) – This is a user-specified value that is reasonably close to the anticipated internal rate of return (as there can be two solutions for the internal rate of return). The function will use 0.1 (=10%) as its default value if it is left out.
2. How to calculate IRR in Excel?
To calculate the Internal Rate of Return or IRR, follow below process:
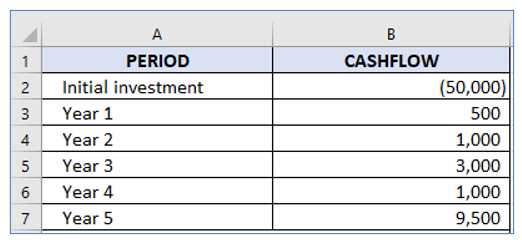
Step-1: Prepare a data table like below:
Step-2: Set a formula in cell B-9, outlined below:
The following formula can be used to get the IRR in excel:
=IRR(B2:B8)
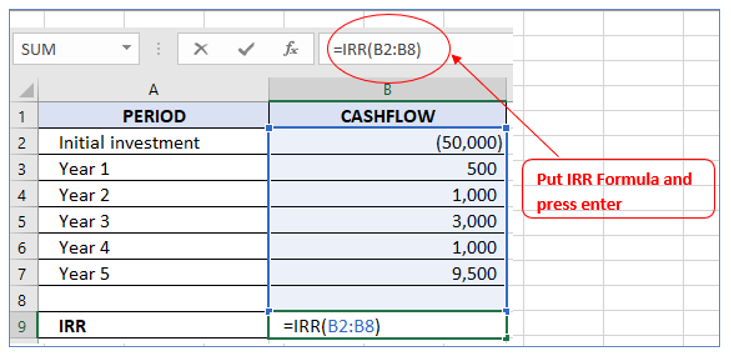
Since this is an outgoing payment, the initial investment has a negative value. Positive values represent the cash inflows.
Result outlined below:
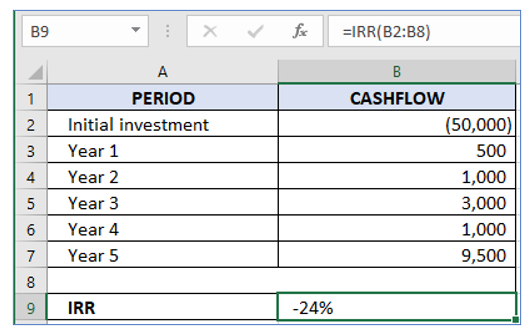
The internal rate of return is 24%.
3. How to analyze when investments generate profitable results?
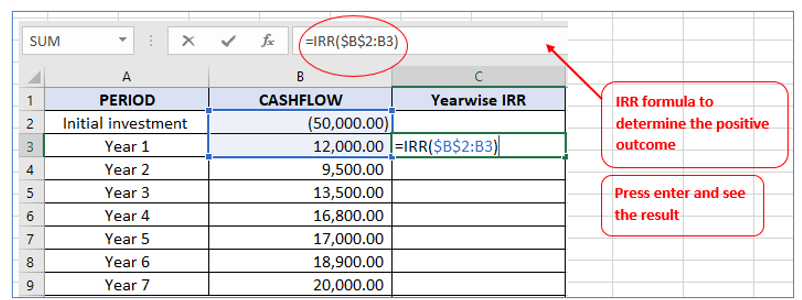
Additionally, you may determine the internal rate of return (IRR) for each period in a cash flow and determine precisely when an investment starts to show a profit.
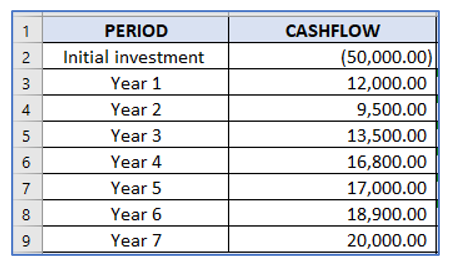
Let’s say we have the dataset below, where column B is a list of all the cashflows.
Step-1: Prepare a data table with information outlined below:
Step-2: Set a formula in cell C-3, outlined below:
The following formula can be used
=IRR($B$2:B3)
Step-2: Copy it to each of the other cells in the column.
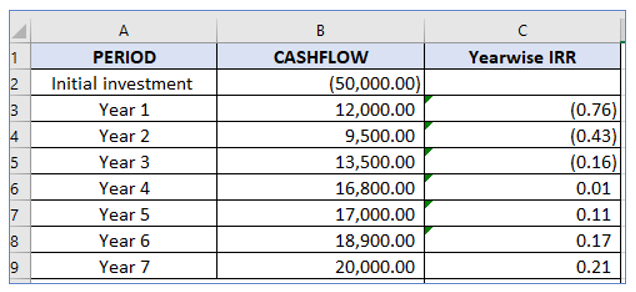
This overview demonstrates that after four years, the investment of $50,000 with the given cash flow has a positive IRR.
4. How to Compare Multiple Projects Using the IRR Function?
To analyze the investments and returns of various projects and determine which is the most profitable, utilize Excel’s IRR tool.
To Compare Multiple Projects, follow below process:
Step-1: Prepare a data table with information, outlined below:
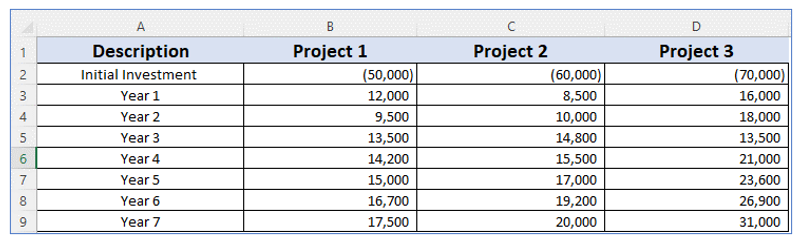
Here are the specifics of three projects, each of which had a start-up investment (which is represented as negative because it was an outflow) and a series of cash flows that are positive after that.
Step-2: Set a formula in cell B-11, outlined below:
Formula for Cell B-11:
=IRR(B2:B9)
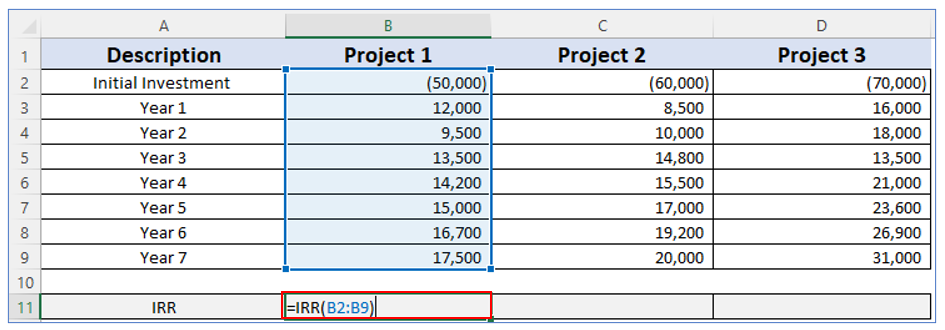
To figure out the IRR of project 2 use IRR(C2:C9) and IRR(D2:D9) for project 3. Or simply drag the cell b-11 to Cell C-11 and D-11.
Result outlined below:
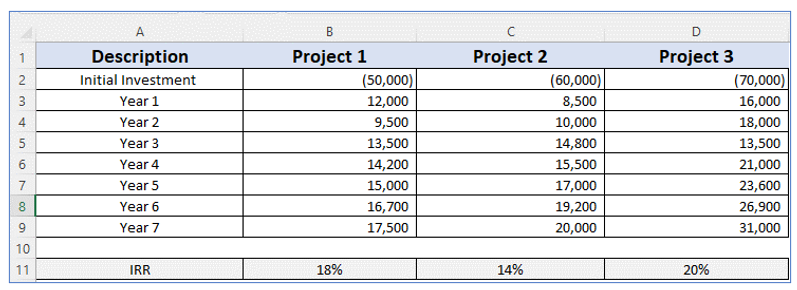
If the cost of capital is assumed to be 16%, investment 2 is unacceptable since its IRR is below than cost of capital. Project 2 would result in a loss; in contrast, investment in Project 3 is the most profitable because it has the highest internal rate of return which is 20%.
Therefore, if you must choose just one project to invest in, choose Project 3.
Also Read: How to Calculate Standard Deviation in Excel?
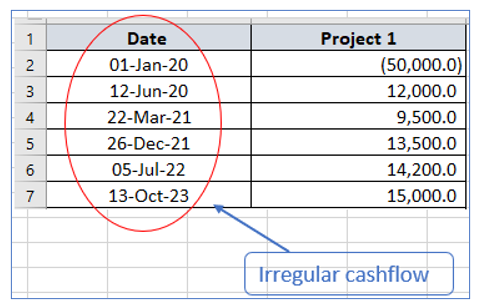
5. How to calculate IRR in Excel for irregular cashflows?
It is possible that your projects will occasionally pay off at irregular periods. The XIRR function is a different function that can provide you with the solution in this circumstance since the standard IRR can’t.
The XIRR function accepts both the cashflows and the dates, allowing it to take into account irregular cashflows and calculate the appropriate IRR value.
Step-1: Prepare a data table with information outlined below:
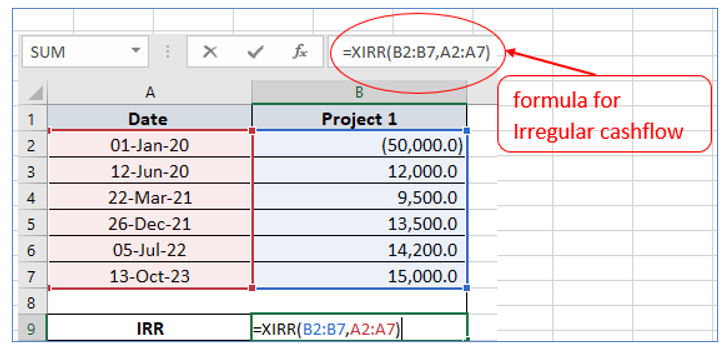
Step-2: Set a formula in cell B-9 to calculate the IRR for irregular cashflows, outlined below:
In this example, the IRR can be calculated using the below formula:
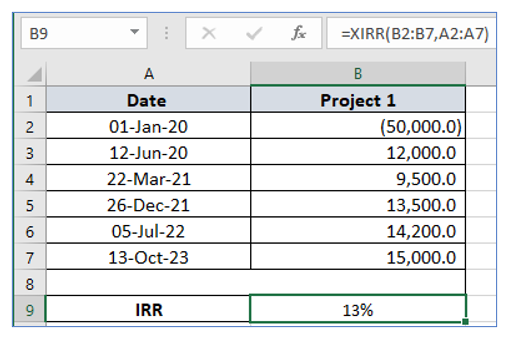
=XIRR(B2:B7,A2:A7)
Result outlined below:
Also Read: How to Calculate Compound Interest in Excel
6. Which is superior between IRR and NPV in Excel?
It is hard to properly understand the internal rate of return (IRR) without grasping NPV because the two concepts are intertwined. IRR offers the discount rate corresponding to a net present value of zero as its only output. The primary distinction between NPV and IRR is that the former is a numerical value, whilst the latter is the anticipated interest yield expressed as a percentage of an investment.
Typically, investors choose projects whose IRR exceeds their cost of capital. However, choosing projects based on the IRR rather than the NPV could lead to less-than-ideal economic results. IRR and NPV may “conflict” with one another because of how they differ from one another; one project may have a greater NPV while the other a higher IRR. Finance professionals suggest favoring the project with a higher net present value whenever such a conflict occurs.
The two approaches listed above function because a company’s goal is to maximize the wealth of its shareholders, and the best way to do that is by selecting the project with the highest net present value.
NPV is the best method for ranking projects that are mutually incompatible because it is significantly more dependable than IRR. Actually, when ranking investments, NPV is thought to be the best measure. IRR expresses results in percentages and can only tell you if an investment will break even. NPV is a superior measure of profitability since it can demonstrate the potential surplus income from a project. Furthermore, NPV produces outcomes in absolute terms, which makes it a more realistic capital planning approach.
For ready-to-use Dashboard Templates:
