F-Test in Excel is an essential statistical tool for analyzing variances between data sets and determining the significance of differences. By leveraging the F-Test function in Excel, users can assess the variability of data and make informed decisions based on statistical evidence. Whether used for quality control, experimental design, or hypothesis testing, mastering the F-Test in Excel empowers users to conduct rigorous statistical analyses with ease and accuracy. With its versatility and reliability, the F-Test in Excel remains a cornerstone of data analysis in various fields, including finance, engineering, and scientific research. Incorporating this function into your Excel toolkit enables you to explore relationships between variables, validate assumptions, and derive meaningful insights from your data. Embrace the power of the F-Test in Excel to unlock new possibilities for statistical analysis and make confident decisions based on robust evidence.
This Tutorial Covers:
- What is F-Test in Excel
- How to Enable F-Test in Excel
- How to do F-Test in Excel (Step-by-Step)
- The Working of F-Test
- The Examples of F-Test
- Pros of F-Test in Excel
- Cons of F-Test in Excel
- Things to Remember
1. What is the F Test in Excel?
In Excel, the F-Test refers to a statistical analysis tool used to compare the variances of two or more data sets. It helps determine whether the variation among groups or samples is significantly different, aiding in the assessment of data reliability and significance.
The F-Test is particularly useful in scenarios where you want to compare the variability between multiple groups or treatments, such as in scientific experiments or quality control processes. By conducting the F-Test in Excel, you can identify whether the observed differences in variability are statistically significant, enabling you to make informed decisions based on your data analysis.
Excel provides built-in functions to perform the F-Test, making it a convenient and accessible tool for researchers, data analysts, and anyone working with data that involves multiple groups or treatments.
2. How to Enable F-Test in Excel?
To enable the F-Test functionality in Excel, you need to activate the “Data Analysis ToolPak” add-in, as it contains the F-Test and other statistical tools. By default, this add-in is not activated, but you can easily enable it.
The following steps explain how to enable F-Test in Excel by turning on the “Analysis ToolPak” add-In:
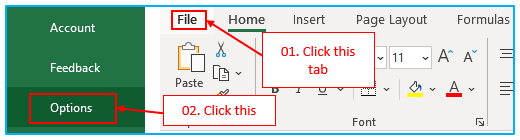
Step 1: Click on the “File” tab in the top-left corner of the Excel window to access the File menu.
From the File menu, select “Options” at the bottom of the navigation pane. The “Excel Options” dialog box will then be displayed.
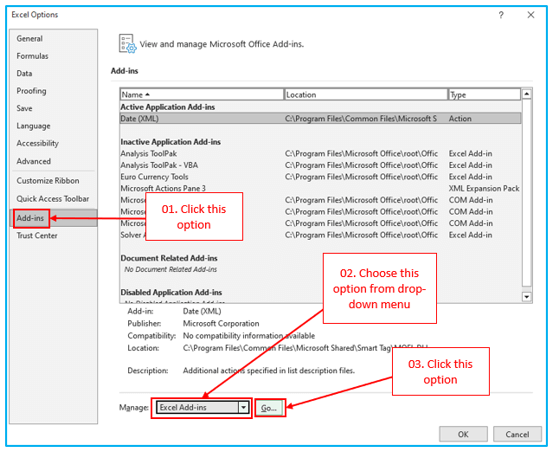
Step 2: Using the left-hand navigation pane of the Excel Options dialog box, select “Add-Ins”.
At the bottom of the Add-Ins window, you’ll find a drop-down menu labeled “Manage.” Click on the drop-down menu and select “Excel Add-ins.” Then click on the “Go…” button.
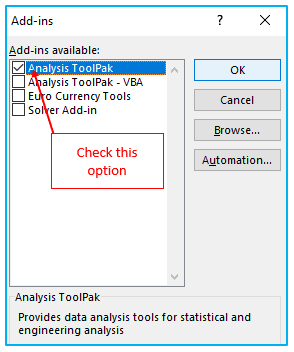
Step 3: In the Add-Ins dialog box, you will see a list of available add-ins. Look for “Analysis ToolPak” and make sure the checkbox next to it is selected.
After selecting the desired add-ins, click the “OK” button to close the Add-Ins dialog box.
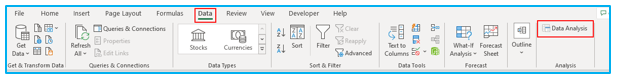
Step 4: Once you’ve completed the above steps, the Analysis ToolPak should now be loaded and available in Excel. You can find it under the “Data” tab in the “Analysis” group.
Note: The following steps are based on Excel 2016/2019 and Excel 365. The process might be slightly different for older versions of Excel, but the general idea remains the same.
3. How to do F-Test in Excel? (Step-by-Step):
Consider comparing the variation in product weights between two separate machines (Machine A and Machine B) if you work in a manufacturing organization. For each machine, you measured the weight of ten products that were chosen at random.
Let’s say you have a dataset that resembles the one below:
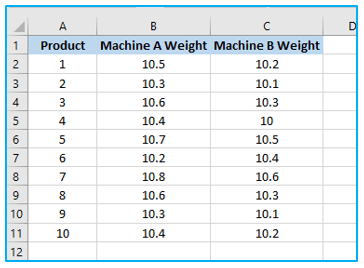
How to use F-Test in Excel is shown below:
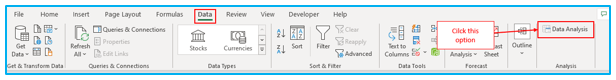
Step 1: Click “Data Analysis” under the “Analysis” category on the “Data” tab.
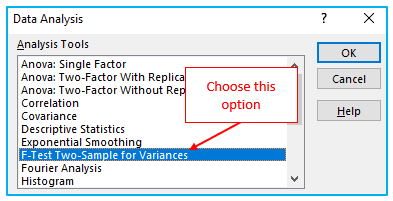
Step 2: From the list, choose “Exponential Smoothing” in the Data Analysis dialog box.
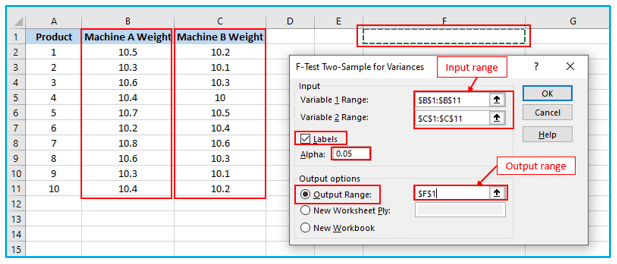
Step 3: Make the following selections in the “Exponential Smoothing” Dialogue box:
- In the “F-Test Two-Sample For Variances” dialog box, you’ll need to specify the Input Range for both Machine A and Machine B weights. For example, select the cells for “Machine A Weight” and “Machine B Weight” separately.
- Set the significance level (alpha) for this test. You can leave it as the default value of 0.05 for a 95% confidence level.
- You need to click the “Labels” checkbox as you have already chosen heading in the input range.
- To display the “Output Range,” you must first choose a range. The following column of the current data, F1, has been selected.
- All fields have now been filled in. To acquire the results, you must click “OK” right now.
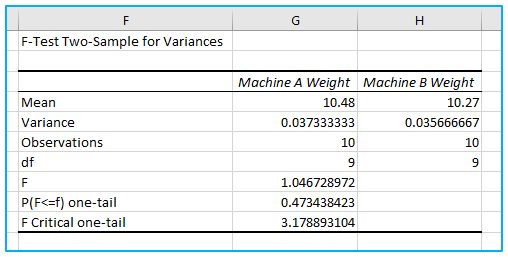
The screenshot that follows represents an F-Test in Excel.
Explanation:
Let’s now examine the data presented above:
- The mean of Variables 1 and 2 are 10.48 and 10.27, respectively, the mid-point of the product’s weight from each machine.
- A variance of Variables 1 and 2 are 0.037333333 and 0.035666667, respectively, showing the variation in the data set.
- Observations of Variables 1 and 2 are 10, which means only 10 data points or factors are considered in doing F-Test.
- df Degree of Freedom indicates that only 9 variables can be assigned to this statistical distribution.
- P (F<=f) one-tail is the probability distribution of variation in both the data set, which is coming to 0.473438423 (47.3% appx).
As you can see, the value of F is 1.046728972, which is lesser than the value of F Critical one-tail, which means this Null Hypothesis can be accepted.
4. The Working of F-Test:
The F-Test function is a statistical tool used to determine if a significant difference exists between the variances of two datasets. It is commonly employed in hypothesis testing to compare the variability of data from different groups or treatments.
Here are some key points to understand about the F-Test function:
- Purpose: The F-Test function helps us assess whether there is a significant distinction between the variances of two datasets.
- Null Hypothesis: The null hypothesis is accepted if the variances of the two datasets are equal. Conversely, it is rejected if the variances are found to be unequal.
- Probability Calculation: The F-Test calculates the probability or likelihood of variation between the two datasets.
- Error Conditions: The F-Test function will encounter errors under specific conditions, including:
- If either dataset contains less than two values.
- If the variance of either dataset is equal to zero.
- If only a single sample is provided, as the F-Test requires two datasets for comparison.
- Handling Data: The F-Test function disregards any text or non-numeric values in the sample data and provides numerical outcomes.
5. The Examples of F-Test:
The Excel F-Test can be applied in the following scenarios:
Analyzing Customer Satisfaction: F-Test to Compare Service Quality between Two Retail Stores
Testing Soil Fertility: F-Test for Variance in Crop Yield with Different Fertilization Methods
Evaluating Advertising Strategies: F-Test to Assess Sales Variability between Two Marketing Campaigns
Comparing Drug Efficacy: F-Test for Variance in Treatment Outcomes of Two Pharmaceutical Drugs
Investigating Manufacturing Processes: F-Test to Analyze Variability in Product Dimensions from Two Assembly Lines
Assessing Employee Performance: F-Test for Variance in Sales Achievements between Two Sales Teams
Examining Student Performance: F-Test to Compare Test Scores of Two Teaching Methods in Mathematics
Quality Control in Electronics: F-Test for Variance in Defect Rates between Two Production Lines
Analyzing Website User Experience: F-Test to Compare Time Spent on a Website with Two Different Designs
Comparing Traffic Flow: F-Test for Variability in Traffic Density between Two Road Intersection Designs.
6. Pros of F-Test in Excel:
The F-Test in Excel offers several advantages for data analysis and hypothesis testing:
- It can be applied to any set of statistical data where a Before/After, Latest/Previous comparison can be made to determine whether the statistical data can be accepted.
- The difference between the actual value and the expected or future value is called variance. Mean provides the mid-value, which is the average of all values. So, centricity is simple to see.
7. Cons of F-Test in Excel:
While the F-Test in Excel offers several benefits, it also has some limitations and drawbacks:
- It becomes challenging for those without statistical backgrounds to comprehend and quantify various observations.
- When executing the test in real-life settings, it becomes exceedingly challenging to accept or reject the test if there is only a small difference between F and F Critical one-tail values.
8. Things to Remember:
When using the F-Test in Excel or any statistical analysis, it is crucial to remember the following:
Flexibility with Data Sets: In Excel, the F-Test can be applied to one or more sets of data, not restricted to just two parameters. It allows for versatile comparisons and hypothesis testing across multiple groups or treatments.
Data Sorting: Before conducting an Excel F Test, ensure that the data is appropriately sorted. The sorting parameter should be relevant and correlated with the data to obtain meaningful and accurate results.
Data Formatting: To obtain reliable and sanitized results, perform fundamental data formatting before running the F-Test. This includes handling missing data, outliers, and ensuring data integrity.
By keeping these points in mind, users can effectively utilize the F-Test in Excel for various statistical analyses, enabling better insights and decision-making from their data.
Application of F-Test in Excel
- Variance Analysis: F-Test in Excel is commonly used to compare the variances of two or more datasets, helping assess the consistency or variability between groups.
- Hypothesis Testing: It aids in hypothesis testing by determining whether the variances of different groups are statistically significant, providing insights into the equality of population variances.
- Quality Control: F-Test is employed in quality control processes to assess the variability of manufacturing processes or product characteristics, ensuring consistency and reliability.
- Experimental Design: Researchers utilize F-Test to evaluate the effectiveness of experimental treatments or interventions by comparing the variability between treatment groups.
- Regression Analysis: In regression analysis, F-Test is used to assess the overall significance of the regression model by comparing the variability explained by the model to the variability not explained.
- ANOVA: F-Test is a fundamental component of Analysis of Variance (ANOVA), enabling the comparison of means across multiple groups while accounting for variability within and between groups.
You may be interested:
