“The Count if method in Excel is an essential tool for anyone looking to analyze and understand data efficiently. By leveraging the COUNTIF function, you can quickly tally up the number of cells that meet specific criteria, streamlining data management tasks and enhancing your analytical capabilities. Whether you’re tracking performance metrics, managing inventory, or conducting customer segmentation, this method provides the accuracy and efficiency needed for effective decision-making. Master the Count if method in Excel to transform complex datasets into actionable insights with precision and ease.
- What is COUNT IF in Excel?
- What Excel COUNTIF is for blank and non-blank cells?
- Apply the COUNTIF function to find duplicate values.
- Apply the Count function.
- Apply AND Criteria.
- Apply Or Criteria.
- Apply the COUNTIF function.
1. What is COUNT IF in Excel?
COUNTIF is a useful function in Microsoft Excel that counts the number of cells within a specified range that meet a certain condition or criteria. It’s categorized under the statistical functions in Excel and is commonly used for data analysis and summarization.
Syntax:
=COUNTIF(range, criteria)
range: This is the set of cells you want to search within. It can be a single cell, a range of cells or even a named range.
criteria: This defines the condition that tells the function which cells to count. It can be a number, text string, cell reference, or even an expression.
2. Excel COUNTIF for blank and non-blank cells
COUNTIF not blank
You might find formulas like this one for counting non-blank cells in Excel in certain Excel COUNTIF tutorials and other online resources: =COUNTIF(range,”*”). However, the aforementioned method only counts cells that have text values, even empty strings! This means that cells that include dates or numbers will be ignored and not counted as blank cells!
If you need a universal COUNTIF formula for counting all non-blank cells in a specified range, here you go: COUNTIF(range,”<>”)
COUNTIF blank
Use the same method to achieve the opposite goal, which is to count blank cells within a specific range: create a formula that uses the wildcard character for text values and the “” condition to count all empty cells. Formula to count cells not containing any text: COUNTIF(range,”<>”&”*”)
3. Apply the COUNTIF function to find duplicate values
Use one of the following formulas to count unique or duplicate values in a specific row instead of a column. these two below formulas could be useful for analyzing the history of lottery draws.
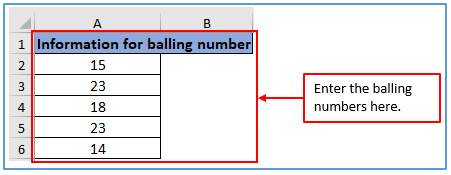
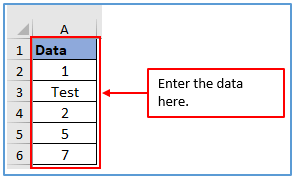
Step 1: Create a data table with some information of balling number as shown below.
Placed the information here.
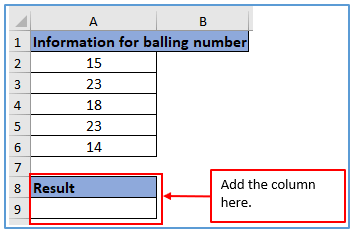
Step 2: Add the column in A9 and A10 to get the value.
Added the column here.
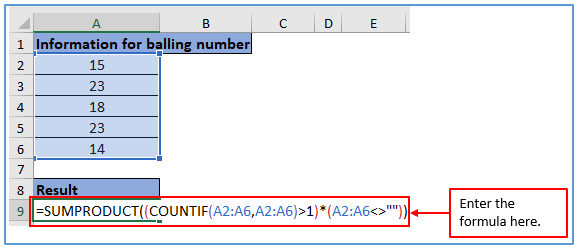
Step 3: Here you refer to the function that helps to get the duplicate value. Here you can refer to SUMPRODUCT and also COUNTIF after that refer rang. To get the duplicate you can refer to>1 and the asertic sign also. The formula is: =SUMPRODUCT((COUNTIF(A2:A6,A2:A6)>1)*(A2:A6<>””))
Applied the formula here.
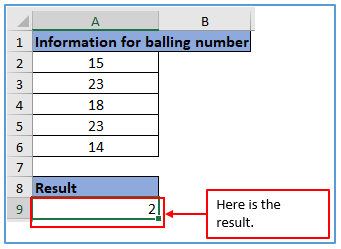
Step 4: In the end, hit enter to get value.
Here is the result below which is 2 because you can see below here are 2 same values.
4. Apply Count function
The count function is used for the numeric value and here are some steps to get the count value in below.
Step 1: Make a table in your Excel sheet first with some information as numbers and word as shown here.
Write down the information in the excel sheet.
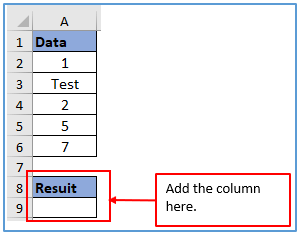
Step 2: Now, add another column in A8 and A9 to get the COUNT value.
The column has been added here.
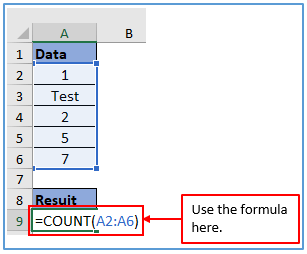
Step 3: Refer the count function and select A2:A6 from the range data the use the formula. The formula: =COUNT(A2:A6)
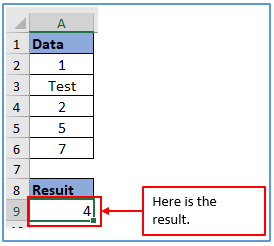
Step 4: After using the formula press Enter.
The result is 4 because, among the 5 samples of information, 4 samples of information are numbers.
5. Apply AND Criteria
The AND function is used to check if all criteria are met. =AND(logical1, [logical2…])
In general, AND refers to TRUE and FALSE based on the formula condition if one condition does not match your data then it will show false otherwise it’s true.
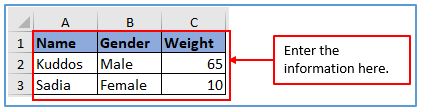
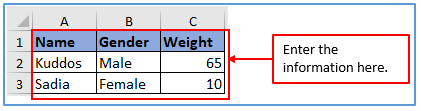
Step 1: Create a data table with the information as names, ages, and weights.
Used the pieces of information here.
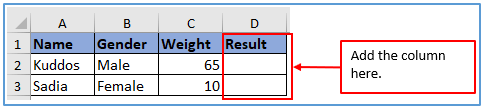
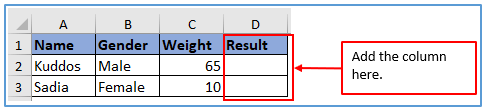
Step 2: Add the column from D1:D3 to get the AND value.
The column has been placed here.
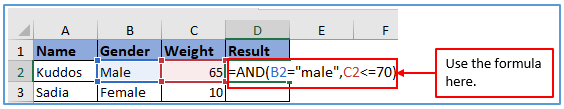
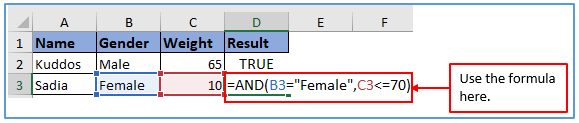
Step 3: Now, use the formula: =AND(B2=”male”,C2<=70)
Used the formula here.
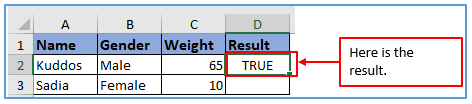
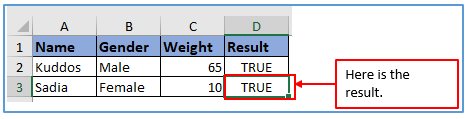
Step 4: Now, click on enter to get the value, and it’s true because it matches the criteria.
Here is the result below.
Step 5: You can use the same formula for column D3 then you will get the result.
For the column D3 the formula will be: =AND(B3=”Female”,C3<=70)
Step 6: Press Enter to get the result.
Here the formula met both conditions that’s why the result is true otherwise it’s false.
6. Apply OR Criteria
The OR function is used for checking if at least one criterion is met.
Step 1: Make a table with the information as names, their ages, and weights.
Written down the information here you can see below.
Step 2: Add the column from D1:D3 to get the OR value.
Added the column here.
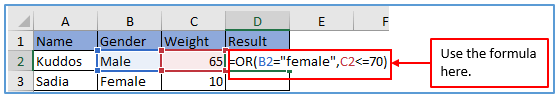
Step 3: Now, use the formula to get the OR value. Refer to B2 and equal with the female after that refer C2 which is less than 70.
The formula is: =OR(B3=”female”,C3<=70
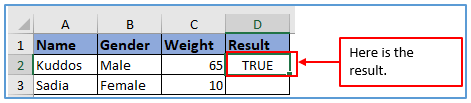
Step 4: After using the formula press enter. It matches one criterion that’s why the result is TRUE.
Here is the result below.
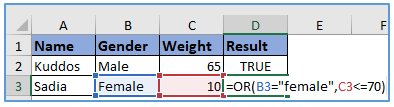
Step 5: Apply the same formula for column D3 then you will get the result.
For the column D3 the formula will be: =OR(B3=”female”,C3<=70
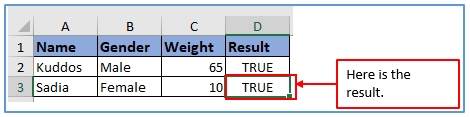
Step 6: Here the formula met the conditions for this the result is TRUE.
The result is outlined below.
7. Apply COUNTIF function
COUNTIF is a function that helps us count the number of cells within a specific range that meet certain criteria.
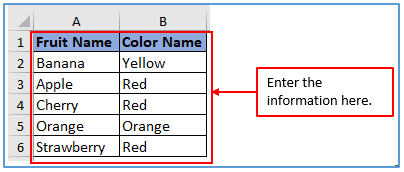
Step 1: You have to make a dataset. Here you can see an example with the fruit name and Fruit color. You need to find out how many same-color fruit cells are here in column B2:B6.
Placed the information here.
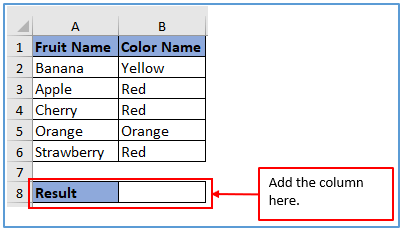
Step 2: Now you need to add the column in A8 and B8 and set the column name as result to find the COUNTIF value. Here,
Added a column A8 and B8 to get the value.
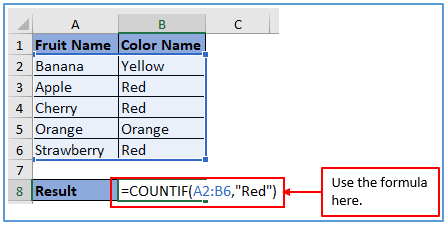
Step 3: Here you can refer to the COUNTIF formula where the range is A2:B5 after that select the criteria here is “Red”. The formula: =COUNTIF(A2:B6,”Red”)
Placed the formula here.
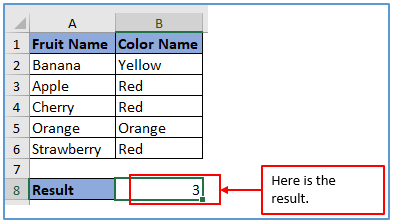
Step 4: Now, press enter to get the value.
Here the result is 3 because among the mentioned colors, 3 fruit’s colors are red.
Application of Count if method in Excel
- Attendance Tracking: Use the COUNTIF function to count the number of days employees were present, absent, or on leave by specifying different criteria for each category.
- Sales Threshold Analysis: Apply COUNTIF to count how many sales transactions exceed a certain value, helping to identify high-value sales and understand overall sales performance.
- Customer Segmentation: Utilize COUNTIF to segment customers based on purchase behavior, such as counting how many customers bought a particular product more than a certain number of times.
- Inventory Level Monitoring: Employ COUNTIF to monitor inventory levels, counting items that are below a minimum threshold to trigger restocking alerts.
- Performance Rating: Use COUNTIF to evaluate employee performance by counting the number of times specific performance criteria were met, such as achieving sales targets or customer service ratings.
- Email Campaign Analysis: Analyze the effectiveness of email campaigns by using COUNTIF to count how many responses or clicks were received that meet specific response criteria.
You may be interested:
