What-If Analysis in Excel is a powerful tool that enables users to explore different scenarios and understand potential outcomes. By changing input values, users can analyze how these changes affect the results, providing valuable insights for decision-making. This feature allows users to experiment with various parameters and instantly see the impact on formulas, charts, and other data. Whether it’s forecasting sales figures, evaluating financial models, or optimizing resource allocation, What-If Analysis in Excel empowers users to make informed decisions based on data-driven simulations. This functionality is particularly useful for financial planning, budgeting, and risk assessment, offering a dynamic approach to exploring potential outcomes and mitigating uncertainties. With its intuitive interface and flexible options, What-If Analysis in Excel is an indispensable tool for businesses and individuals seeking to understand the implications of different scenarios on their data.
This Content Covers:
- What is What-If Analysis in Excel?
- Different Options inside the What-If Analysis Tool.
- How to Create Different Scenarios using Scenario Manager?
- How to use the Goal Seek in Excel?
- How to Make a Data Table for What-If Analysis in Excel?
- Single-Input Data Table.
- Double Input Data Table
1. What is What-If Analysis in Excel?
The What-If Analysis is a feature in Microsoft Excel that allows you to explore different scenarios by changing specific variables or input values in a formula to see how it affects the outcome. It is useful when you want to analyze how changing certain variables will affect your results or when you want to make predictions based on different assumptions. This tool helps us create different models, scenarios, and data tables.
2. Different Options inside the What-If Analysis Tool.
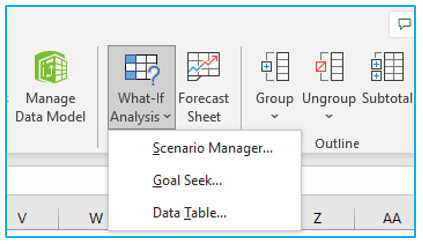
The what-if analysis tool has three parts,
- Scenario Manager.
- Goal Seek.
- Data Table.
3. How to Create Different Scenarios using Scenario Manager?
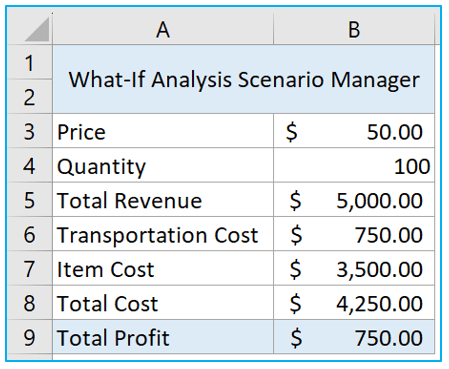
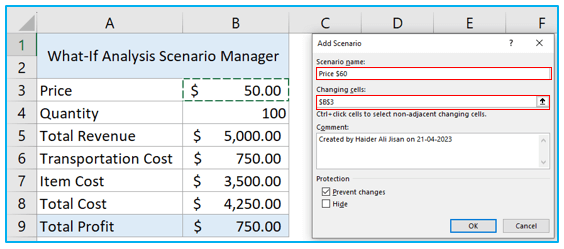
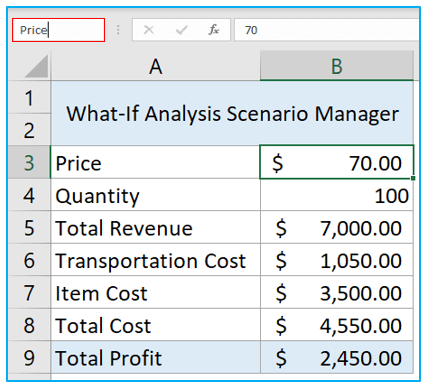
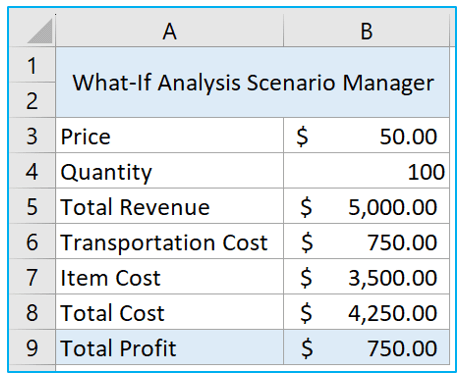
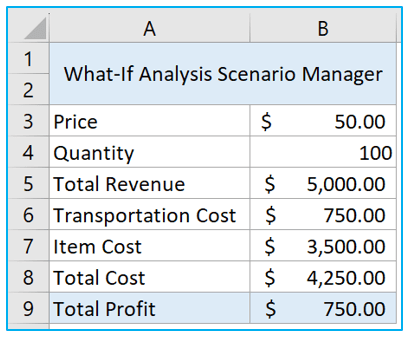
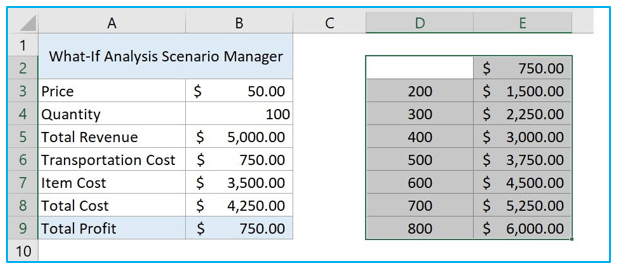
The scenario manager option in the what-if analysis is used to create different scenarios and find result for different values. Lets consider the data in the below picture, here the price for per unit of product is $50, the quantity is 100 so the total revenue= price*quantity= $5000. The transportation cost is 15% of the total revenue and item cost is $35 per unit, so the total cost= transportation cost+item cost= $4250. So, the total profit for this data-model that we will get is, total revenue-total cost= $750.
Now we will use the scenario manager to create different scenarios for different price of per unit to see how much the profit changes.
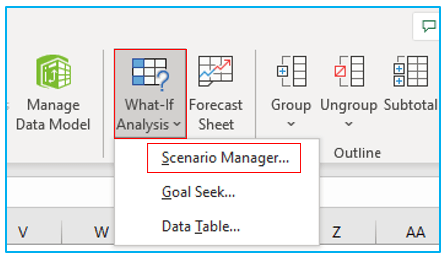
Step 1: Go to Data>>What-If Analysis>>Scenario Manager.
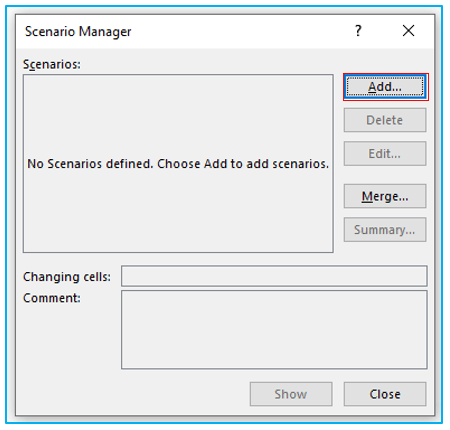
Step 2: Click on Add option to add a scenario.
Step 3: Type a relevant name inside Scenario Name. Insert the cell address of price value inside Changing Cells box. Press OK.
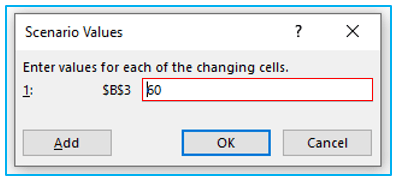
Step 4: Now insert new price that you want to create a scenario with inside this box and press OK or Add.
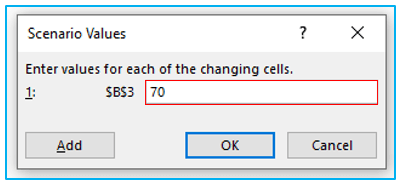
Step 5: Create few more scenarios with different prices by following the previous steps.
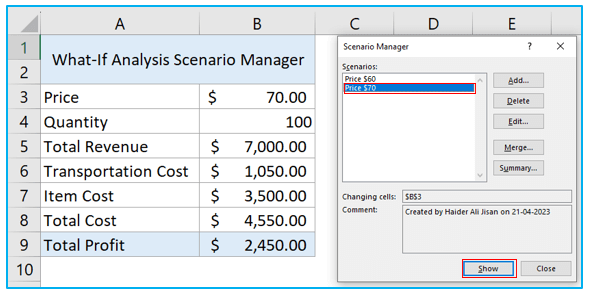
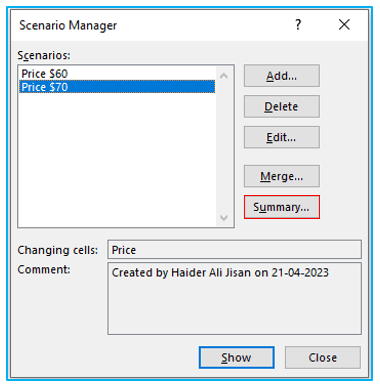
Step 6: When you have the scenarios created, they will look like this inside the Scenario Manager. Select a scenario and press the Show button to see the changes inside the table for that scenario price.
Step 7: Now close the Scenario Manager tab, select cell B3 which has the price amount then click on the address bar and name this cell “Price” and press Enter. Similarly rename the B9 cell to “Profit”.
Step 8: Now enter the initial price which was $50 inside B3 and open the Scenario manager from Data>>What-If Analysis>>Scenario Manager. Click on Summary button.
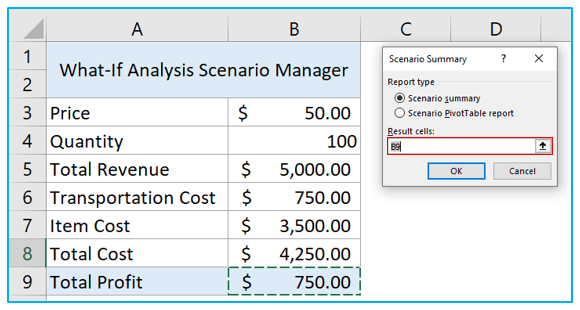
Step 9: Select Scenario Summary and insert the cell address of total profit value. Press OK.
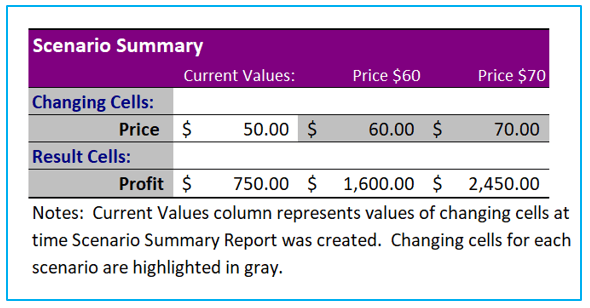
Step 10: A new worksheet will open with the Scenario Summary for this table and different price scenarios that you created.
4. How to use the Goal Seek in Excel?
Now we will show you how to use the Goal Seek option with the same dataset. The Goal Seek option is used to set a goal and see how much we have to change a particular category to reach that goal. Suppose our goal is to reach the profit amount of $1,50,000 and we want to know how many quantities need to be sold to reach this goal.
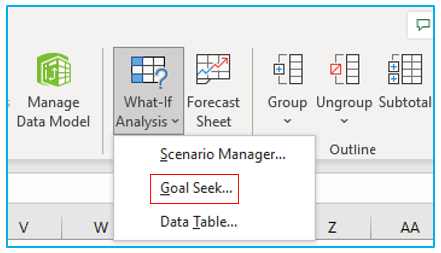
Step 1: Go to Data>>What-If Analysis>>Goal Seek.
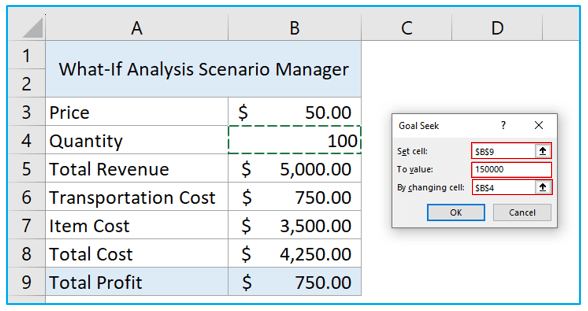
Step 2: The Goal Seek dialogue box will open, now you just need to insert the cell addresses and your goal value. Insert the Profit cell’s address inside Set cell box, enter the goal value inside To Value box and insert the cell address of quantity value inside By Changing cell box, as you want to know how many products need to be sold to reach the goal profit. Press OK.
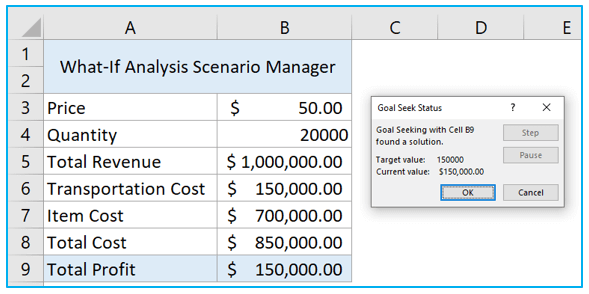
Step 3: The Goal Seek will do its calculation and return the result. So, to reach $1,50,000 profit, the quantity of products that need to be sold is 20000.
5. How to Make a Data Table for What-If Analysis in Excel?
Now we will learn how to use the third option of What-If Analysis which is Data Table. We will create a data table based on single and doubt data input.
5.1 Single-Input Data Tables
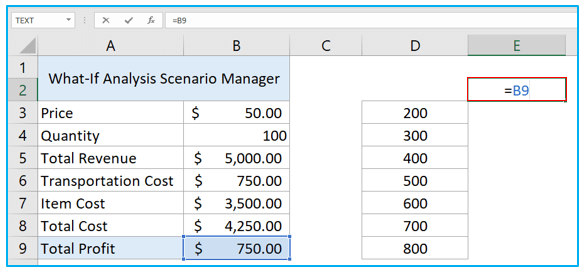
Suppose we have this data table, and we want to know how much profit we will get if the quantity is increased from 100 to 200, 300, 400, 500, 600, 700, 800. We can get these results by using the Scenario Manager and creating all of these quantity scenarios. But using the Data Table, we can get this data very quickly.
Step 1: First we have to create this quantity list in column D. Then select E2 and link this cell with B9 (Profit) and press Enter.
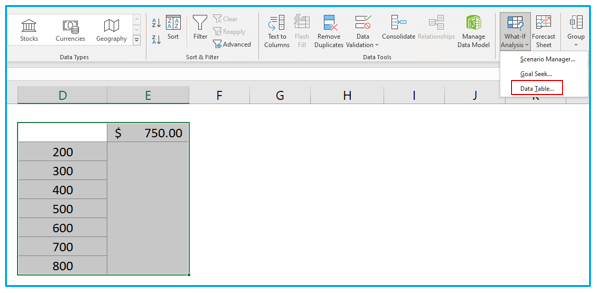
Step 2: Now select this range and go to Data>>What-If Analysis>>Data Table.
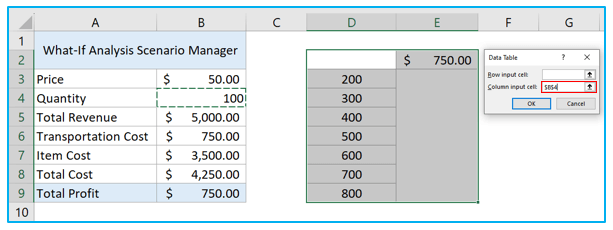
Step 3: There are two options inside the Data Table dialogue box, Row input cell and Column input cell. Because our input data in is column D so we will use the Column input cell box. Our input data is a list of quantity, so we will type the cell address of B4 which is the quantity value.
Step 4: After inserting the cell address and clicking OK, you will have this complete data table of total profit for these different quantity values. What this data table did was, it took the data of E2 that was linked to total profit so, it had the formula in it too. The data table calculated the other profits based on this data of E2 with the data of B4.
5.2 Double Input Data tables
The previous table was created based on a single data input. Now we will create a table of data based on double data inputs.
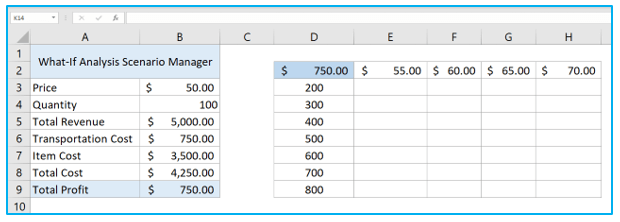
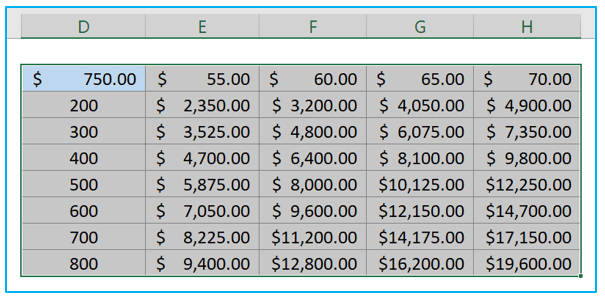
Step 1: Suppose here we want to know the total profit for these different quantities in column D and these different prices per unit in row 2. So, first we have to insert these quantities and prices and then link cell D2 with B9 like we did in the previous method.
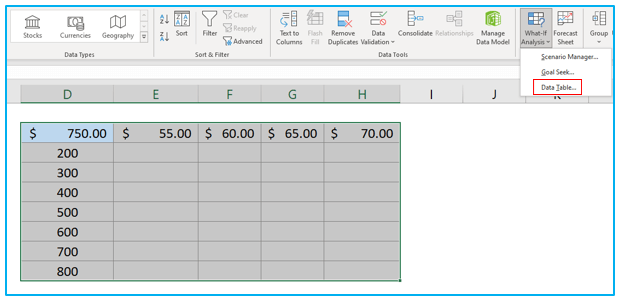
Step 2: Select the complete range and go to Data>>What-If Analysis>>Data Table.
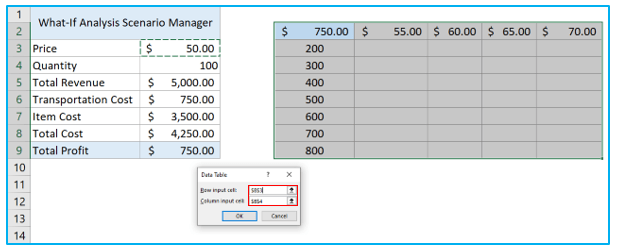
Step 3: Like the previous method we will select cell B4 inside Column input cell box as the quantities are in a column. And inside Row input cell box we will insert the cell location of the price (B3) as we also want to know the profit for different prices.
Step 4: When you press OK the What-If Analysis option will calculate the profits for these two conditions or inputs quantities and prices and return he result in a tabular form. From this table we can understand if the quantity is 200 and the price is $55 then the profit will be $2350. For 200 quantity and $65 price the profit is $4050 and so on.
Application of What-If Analysis in Excel
- Scenario Planning: Excel’s What-If Analysis feature allows users to create multiple scenarios based on different variables, such as sales projections, budget allocations, or investment returns. Users can then compare the outcomes of these scenarios to make informed decisions.
- Sensitivity Analysis: By changing one or more input variables, users can assess how sensitive their models are to these changes. This helps identify which factors have the most significant impact on the results, enabling users to focus on key drivers.
- Goal Seeking: What-If Analysis in Excel enables users to set a desired outcome and determine the input values required to achieve it. This feature is useful for determining sales targets, production quotas, or financial goals.
- Monte Carlo Simulation: Excel’s Data Tables feature allows users to perform Monte Carlo simulations, which involve running multiple iterations of a model with randomized input values. This helps assess the range of possible outcomes and the likelihood of achieving specific results.
- Break-Even Analysis: What-If Analysis in Excel can be used to perform break-even analysis, where users determine the level of sales, production, or other activities required to cover costs and achieve profitability.
- Risk Assessment: By exploring various scenarios and their potential outcomes, users can assess the risks associated with different decisions or events. This helps organizations plan for contingencies and mitigate potential threats to their operations.
For ready-to-use Dashboard Templates:
