Solver in Excel is a powerful tool that helps optimize complex problems by finding the best solution within specified constraints. It’s extensively used in various fields like finance, engineering, and operations research to maximize profits, minimize costs, or achieve other objectives. With Solver in Excel, users can set up mathematical models, define decision variables, and input constraints to find optimal solutions automatically. This tool enables users to perform sensitivity analysis, scenario analysis, and goal seeking to make informed decisions. By leveraging Solver in Excel, businesses can streamline processes, improve efficiency, and enhance decision-making capabilities. Whether it’s optimizing production schedules, resource allocation, or investment portfolios, Solver in Excel offers a versatile solution for solving a wide range of optimization problems effectively and efficiently.
This Tutorial Covers:
- What is Excel Solver
- How to add Solver to Excel
- Where is Solver in Excel
- How to use Solver in Excel
- Excel Solver examples
- Excel Solver example 1 (magic square)
- -Excel Solver example 2 (linear programming problem)
- How to save and import Excel Solver scenarios
- Saving the model
- Loading the saved model
- Excel Solver algorithms
1. What is Excel Solver?
Excel Solver is part of a unique group of commands known as What-if Analysis Tools. Its primary objective is to simulate and optimize different business and engineering models.
The tool is highly effective in solving linear programming problems, which are also known as linear optimization problems. Due to this feature, it is sometimes referred to as a linear programming solver. Besides, the Excel Solver is capable of dealing with smooth nonlinear and non-smooth problems as well. More information on the Excel Solver algorithms can be found for further clarity.
Although Solver may not provide solutions for every problem, it is an incredibly useful tool for all types of optimization problems that require making the best decision. For instance, Solver can assist in maximizing return on investment, determining the ideal budget for an advertising campaign, creating the optimal work schedule for employees, minimizing delivery costs, and more.
2. How to add Solver to Excel?
Beginning with Excel 2003, all versions of Microsoft Excel come with the Solver add-in, however, it is not turned on by default.
The procedures listed below should be taken in order to add Solver to Excel:
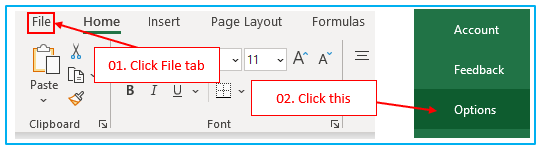
Step 1: Simply select File > Options in Excel 2010-Excel 365.
Select Excel Options from the Microsoft Office menu in Excel 2007.
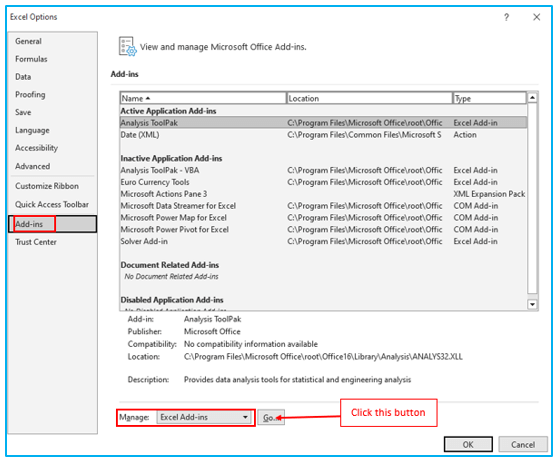
Step 2: Make sure “Excel Add-ins” is selected in the “Manage” box at the bottom of the window in the “Excel Options” dialog by clicking “Add-Ins” on the left sidebar and then clicking “Go”.
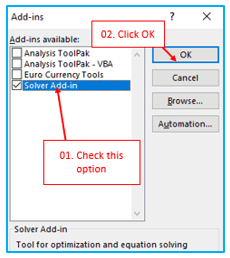
Step 3: Check the “Solver Add-in” box in the “Add-Ins” dialog box, then click OK.
On Excel 2003, select the Tools menu and then click Add-Ins to download Solver. Check the Solver Add-in box in the list of possible Add-Ins, then click OK.
Note: If Excel prompts you to install the Solver Add-in even though it isn’t already on your computer, select Yes to proceed.
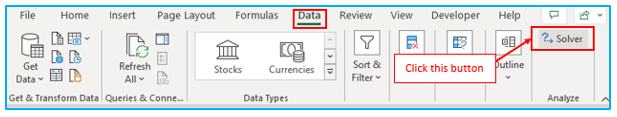
3. Where is Solver in Excel?
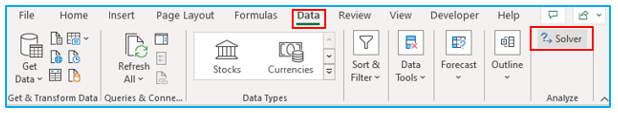
The Solver button can be found in the “Analysis” group on the “Data” tab in more recent versions of Excel.
The following command is added to the Tools menu once the Solver Add-in has been loaded into Excel 2003.
Open a new worksheet and let’s begin now that you know where to find Solver in Excel.
Note: This tutorial’s examples make use of Solver in Office 365. Although the Solver feature is essentially the same, if you are using a different version of Excel, the screenshots may not exactly match your version.
4. How to use Solver in Excel?
When you specify the dependent variables and the conditions/constraints, Solver provides you with the desired outcome.
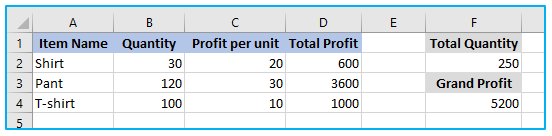
Let’s use the following data set as an illustration.
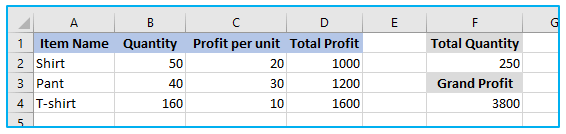
Quantity, Profit per unit, and Total Profit manufacturing statistics for 3 widgets are included in this example.
Objective: The main goal is to maximize profit.
If you are familiar with manufacturing, you are aware that the best results come from optimizing production. Even if you can theoretically produce an infinite number of the most profitable widgets, there are always many limitations that must be considered while trying to maximize output.
Constraints: Here are some constraints to consider as you work to maximize your business.
- At least 30 units of Shirt should be made.
- At least 20 units of Pant should be made.
- At least 100 Quantity of T-shirt should be made.
- A total of 250 items should be made.
This is a common factory optimization problem, and Excel’s Solver makes it simple to find the solution.
The steps to use solver in Excel are described below:
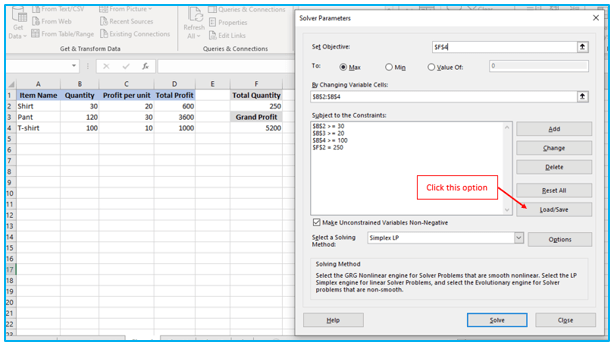
Step 1: Go to “Data” tab, then under “Analysis” section click the “Solver” button.
Step 2: Use the following in the Solver Parameter dialogue box:
Set Objective: $F$4 (this is the cell with the required value, which is overall profit in this case).
To: Max (because we want to make the most money possible).
By Changing Variable Cells: $B$2 through $B$4 are the variables we want to optimize; in this case, the quantity.
Select a Solving Method: Go with Simplex LP.
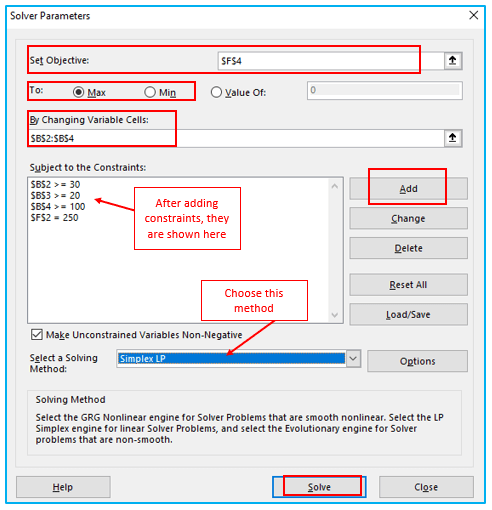
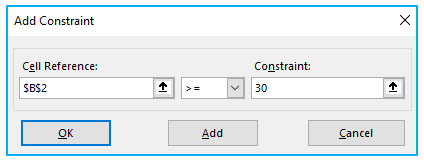
Subject to the Constraints: Here, the limitations must be specified. Click Add to add a constraint. Enter the Cell Reference, the condition, and the Constraint Value (as displayed below) in the Add Constraint dialogue box:
For each constraint, repeat these steps.
Step 3: Select Solve.
- If the solver discovers a solution, the Solver Result dialogue box will be displayed. You have the option of keeping the solver solution (which is displayed in your data set) or going back to the initial values.
- Additionally, you can save this as a scenario to be utilized in the Scenario Manager.
- Additionally, you have the option of producing the reports Answer, Sensitivity, and Limits. Simply select it and press OK. If you choose only one or two, then that many tabs are formed. This will create various tabs with details for Answer, Sensitivity, and Limits.
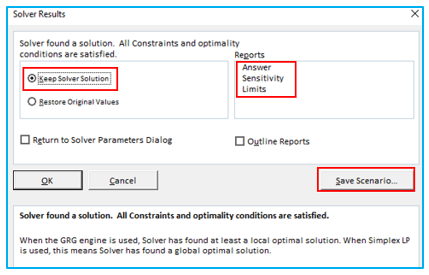
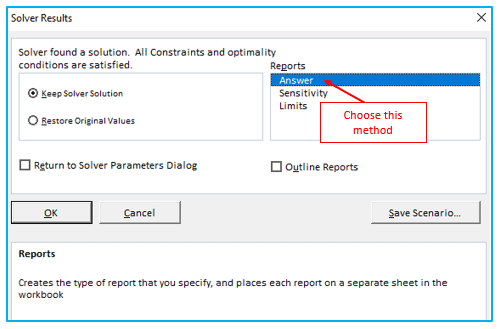
Step 4: To get the result, click on “Answer” under “Report” category. After that, click OK.
The result looks like below:
Now that you understand the fundamentals of using Solver in Excel, let’s take a closer look at a few additional instances that may aid in your comprehension.
5. Excel Solver examples:
Using Excel Solver add-in is demonstrated in two additional examples below. A well-known puzzle will be solved first, and then a real-world linear programming issue will be resolved.
-
Excel Solver example 1 (magic square):
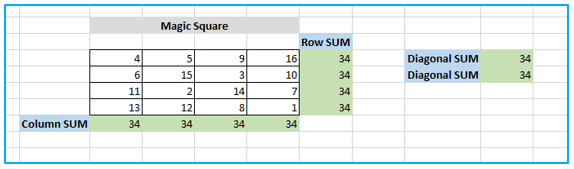
Everyone has probably encountered “magic square” puzzles, which require you to arrange a collection of numbers in a square in order for all of the rows, columns, and diagonals to add up to a specific value.
Do you, for example, have the answer to the 4×4 square with the digits 1 to 16 where each row, column, and diagonal adds up to 34?
To solve this puzzle via trial and error is probably not a great deal, but I think the Solver will do so more quickly. Our responsibility is to define the issue clearly.
Start by randomly entering the numbers from 1 to 16 in a table with 4 rows and 4 columns. Although the Excel Solver does not technically require those figures, they will aid in our understanding of the issue. The SUM formulas that add up each row, column, and two diagonals are what Excel Solver add-in actually needs:
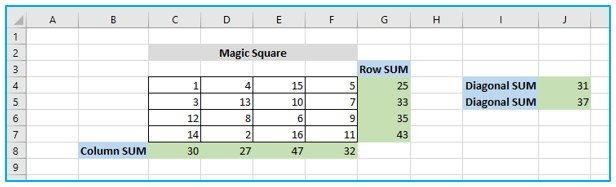
We figure out the totals of the rows, columns, and diagonals. Let’s enter a few arbitrary values to demonstrate this. Let’s pick numbers between 1 and 16.
Once all of the formulas are in place, launch Solver and configure the following settings:
Set Objective: Since there is no need to specify an objective in this instance, leave this field blank.
Variable Cells: Choose the range B2:D4 because we want to fill cells B2 to D4 with numbers
Constraints: The following prerequisites must be satisfied:
- $C$4:$F$7 = AllDifferent – Different values should be present in each of the variable cells.
- $C$4:$F$7 = integer – The variable cells must all contain integer values.
- $C$8:$F$8= 34 – Each column’s values added together should equal 34.
- $G$4:$G$7 = 34 – Each row’s values added together should equal 34.
- $J$4:$J$5 = 34 -34 should be the total of both diagonals.
Selecting a solving Method: GRG Nonlinear should be selected.
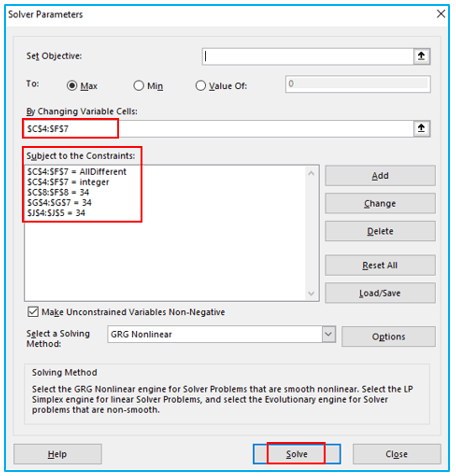
The answer can be found by clicking the “Solve” button at the end:
-
Excel Solver example 2 (linear programming problem):
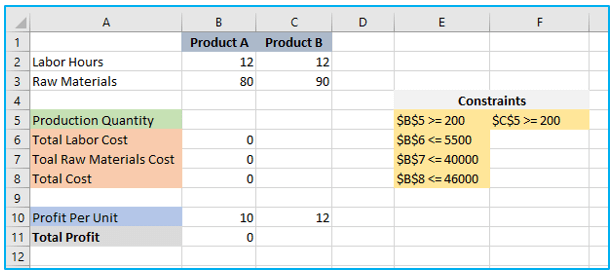
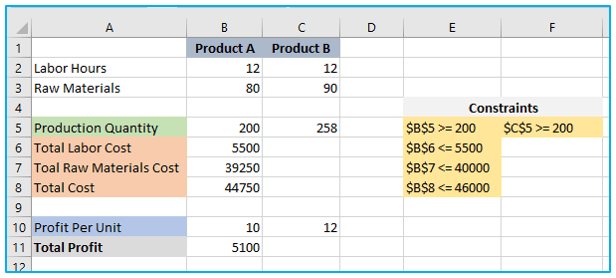
Let’s say you own a business that manufactures Products A and B. Each product requires resources, such as work hours and raw materials, to be produced. The amount of labor and raw materials needed to produce one unit of Product A is 12 hours, while the amount needed to produce one unit of Product B is 12 hours of labor and 90 pounds of raw materials. Profit from Product A is $10 per unit, while Profit from Product B is $12 per unit. The objective is to increase the business’s daily earnings.
As seen in the screenshot below, you may build up the following table to solve this linear programming issue using Excel’s Solver:
Set Objective: $B$11
Variable Cells: Choose the range $B$5:$C$5 because we want to fill cells B5 to C5 with numbers.
Constraints: The following prerequisites must be satisfied:
- $B$5 >= 200 – Values should be greater than or equal to 200.
- $C$5 >= 200 – Values should be greater than or equal to 200.
- $B$6 <= 5500- The variable should be less than or equal to 5500.
- $B$7 <= 40000 – The variable should be less than or equal to 40000.
- $B$8 <= 46000- The variable should be less than or equal to 46000.
Selecting a solving Method: Simplex LP should be selected.
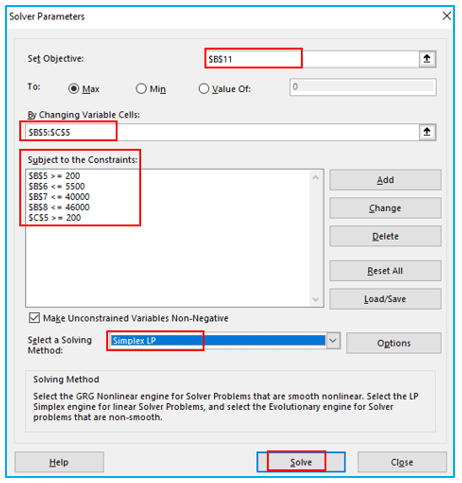
The answer can be found by clicking the “Solve” button at the end:
6. How to save and import Excel Solver scenarios?
When resolving a specific model, you might want to preserve the values in the Variable cell as a scenario that you can later see or use again.
For instance, you might wish to experiment with various expected customer counts each month when figuring out the minimal service cost in the very first example covered in this lesson to see how it impacts the service cost. The most likely scenario you’ve already estimated at that point might be something you wish to keep and restore at any time.
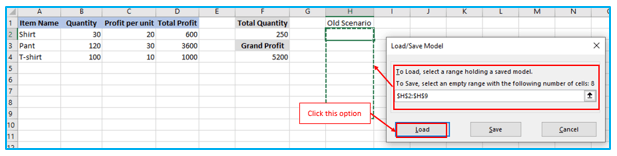
It all comes down to choosing a set of cells to save the data in when saving an Excel Solver scenario. The range of cells in which your model is saved must be provided to Excel in order to load a Solver model. The steps are listed in detail below.
-
Saving the model:
Follow these procedures to save the Excel Solver scenario:
Step 1: Run the Excel Solver by opening the spreadsheet containing the calculated model.
Hit the Load/Save button in the Solver Parameters window.
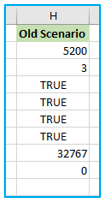
Step 2: How many cells are required to save your scenario will be specified by Excel Solver. Choose that many blank cells, then click “Save”:
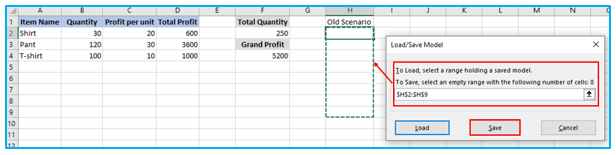
Your current model, which may resemble this, will be saved by Excel:
The Solver Parameters window will appear at the same time, allowing you to alter your constraints and explore other “what if” scenarios.
-
Loading the saved model:
Do the following when you want to restore a saved scenario:
Step 1: Simply select the Load/Save option in the Solver Parameters window.
Choose the range of cells on the worksheet that contain the saved model, then click “Load”:
Step 2: Click the” Replace” button in the “Load Model” dialog:
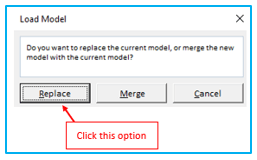
With the parameters of the previously saved model displayed, this will open the main Excel Solver window. To recalculate it, all you have to do is click the Solve button.
7. Excel Solver algorithms:
When defining a problem for Excel Solver, the user can select a solving method from the dropdown box. The following methods are available:
- GRG Nonlinear: This method uses the Generalized Reduced Gradient Nonlinear algorithm, which is suitable for problems that have smooth nonlinear constraints. At least one of the constraints should be a smooth nonlinear function of the decision variables.
- Simplex LP: This method is based on the Simplex algorithm, which was created by George Dantzig. It is used for solving Linear Programming problems that have linear relationships, consisting of a single objective represented by a linear equation that must be maximized or minimized.
- Evolutionary: This method is used for solving non-smooth problems which are the most challenging type of optimization problems to solve. Some of the functions are non-smooth or even discontinuous, making it difficult to determine the direction in which a function is increasing or decreasing.
In the Solver Parameters dialog box, select the Options button to customize any or all of the options on the GRG Nonlinear, All Methods, and Evolutionary tabs.
You can use Excel’s Solver to identify the ideal answers to your decision-making problems in the manner described above.
Application of Solver in Excel
- Optimization: Solver in Excel is commonly used for optimization tasks such as maximizing profits, minimizing costs, or optimizing resource allocation. It can find the best solution within defined constraints.
- Resource Allocation: Businesses utilize Solver to allocate resources efficiently, whether it’s assigning manpower, distribution routes, or production schedules, ensuring optimal utilization.
- Financial Modeling: Solver aids in financial modeling by optimizing investment portfolios, determining loan terms, or analyzing cash flow scenarios to maximize returns or minimize risks.
- Production Planning: Solver helps in production planning by optimizing production schedules, minimizing downtime, and ensuring that resources are utilized effectively to meet demand.
- Supply Chain Management: It assists in supply chain management by optimizing inventory levels, distribution routes, and logistics to minimize costs while ensuring timely deliveries.
- Project Management: Solver can be used in project management to optimize project schedules, allocate resources effectively, and minimize project completion time while meeting project constraints.
For ready-to-use Dashboard Templates:
