DVAR function in Excel is a critical tool for statisticians, analysts, and business professionals who need to assess the variance within their data sets. By applying this function, you can gain deeper insights into the variability of your data, enabling more informed decisions based on risk assessment and quality control. Mastering the DVAR function opens up a new dimension in your data analysis capabilities, allowing for a better understanding of the diversity and distribution of your data. Implement the DVAR function in your Excel analyses to enhance your strategic planning and data evaluation processes.
Here are some contents
- What is the DVAR function in Excel?
- How to use the DVAR function in Excel?
- Syntax of the DVAR function.
- What are named ranges?
- How to Use Named Ranges in Excel?
1. What is the DVAR function in Excel?
The DVAR function in Excel estimates the population variance based on a sample by using the numbers in a field (column) of records in a list or database that match the conditions that you specify.
- DVAR estimates population variance based on a sample, unlike VAR which calculates sample variance.
- Use DVAR when you want to analyze only certain records within your data based on specific criteria.
- The criteria argument allows for flexible filtering of the data before calculating the variance.
Here is the formula =DVAR (database, field, criteria)
2. How to use the DVAR function in Excel?
The variance of a population based on a sample of numbers in a column in a list or database, based on specified parameters, is returned by the Microsoft Excel DVAR function. It is a feature of a worksheet. One Excel built-in function that falls under the database function category is the DVAR function. In Excel, it can be utilized as a worksheet function (WS). The DVAR function can be used as a worksheet function and inserted into a formula in a worksheet cell.
There are some steps where you can use the DVAR function easily.
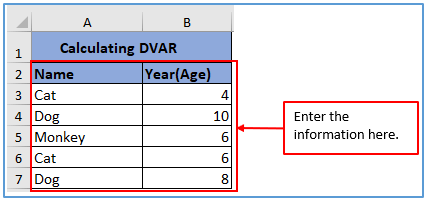
Steps 1: Create a data table with the information below.
Given the information here.
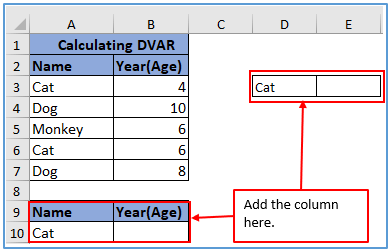
Step 2: Add the column in A10:A11 and B10:B11 give the column name and add the animal name as the cat, now you need to make another column in D3 and C3 to get the DVAR result there.
Added the column here.
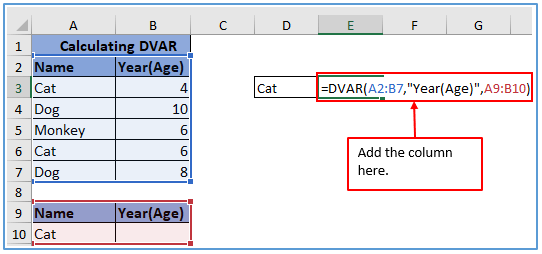
Step 3: Here you can refer to the DVAR function where A2:B7 (database table) and refer to your field like Year (Age) or you can single tap on B2 after that A10:B11 (criteria). You have to use the formula in E3 to get the DVAR result. The formula is: =DVAR(A2:B7,”Year(Age)”,A9:B10)
Here the formula applied as you can see below.
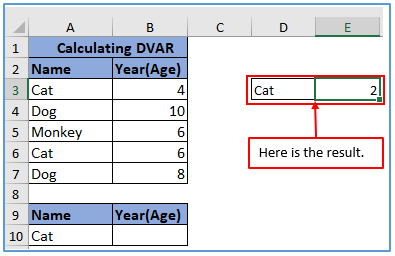
Step 4: In the end, hit enter to get the value.
Here is the result below.
3. Syntax of the DVAR function.
Here’s the syntax for the DVAR function in Excel: =DVAR(database, field, [criteria])
Arguments:
- Database (required): This is the range of cells that makes up the list or database you want to analyze. The first row should contain labels for each column.
- Field (required): This indicates the column used for calculating the variance. It can be:
- A text string enclosed in double quotes, like “Age” or “Sales” or using column number.
- A number representing the position of the column within the list, starting from 1 for the first column.
- A formula that returns the desired field value.
- Criteria (optional): This is a range of cells containing the conditions that define the subset of records to be considered for calculating the variance. Each condition is specified as a comparison (e.g., “>50”, “<100”) in a separate cell within the criteria range.
4. What is named ranges?
In Excel, named ranges are user-defined labels assigned to specific cell ranges or individual cells.
They offer several advantages over simply using cell references:
Benefits of using named ranges:
Replace cryptic cell references with meaningful names, making formulas and spreadsheets easier to understand and navigate. Using names minimizes the risk of typos or referencing the wrong cells compared to complex cell addresses. Easily apply formulas and operations to named ranges throughout your spreadsheet, improving efficiency and flexibility.
When you edit the content of a named range, any linked formulas or references automatically update, promoting data consistency.
5. How to Use Named Ranges in Excel?
Once you have defined a named range, you can simply use its name instead of the cell reference in formulas and other spreadsheet functions. For example, if you named a range “SalesAmount,” you can use “=SUM(SalesAmount)” instead of “=SUM(A2:A9)” to calculate the sum of that range.
Here is some step of named range in following below.
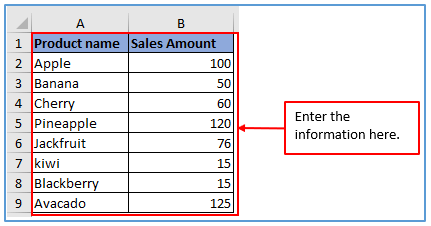
Steps 1: Create a data table with the information below.
Given the information here.
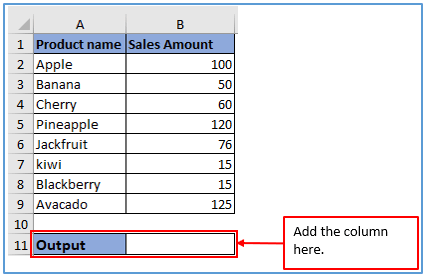
Step 2: Now, add another column in A11 and B11 to get the output there.
Added the column here.
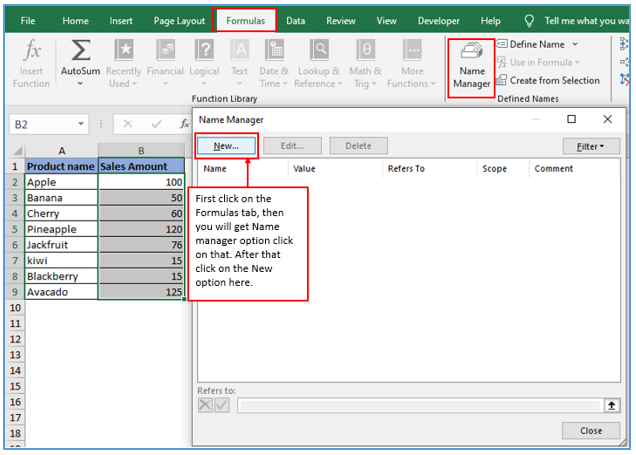
Step 3: Refer to the information then change the cells named. So first you select the cells B2:B9 go to the formula bar and click the Name Manager. After entering the name manager, you select new and write the cell name that you want.
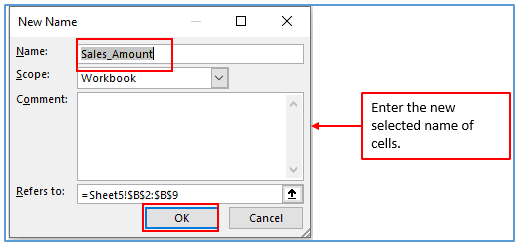
Step 4: After clicking on the new tab, you will get a new name box as shown below, and write down the new name as Sales_Amount as the new selected name of cells and click on OK as shown below.
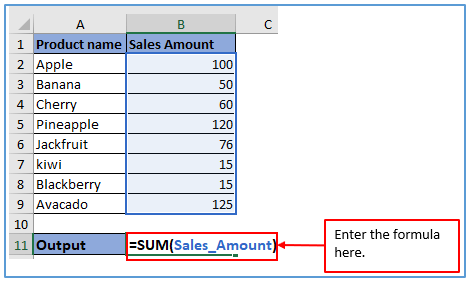
Step 5: Here you can use the formula with the help of Refers. The formula is: =SUM(Sales_Amount)
Used the formula here.
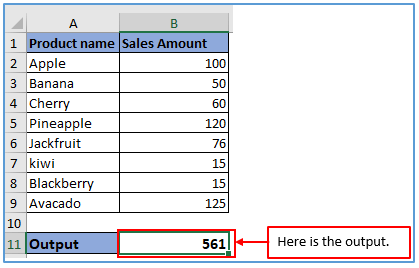
Step 6: Now, press enter to get the value.
Here is the result below.
Application of DVAR function in excel
- Sales Data Analysis: Use DVAR to estimate the variance in sales across different regions or product lines, helping to understand sales consistency and identify areas of improvement.
- Quality Control: Apply DVAR in manufacturing or production processes to calculate the variance in quality metrics, such as product dimensions or defect rates, aiding in quality assurance strategies.
- Investment Portfolio Analysis: Utilize DVAR to assess the variance in returns for different investment portfolios, helping investors understand the risk associated with each portfolio.
- Educational Performance Evaluation: Employ DVAR to analyze the variance in test scores or grades among students in different classes or schools, identifying disparities and areas for educational improvement.
- Human Resources Metrics: Use DVAR to evaluate the variance in employee performance metrics, such as sales per employee or customer satisfaction scores, aiding in workforce management and development.
- Healthcare Data Assessment: Apply DVAR to calculate the variance in patient recovery times, treatment outcomes, or other medical metrics, assisting in healthcare analysis and planning.
You may be interested:
