AVEDEV Function in Excel is a valuable statistical tool for analyzing data dispersion or variability within a dataset. By calculating the average of the absolute deviations from the mean, the AVEDEV function provides insights into how spread out the data points are from the average. This function is particularly useful in scenarios where understanding the variability of data is essential, such as financial analysis, quality control, or scientific research. Incorporating the AVEDEV Function in Excel into your data analysis workflows enables you to gain a deeper understanding of your dataset’s distribution and make informed decisions based on data variability. Whether you’re examining stock returns, measuring production consistency, or evaluating experimental results, leveraging the AVEDEV Function in Excel empowers you to conduct robust statistical analysis and extract meaningful insights from your data with confidence.
This Tutorial Covers:
- What is AVEDEV Function in Excel
- Syntax of AVEDEV Function
- Arguments and Purpose of AVEDEV Function
- How to use AVEDEV Function in Excel
- Examples of use AVEDEV Function in Excel
1.What is AVEDEV Function in Excel?
The AVEDEV function in Excel is a statistical function that calculates the average of the absolute deviations of a set of values from their mean. It measures the average amount of variation or dispersion in a data set. By using the AVEDEV function, you can determine how spread out the data points are from the average value. This function is particularly useful in analyzing data sets and understanding the level of variability present in the data.
-
Syntax of AVEDEV Function:
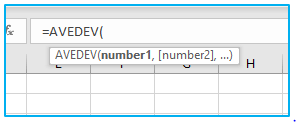
The syntax of the Excel AVEDEV function is as follows:
=AVEDEV(number1, [number2], …)
-
Arguments and Purpose of AVEDEV Function:
The AVEDEV function in Excel has the following arguments:
number1 (required): This is the first value or range of values for which you want to calculate the average absolute deviation. It can be a number, cell reference, range, or array.
[number2], … (optional): Additional values or ranges that you want to include in the calculation of the average absolute deviation. You can provide multiple arguments separated by commas.
2. How to use AVEDEV Function in Excel?
To demonstrate how to use the AVEDEV function in Excel, let’s consider the below dataset, where we have a dataset representing the weights (in kilograms) of a group of individuals.
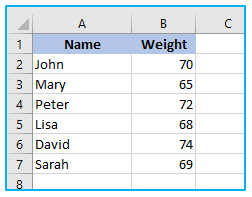
Now, let’s calculate the average absolute deviation of these weights using the AVEDEV function.
The steps to use AVEDEV function in Excel are described below:
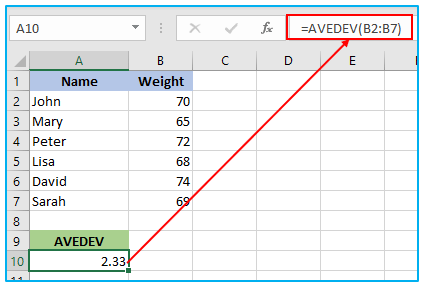
Step 1: Apply the below formula in cell A10.
=AVEDEV(B2:B7)
This formula instructs Excel to calculate the average absolute deviation for the range of weight values from cell B2 to B7.
By using the AVEDEV function in this example, you can determine the average amount of variation or dispersion in the weights of the individuals. This measure of variability can help you understand how spread out the weights are from the mean and provide insights into the distribution of the data.
The explanation that follows should help you better understand what is happening, though.
Step 1: Take the average of the values in the range. Excel’s AVERAGE function can be used to do this.
Apply the below formula in cell A13.
=AVERAGE(B2:B7)
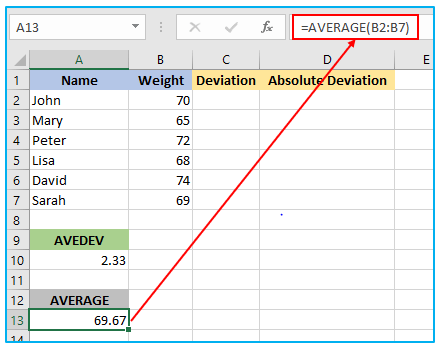
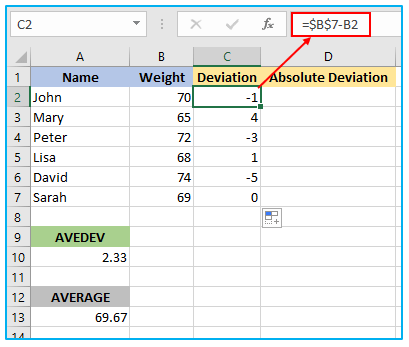
Step 2: Calculate the deviation of each number from the average value. To do this, subtract the average value from each number in the range.
Apply the below formula in cell C2 and you can either copy and paste the formula or drag the formula’s fill handle to the remaining cells.
=$B$7-B2
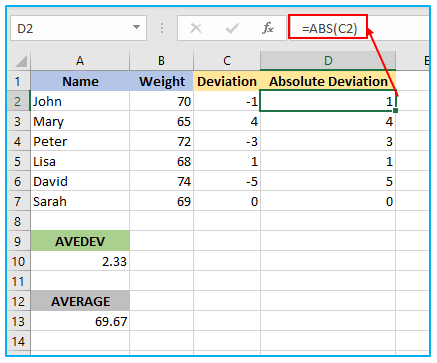
Step 3: Take the absolute value of each deviation value. You can use the ABS function in Excel to do this.
Apply the below formula in cell D2 and you can either copy and paste the formula or drag the formula’s fill handle to the remaining cells.
=ABS(C2)
Step 4: Take the average of the absolute deviation values. Excel’s AVERAGE function can be used to do this.
Apply the below formula in cell C10 and you can either copy and paste the formula or drag the formula’s fill handle to the remaining cells.
=AVERAGE(D2:D7)
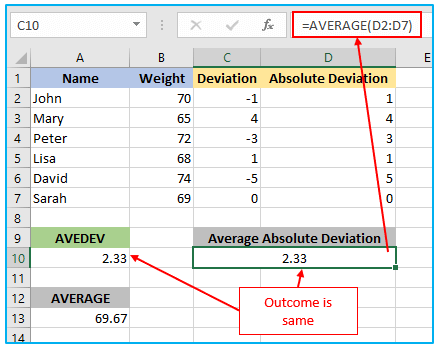
The AVEDEV function in Excel simplifies this process by combining steps 2, 3, and 4 into a single formula. You can use the AVEDEV function to calculate the average absolute deviation of a range of numbers by entering the range of values as the argument of the AVEDEV function.
3. Examples of use AVEDEV Function in Excel:
The AVEDEV function in Excel is a useful tool for calculating the average deviation of a dataset from its mean. By utilizing the AVEDEV function, you can easily determine the average amount by which each value in the dataset differs from the mean value. This function is particularly handy when analyzing data sets that exhibit variability or dispersion.
Here are a few examples of how you can leverage the AVEDEV function to gain valuable insights from your data:
Financial Analysis: Suppose you have a series of monthly returns for an investment portfolio. You can use the AVEDEV function to calculate the average deviation of the returns from the mean return. This metric can provide an indication of the volatility or risk associated with the investment.
Quality Control: Let’s say you have recorded a series of measurements for a manufacturing process. By applying the AVEDEV function to these measurements, you can determine the average deviation from the mean, which gives you an idea of the consistency and precision of the process.
Sports Performance: If you have a dataset containing the scores of a sports team across different games, you can employ the AVEDEV function to find the average deviation of the scores from the mean. This can help assess the team’s consistency or identify outliers in their performance.
Market Research: When analyzing survey responses on a rating scale, the AVEDEV function can assist in calculating the average deviation of the ratings from the mean. This can give you an understanding of the level of agreement or disagreement among respondents.
In summary, the AVEDEV function utilization in Excel provides a straightforward way to quantify the average deviation of data points from their mean value. This information can be valuable in various fields, including finance, quality control, sports analysis, and market research.
Application of AVEDEV Function in Excel
- Data Variability Analysis: AVEDEV function calculates the average of absolute deviations from the mean, providing insights into data dispersion or variability.
- Quality Control: Use AVEDEV to assess consistency in manufacturing processes by analyzing the variability of production outputs.
- Financial Analysis: Analyze the volatility of investment returns or asset prices by calculating the average deviation from the mean.
- Scientific Research: Assess the consistency of experimental results or data sets by measuring the average deviation from the mean.
- Risk Assessment: Utilize AVEDEV to evaluate the variability of risk factors in financial or operational scenarios.
- Trend Analysis: Understand the consistency or variability of trends over time by applying the AVEDEV function to historical data sets.
You may be interested:
