Outline Data in Excel is a powerful feature that allows you to organize and structure your data for better analysis and presentation. By using outlining tools, you can group related rows or columns, collapse and expand sections, and easily navigate through large datasets. Whether you’re working with financial reports, sales data, or project plans, outlining data in Excel helps you focus on the most relevant information and quickly identify trends and patterns. Embrace this feature to streamline your workflow, improve data organization, and enhance the clarity and effectiveness of your spreadsheets. With outlining data in Excel, you can efficiently manage complex datasets and make informed decisions with confidence.
This Tutorial Covers:
- What is outlining data in excel
- Why is it helpful to outline data in Excel
- How to do outline data in Excel
- How to collapse a group of cells
- How to collapse a group of columns
- How to remove the outline
1. What is outlining (group) data in excel?
Outlining data in Excel is a way to organize data by creating a hierarchical structure of groups and subgroups. This is achieved by grouping rows or columns of data together, and then using Excel’s outlining feature to expand or collapse the groups as needed. The outlining feature automatically creates summary rows or columns for each group to show totals or other aggregate data. Outlining data is useful when working with large datasets as it allows for easier analysis and presentation of the data.
2. Why is it helpful to outline data in Excel?
Data outlining in Excel is beneficial since it improves the efficiency of your work and the organization of your documents. In order to analyze data groupings without having to read through every cell, you can also build summaries.
The group function can also be used for the following things:
- Instead of hiding cells, come up with another strategy.
- Instead, than using numerous tabs, keep all your data in one document.
- Clear the screen of extraneous information, such as schedules and calculations.
- The spreadsheet can be expanded and contracted in different places.
3. How to do outline data in Excel?
Your data will be easier to read if you outline it using Excel outline feature.
The steps to outline data in Excel are described below:
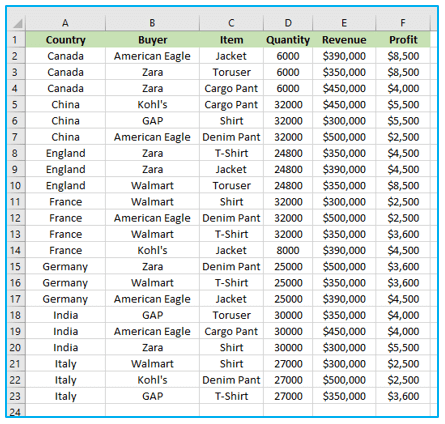
Step 1: Sort the information first by the Country column.
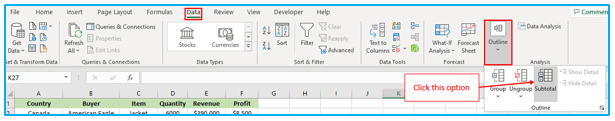
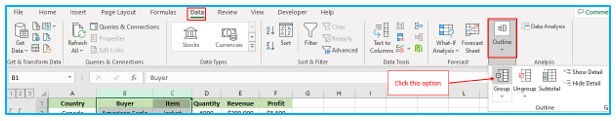
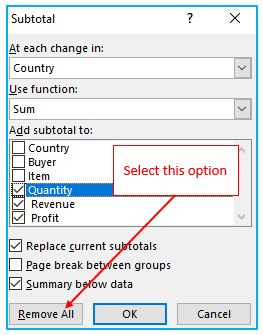
Step 2: On the “Data” tab, under the “Outline” section, click “Subtotal”. By doing so, the “Subtotal” window will open.
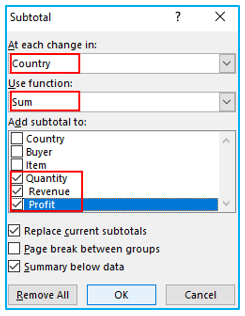
Step 3: Select the Country column, which serves as the outline for our worksheet, in the “Subtotal” pane.
Implement the Count function. Select the boxes next to Quantity, Revenue, and Profit. Select OK.
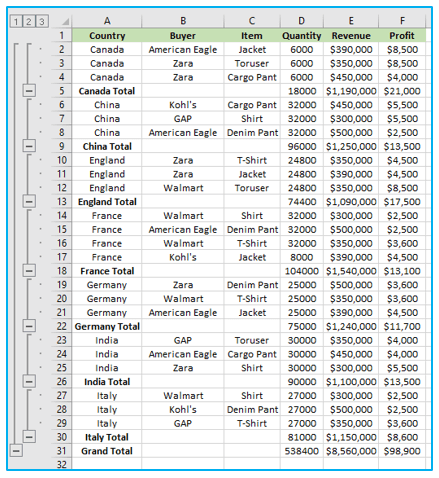
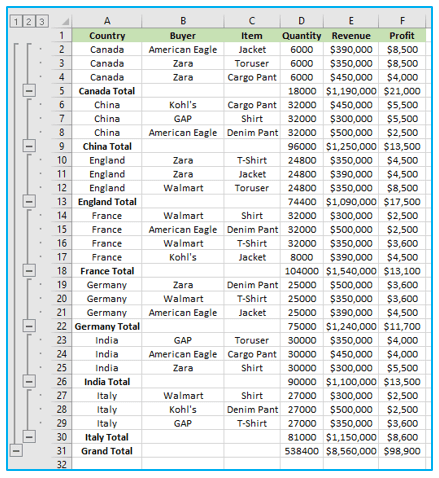
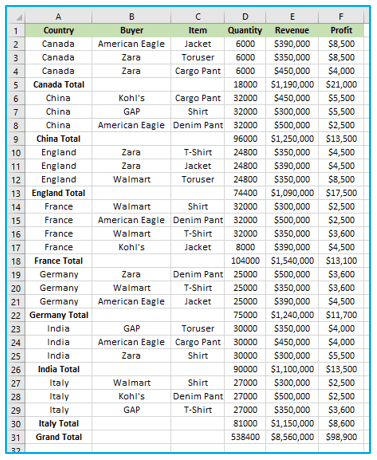
The outcome is shown below.
4. How to collapse a group of cells?
To collapse a group of cells, you can simply click the minus sign next to the group header. When you collapse a group, Excel hides the rows or columns in that group, which allows you to focus on other parts of the data. You can also use the numbers next to the plus and minus signs to collapse or expand groups by level.
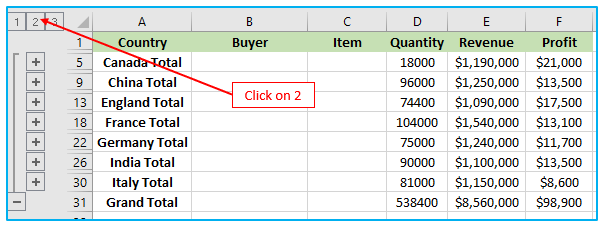
For example, clicking the number 2 will collapse the group to show only the subtotals.
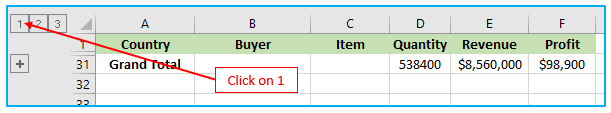
Clicking the number 1 will display only the Grand Count
Clicking the number 3 will show everything in the group.
5. How to collapse a group of columns?
Follow these instructions to collapse a set of columns:
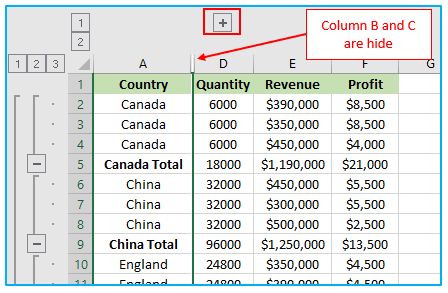
Step 1: For example, select column A and B.
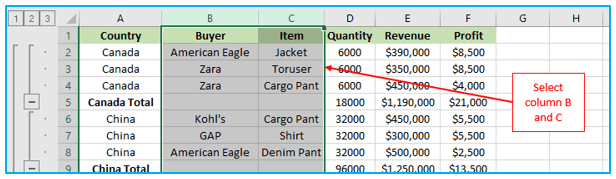
Step 2: Click “Group” in the “Outline” section of the “Data” tab.
A plus sign will appear if you click the minus sign above column B and C. The outcome is shown below.
6. How to remove the outline?
Follow these instructions to remove the outline:
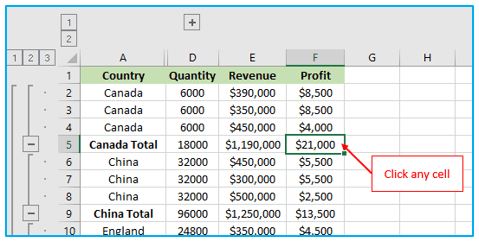
Step 1: Click any cell within the data set.
Step 2: Click on the “Data” tab, under the “Outline” section, click “Ungroup”, then select “Clear Outline”.
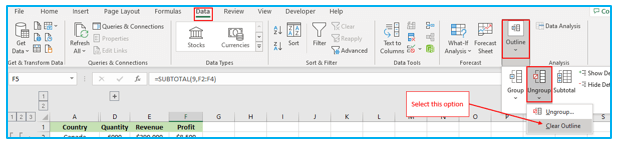
Alternatively, on the “Data” tab, under the “Outline” section, click “Subtotal”, “Remove all” or you can uncheck which you don’t want to outline.
The result looks like this:
Application of Outline Data in excel
- Data Organization: Outline Data in Excel to group related rows or columns, organizing your data for easier navigation and analysis.
- Summarization: Use outlining to collapse detailed data into summary levels, providing an overview of large datasets without losing granularity.
- Hierarchical Structure: Create hierarchical structures by outlining data into multiple levels, facilitating the representation of complex relationships.
- Presentation: Utilize outlined data for presentations, allowing you to focus on key points and reveal detailed information as needed.
- Data Analysis: Apply outlining to focus on specific subsets of data, enabling more targeted analysis and identification of trends or outliers.
- Collaboration: Collaborate with others by outlining data to highlight specific sections or areas of interest, enhancing communication and understanding.
For ready-to-use Dashboard Templates:
