Hide, Change, and Print Gridlines in Excel to tailor your spreadsheets to your specific needs, whether for clarity, presentation, or professionalism. This customization enhances the readability and visual appeal of your documents, ensuring that your data communicates effectively. By mastering these features, you can produce cleaner, more focused, and visually appealing reports that stand out to colleagues, clients, and management. Embrace the full control over your worksheet’s appearance to make your data not just seen, but understood.
In Excel, the boundaries of the cells in a spreadsheet are represented by gridlines or grid bars. So, this is a very useful feature that Microsoft Excel gives us in the application. But in case we don’t want the gridlines in our worksheet or in a particular area of a worksheet, there are some easy ways we can remove them, and also, we will see how we can print the gridlines too while printing an Excel sheet.
This Content Covers:
- What are Gridlines?
- What are the Uses of Gridlines?
- How to Remove/Hide Gridlines in Excel Worksheets?
- From the View Tab
- By Using Excel Shortcut
- By Changing Background Color
- By Changing the Gridline Color
- By Using a VBA Script
- How to Hide Gridlines for a Specific Area in the Worksheet?
- How to Print the Gridlines in Excel?
1. What are Gridlines in Excel?
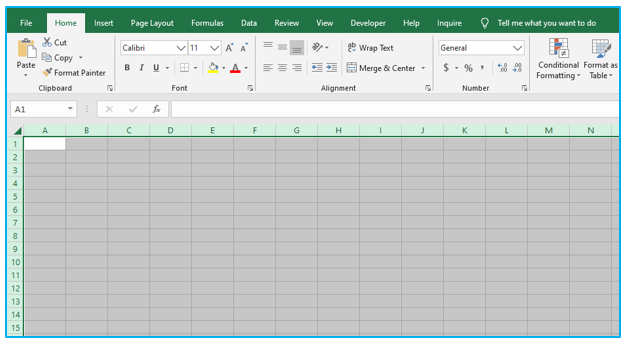
Excel’s gridlines are the thin gray lines that surround the worksheet’s cells. The gridlines make it easier to interpret the data and distinguish between the cells. In other words, the thin lines that help you identify the borders of the cells in your spreadsheet are called gridlines. The boundaries of the cells in a spreadsheet are represented by gridlines or grid bars.
2. What are the Uses of Gridlines in Excel?
- They assist in the differentiation of cell borders.
- By providing a visual reference, they simplify the process of you positioning texts or objects.
- Your data tables become easier to view when they have no border, in particular.
3. How to Remove/Hide Gridlines in Excel Worksheets?
3.1 From the View Tab
Step 1: Open a worksheet and go to the View tab. From there uncheck the Gridlines box to remove the gridlines from your Excel sheet.

3.2 By Using Excel Shortcut
The keyboard shortcut for hiding or removing gridlines from a worksheet is ALT+W+V+G. Simply press the ALT key and the W, V, G keys one after another to remove the Excel gridlines.
3.3 By Changing Background Color
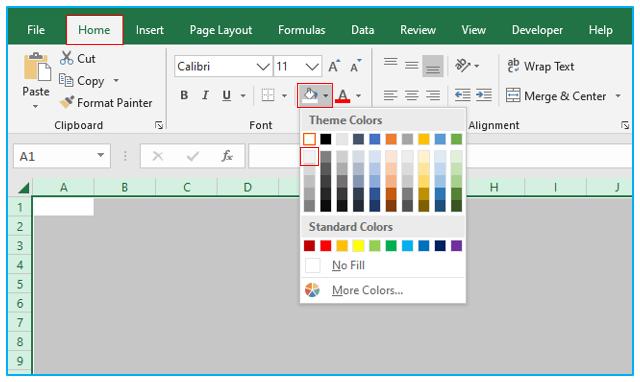
Step 1: Select the whole range of the worksheet by using the CTRL+A command.
Step 2: Click on the Fill Color option from Home Tab and select the White Color. This will hide the gridlines or grid bars from your worksheet.
3.4 By Changing the Gridline Color
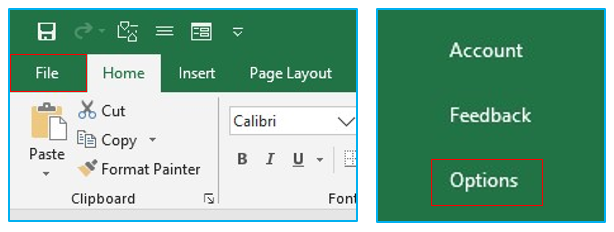
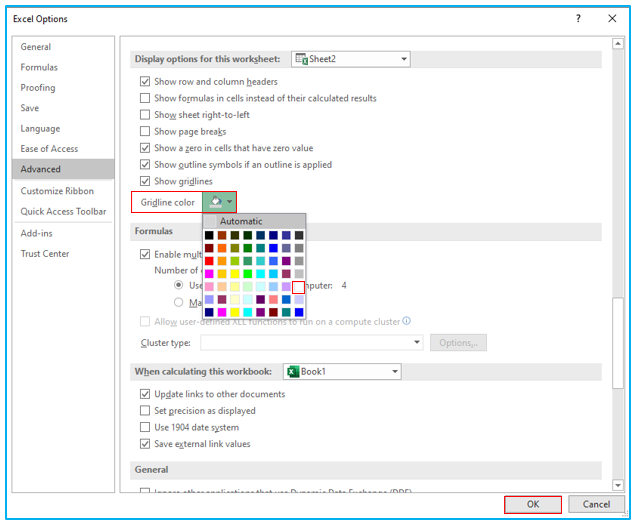
Step 1: Open a worksheet and go to File>>Options.
Step 2: From the Excel Options dialogue box go to Advanced and scroll down to Display options for this worksheet. Choose the sheet you want to hide the gridlines from the drop-down list.
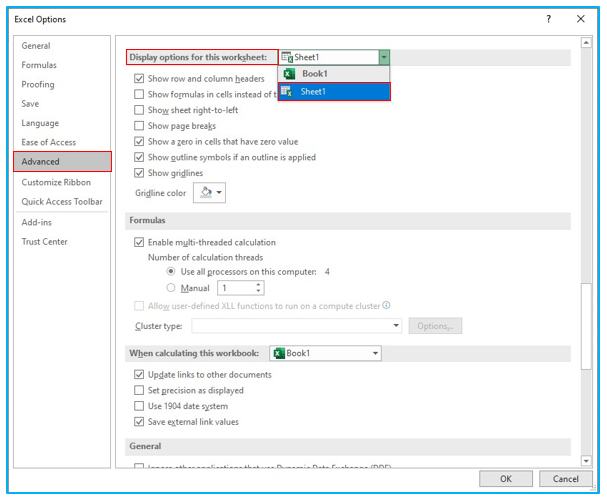
Step 3: Choose White Color from Gridline Color option and click OK and all the gridlines form that worksheet will be now hidden or invisible. If you just want to change the gridline color to something else instead of hiding them, you can choose any other color from this color palate and click Ok to change color of your gridlines.
3.5 By Using a VBA Script
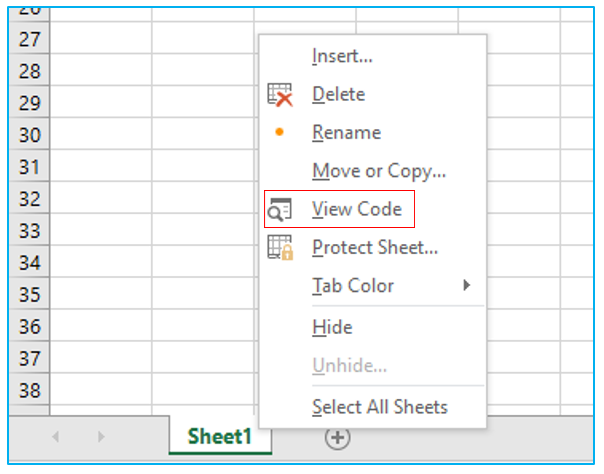
Step 1: Right-click on your worksheet and select View Code.
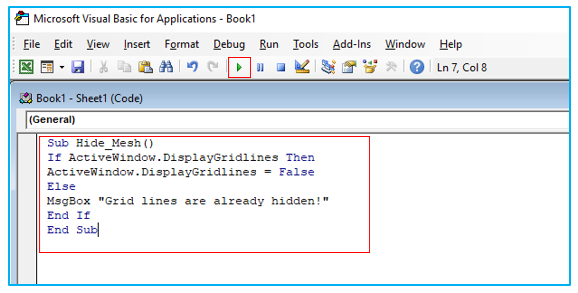
Step 2: Insert the following script inside the VBA Script Box and click on the RUN button. This will hide the gridlines from that worksheet.
Sub Hide_Mesh()
If ActiveWindow.DisplayGridlines Then
ActiveWindow.DisplayGridlines = False
Else
MsgBox “Grid lines are already hidden!”
End If
End Sub
4. How to Hide Gridlines for a Specific Area in the Worksheet?
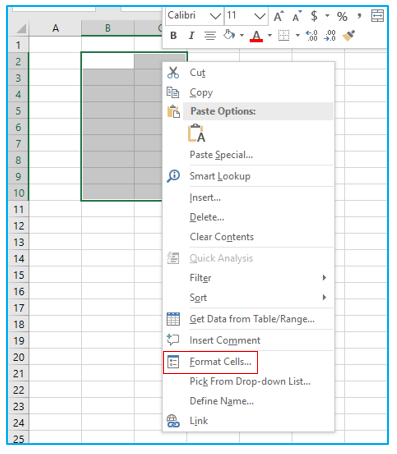
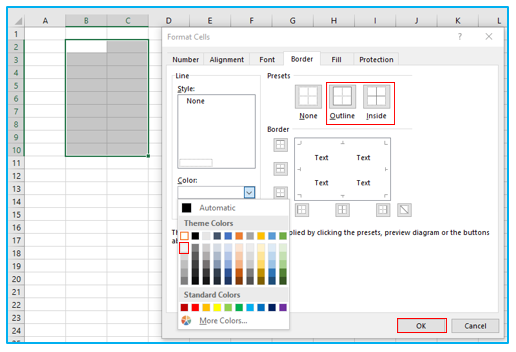
Step 1: Select the cell or range of cells from which you want to remove or hide gridlines and right-click on the selection. Choose the Format Cells option.
Step 2: Inside the Format Cells dialogue box, go to Border tab. Now choose White Color from the Color box and then click on Outline and Inside. Then click OK.
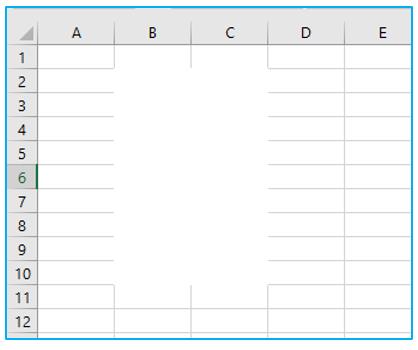
Step 3: When you click OK the gridlines for the selected range or cells will be removed.
5. How to Print Gridlines in Excel
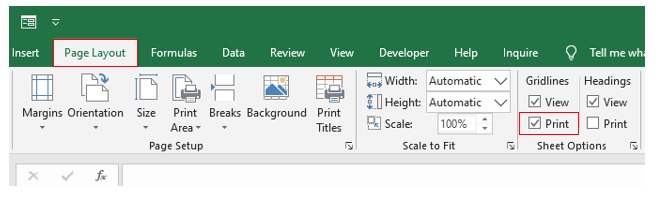
Gridlines in Excel are not printed by default. Make the following adjustment if you also want the gridlines printed.
Step 1: Go to Page Layout and check the box named Print under the Gridlines option. Now whenever you print this worksheet, the gridlines also will be printed with the data in it.
Application of Hide , Change, and Print Gridlines
Here are some uses of gridlines in Excel:
- Data Organization and Structure:
- Provide a visual structure to the spreadsheet, making it easier to align and locate data within the cells, enhancing the user’s ability to input and navigate through information.
- Enhancing Readability and Precision:
- Improve the readability of detailed data sets by delineating individual cells clearly, helping to reduce errors in data entry and analysis by providing clear demarcation between data points.
- Guiding Chart and Table Creation:
- Serve as guides when creating tables or charts, ensuring that data is aligned correctly and that elements are evenly spaced, contributing to the accuracy and aesthetic appeal of graphical representations.
- Facilitating Data Comparison:
- Make the comparison of data across rows and columns easier by providing a consistent reference point, aiding in quick visual analysis and decision-making.
- Improving Printing Clarity:
- When printed, gridlines can help in distinguishing and separating data, ensuring that the printed material is as clear and comprehensible as the digital version.
- Assisting in Data Visualization Customization:
- Offer a customizable background for data presentation, as users can adjust gridline color and style to match the theme or specific requirements of their reports or presentations.
Gridlines in Excel are an essential feature for maintaining data integrity, enhancing visualization, and ensuring the accuracy of data representation and analysis.
You may be interested:
