Slope in Excel transcends numerical calculations; it empowers data enthusiasts, analysts, and researchers to uncover hidden patterns and relationships within their datasets. This indispensable feature serves as a compass, guiding you through the intricate landscape of your data and illuminating the direction of trends and correlations. With ‘Slope in Excel,’ your analytical toolkit gains precision and depth, allowing you to navigate the complexities of data with confidence. Embrace the power of the slope to transform your numerical insights into actionable intelligence, steering your data-driven decisions towards clarity and informed strategies. In the realm of data analysis, ‘Slope in Excel’ emerges as a beacon, illuminating the path to meaningful discoveries and confident decision-making
For a given collection of variables, there are two approaches to get the slope of the linear regression in Excel:
- Using the SLOPE Function
- Using an Excel Scatter chart
I demonstrate how to compute slope using each of the two techniques above in this tutorial.
This Tutorial Covers:
- What is Slope
- SLOPE Function Syntax in Excel
- Arguments of SLOPE Function Syntax in Excel
- Using the Excel SLOPE Function to get slope value
- Things to Keep in Mind When Using the Excel SLOPE Function
- Using a Scatter Chart or Graph to get the slope value
1. What is a Slope?
A slope value describes the relationship between two values, typically referred to as the x and y values.
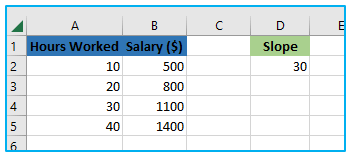
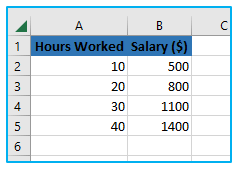
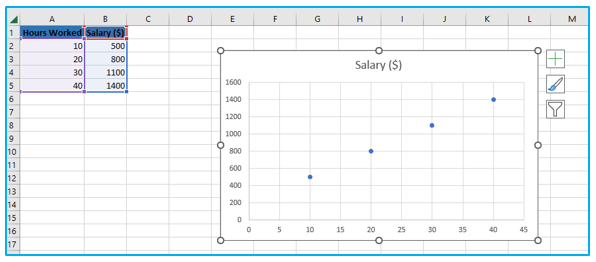
Assume you have the dataset below, where worked hours are represented by the X values and the salary ($) is represented by the Y values and you want to determine the link between these two variables. This is a real-world scenario. If there is a positive or negative correlation between these data points, it will let you know.
Both positive and negative slope values are possible.
In our case, a slope value of 30 indicates a positive link between working hours and salary. Therefore, the salaries are expected to increase by 30$ if the hours worked goes up by 1.
You also need to be aware of the Intercept in addition to the slope.
Let me explain using the following equation:
Y = Slope*X + Intercept
We have already determined the slope in this equation, but you also need to know the intercept in order to accurately predict what the Y value would be for a given X value.
Fortunately, there is a formula in Excel for it as well, and I will explain how to calculate intercept for each technique.
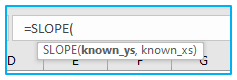
- SLOPE Function Syntax in Excel:
The slope function’s syntax is as follows:
=SLOPE(y_vals, x_vals)
- Arguments of SLOPE Function Syntax in Excel:
Following are the arguments for the SLOPE function:
known_ys – A collection or array of numerical data points (dependent values).
known_xs – A collection or array of numerical data points (independent values).
Keep in mind that the Y values must be the first parameter and the X values the second. The outcome would still be obtained if you did it the other way around, but it would be inaccurate.
2. Using the Excel SLOPE Function to get slope value:
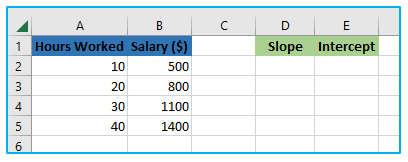
Assume you have the dataset below, where the working hours are represented by the X values and the salary ($) is represented by the Y values.
How to find the slope using SLOPE Function in EXCEL?
Step 1: In cell D2 of this dataset, compute the slope using the formula below:
=SLOPE(B2:B5,A2:A5)
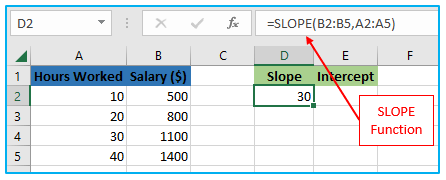
According to the aforementioned finding, I can infer from this dataset that, should the number of working hours increase by 1, the salary will rise by USD 30.
When working with slope, individuals frequently calculate the Intercept value, which is another typical statistical measure.
Just to refresh your memory, the slope equation looks like this:
Y = Slope*X + Intercept
To ensure that we can calculate Y values for any X value, in addition to knowing the slope, we would also need to know the value of the intercept.
Using the formula below, this is simple to accomplish:
=INTERCEPT(B2:B5,A2:A5)
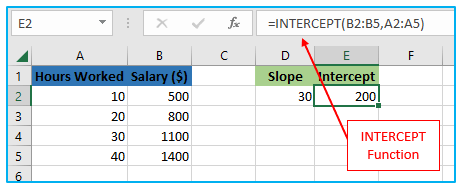
As a result, our equation for this dataset is as follows:
Y = 30*X + 200
Therefore, you can now compute the figure easily if I ask you what the salary would be for someone whose worked hour is 15.
Y = 30*15+ 200
There are positive and negative values for both the slope and intercept.
Things to Keep in Mind When Using the Excel SLOPE Function:
When using the SLOPE Excel function to get the slope of a regression line, keep the following in mind:
- The SLOPE function’s arguments must be numerical (DATE values are also accepted). These cells would be disregarded if any of them were empty or contained text strings.
- If any cell or cells include ‘0,’ the calculation will utilize those values instead.
- When it is used input for the SLOPE function, there needs to be an equal number of x and y values. A #N/A error will appear if you provide it with ranges of different sizes.
- The SLOPE function should return more than one set of points; otherwise, it will return a #DIV! error
4. Using a Scatter Chart or Graph to get the slope value:
You can plot the data in a scatter chart and use it to determine the excel slope and intercept for the trend line if you prefer to see the data and the regression line visually (also called the line of best fit).
Assume you have the dataset depicted below and are trying to determine its slope and intercept:
The procedures are as follows:
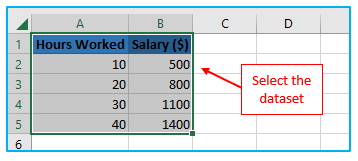
Step 1: Pick out the X and Y data points. (in our example, it would be “Hours Worked” and “Salary” column)
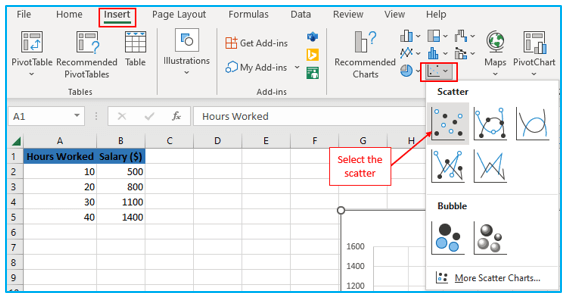
Step 2: On the ribbon, select the “Insert” tab. Select “Insert scatter” from the dropdown menu (under the Charts group). Choose “Scatter chart” from the choice that opens.
Step 3: This will add a scatter chart with your x-y values represented as scatter points to your worksheet (as shown below)
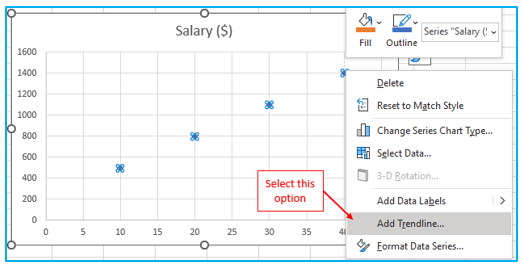
Step 4: Select “Add Trendline” from the context menu that appears by performing a right-click on one of the scatter points. By doing so, the trendline will be inserted and the right-hand “Format Trendline” pane will be opened.
Step 5: Select the “Display Equation on chart” checkbox under the “Trendline Options” heading in the “Format Trendline” pane.
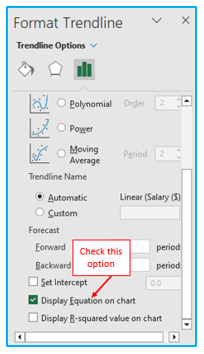
Step 6: Close the “Trendline Format” pane. With the aforementioned actions, a scatter chart with a trendline and an equation for the slope and intercept would be added.
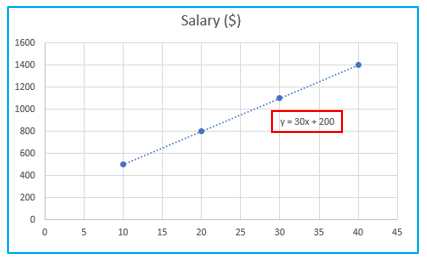
In our example, we obtain the equation shown below:
y = 30x + 200
Here:
- 30 is the slope of the regression line.
- 200 is the regression line’s intercept.
This result is the same as the ones we obtained from the SLOPE and INTERCEPT routines.
If the slope value is positive, the trend line will go upward; conversely, if the slope value is negative, the trend line will move downward. The slope value would determine how steep the slope was.
The advantage of utilizing the scatter chart method over the formula method for calculating slope and intercept is that you can visually observe the distribution of the data points as well as the slope of the regression line.
Additionally, determining the slope value by adding a trendline would actually be faster than utilizing the formulas in the event that you are nonetheless making a scatter chart for your data.
In Excel, you can use these two incredibly straightforward methods to determine the slope and intercept values of a data collection.
Application of Find Slope in Excel
- Linear Regression Analysis:
- Calculate the slope to perform linear regression analysis, which helps identify the best-fit line that represents the relationship between two variables in a dataset.
- Trend Analysis:
- Use the slope to analyze trends in data, allowing you to determine whether values are increasing, decreasing, or remaining constant over a given period.
- Financial Analysis:
- Determine the slope in financial datasets to analyze trends in financial performance, such as revenue growth or expenditure patterns.
- Scientific Data Interpretation:
- Apply the slope calculation in scientific research to analyze experimental data and identify the rate of change or correlation between variables.
- Forecasting and Prediction:
- Utilize the slope to make predictions about future values based on historical trends, aiding in forecasting and decision-making.
- Quality Control:
- Analyze data from quality control processes by finding the slope, helping identify patterns or deviations that may impact product quality.
Finding the slope in Excel is a versatile tool that enables a deeper understanding of the relationships within datasets, making it valuable for various fields such as statistics, finance, science, and more.
For ready-to-use Dashboard Templates:
