In Excel, a progress chart is a helpful tool for displaying data over time. Growth, milestones, and accomplishments along the way can all be documented and shared with the help of a progress chart. There are only a few essential steps required to create a progress chart in Excel and you’ll be well on your way to tracking your progress in no time. Here, you’ll learn the steps to make an Excel chart showing your progress.
Uses for progress charts:
- Following one’s steps towards a target
- Explicitly showing how something changed over time
- Keeping tabs on how well a group or person is doing over time
Please follow the below steps to create excel progress bar chart:
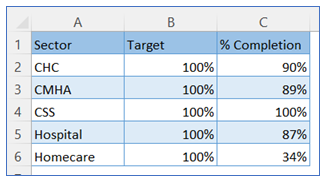
- Take sample data.
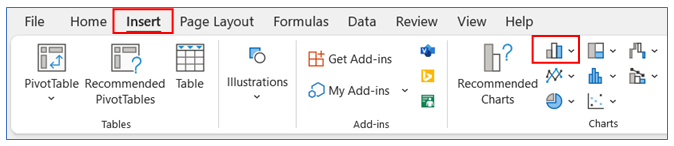
2. Select any cell of data then go to the ribbon, select Insert, and select your chart type from the chart group.
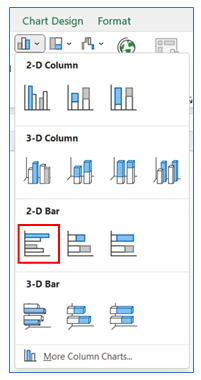
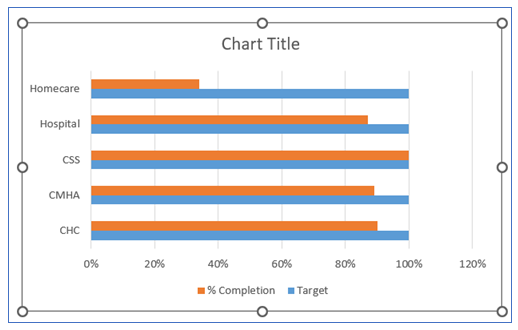
3. Select Chart type as 2-D Bar to create excel progress bar chart.
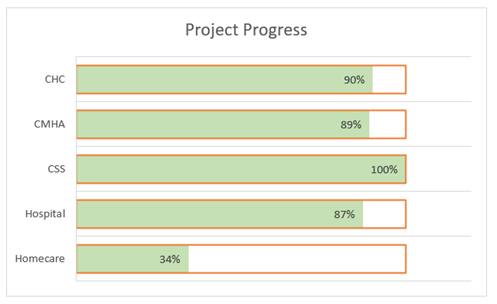
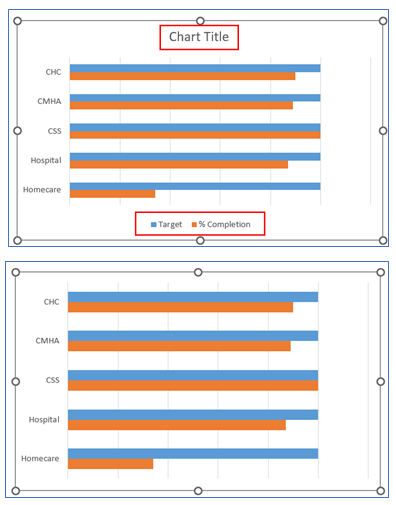
4. The chart looks below.
5. To change the category in reverse on the vertical axis, right-click on the axis and select Format Axis.
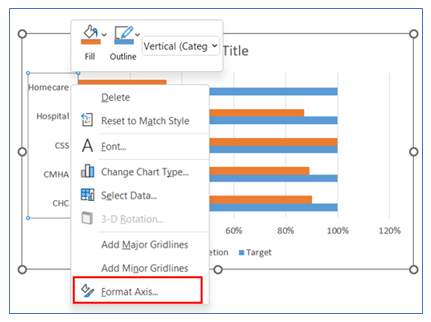
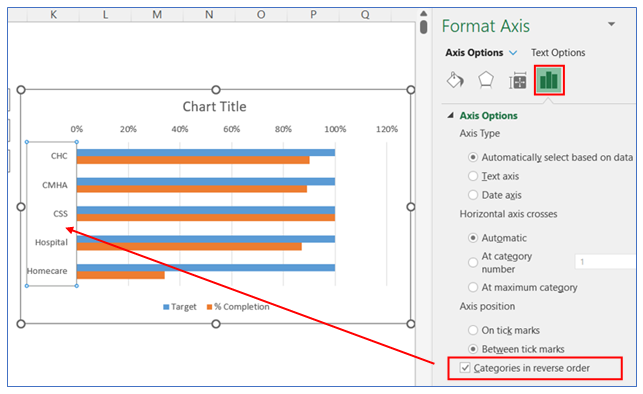
6. After that in the Axis Options give a checkmark on the ‘Categories in Reverse Order’ box.
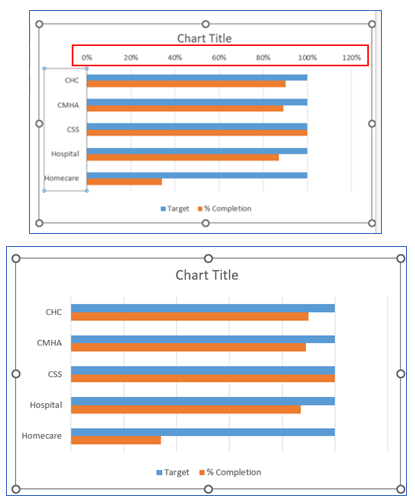
7. To remove the horizontal axis, click on Axis and press Delete.
8. To remove the Chart Title and Legend, click on the Chart Title and Legend then press Delete.
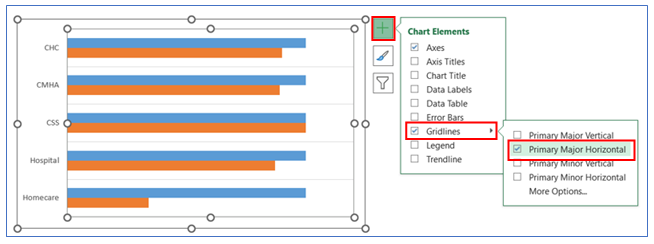
9. To give a horizontal Gridline, click on the chart then select the + button, and check the Gridline. Here we remove the vertical gridline and give a horizontal gridline.
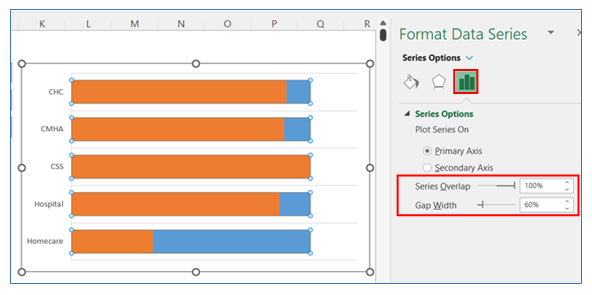
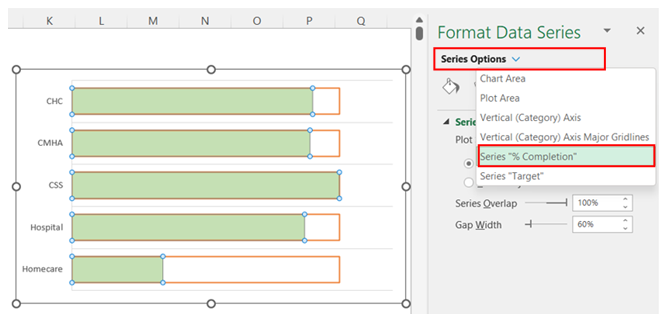
10. To change the gap width and Series Overlap in the bar, right-click on the chart and select Format Data, in Format Data Series select Series Option and change the gap width to 60% and Series Overlap to 100%.
11. To change the color in the first bar, right-click on the chart and select Format Data, in Format Data Series select Fill and choose your color.
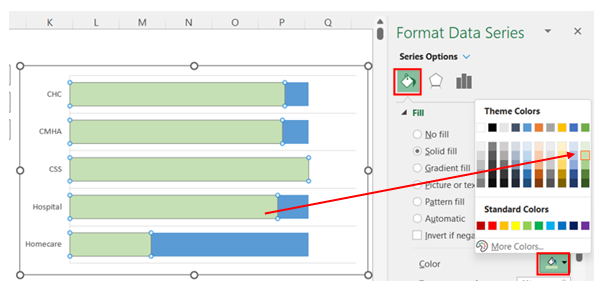
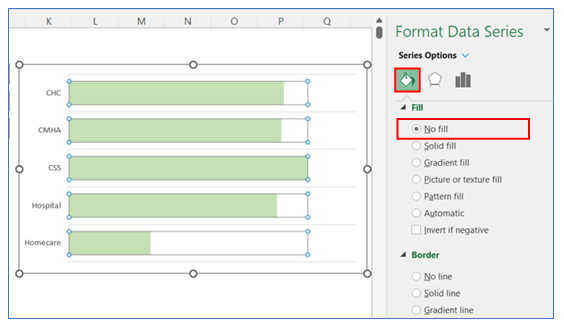
12. To change the color in the second bar, right-click on the chart and select Format Data, in Format Data Series select Fill and choose No fill.
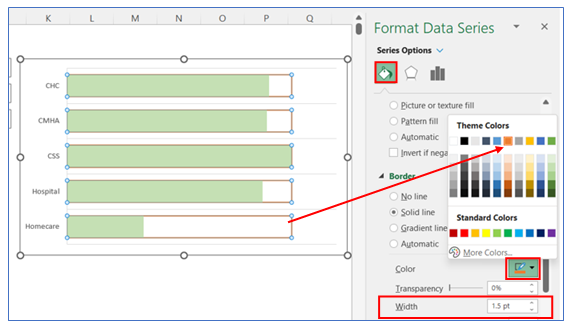
13. To change the color in the second bar outline, right-click on the chart and select Format Data, in Format Data Series select Border and choose your color and change Width to 1.5 pt.
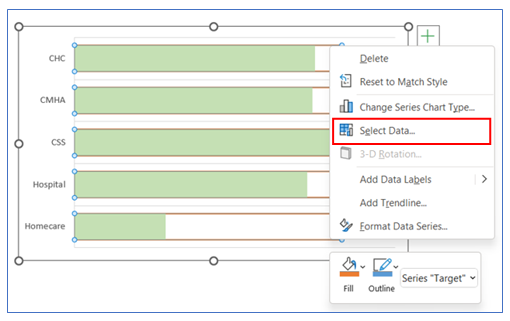
14. To bring forward the second bar outline, follow the below steps. Right-click on the bar and select data.
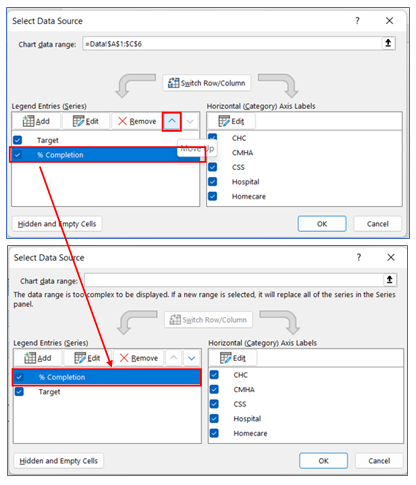
15. Select % of Completion and move up as indicated below image.
16. To give a data label of % completion, right-click on the bar, select Format Data Series, and choose the series type as % Completion.
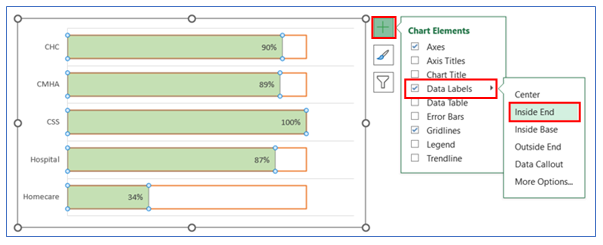
17. To give Data Labels click on your chart and select the + button to give your Data labels. Select Data labels and click on Inside End or any other option.
18. To give a Chart Title click on your chart and select the + button to give your Chart Title, select Chart Title.
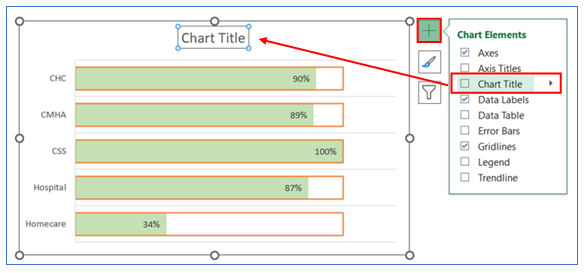
19. To change the chart title name, click the chart title and write the title name. The chart looks below.
Application of Progress Chart in Dashboard Reporting:
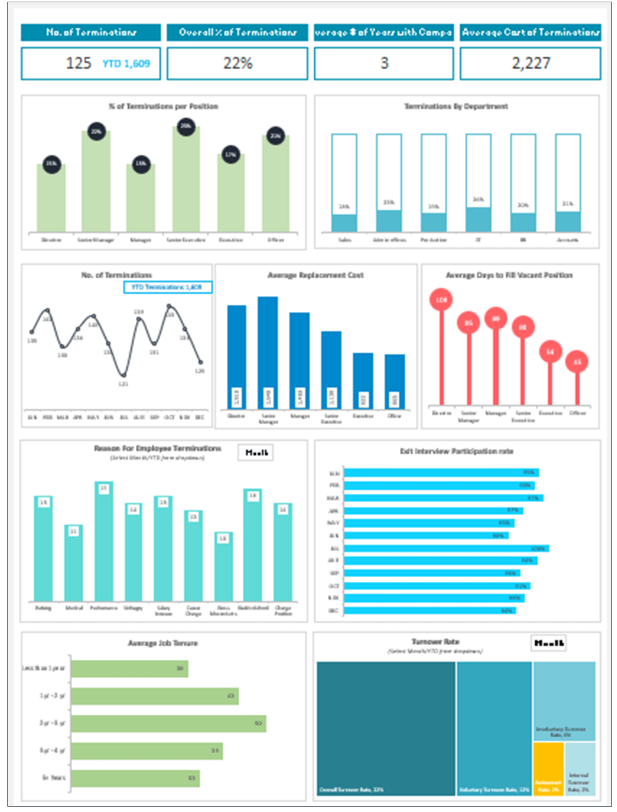
Progress Charts are essential tools in dashboard reporting, particularly for tracking the progression of tasks or goals over time. Here are six applications of Progress Charts in dashboard reporting:
- Tracking Project Milestones:
- Progress Charts can effectively track the completion status of various milestones in a project. This visualization helps project managers and teams understand what portions of the project are complete, in progress, or pending, facilitating better project management and timely interventions.
- Monitoring Sales Targets:
- In sales dashboards, these charts are invaluable for monitoring progress towards sales targets. They can show how close a team or individual is to achieving monthly, quarterly, or annual sales goals, enabling sales managers to make strategic decisions based on real-time data.
- Performance Measurement against KPIs:
- Progress Charts are used to measure and visualize the performance of individuals, teams, or the entire organization against key performance indicators (KPIs). This helps in quickly assessing whether performance standards are being met or if there are areas needing improvement.
- Budget Utilization Tracking:
- They can be used to track budget utilization in financial dashboards. For example, monitoring the percentage of an annual budget spent can help in ensuring that spending is on track and within the allocated limits.
- Goal Tracking in Personal Dashboards:
- In personal or individual performance dashboards, Progress Charts can track progress towards personal goals like learning objectives, fitness targets, or personal projects, providing a visual motivation and status check.
- Operational Efficiency Analysis:
- For operational dashboards, these charts can indicate the efficiency of different processes or systems, such as the percentage of tasks completed in a production cycle or the progress in resolving customer support tickets.
For ready-to-use Dashboard Templates:
