In Excel, bar charts are frequently used to display numerical information. They can be used to clearly demonstrate trends, comparisons, and changes in data over time, and are an efficient instrument for this purpose. This post will show you how to make a bar chart in Excel, including all the necessary steps.
Excel bar chart applications:
- Sales, revenues, and profits are just some of the many examples of business and financial data that can be represented using bar charts. Data from various time periods, product lines, or geographical locations can be compared with their help.
- They are also helpful in scientific studies for visualizing information like experimental outcomes, survey results, and demographics. Bar charts are useful for comparing data across demographic categories such as age, gender, and education.
- In project management, bar charts can be used to monitor development toward objectives and checkpoints. They are useful for visualizing a wide range of information, including project schedules, resource allocations, and financial outlays.
How to make a bar chart in excel?
In order to make bar chart excel, do the following steps:
- Take sample data.
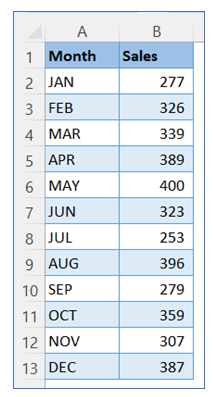
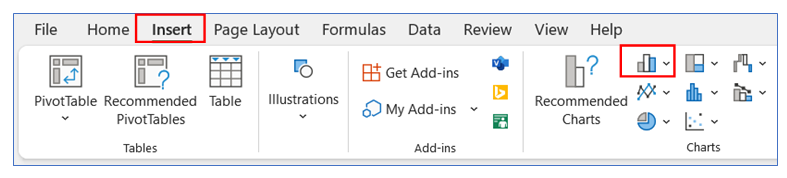
- Select data from the sample data, then go to the ribbon, select Insert, and select your chart type from the chart group.
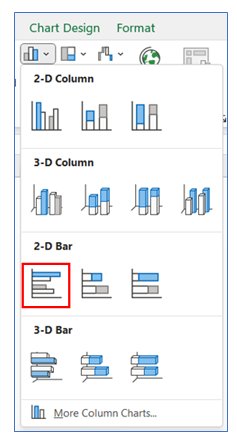
- Select Chart type as 2-D Bar.
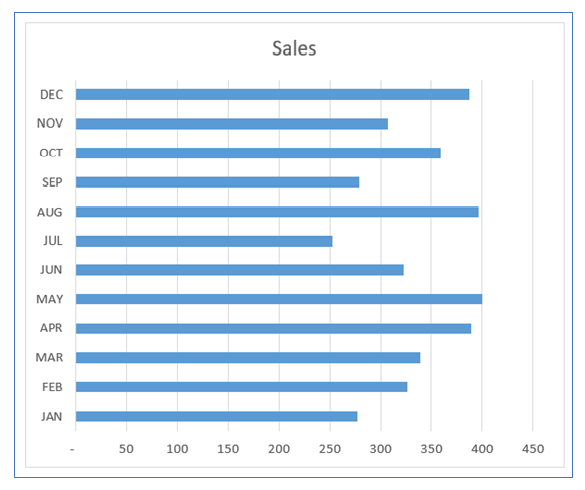
- Your chart looks like the below chart.
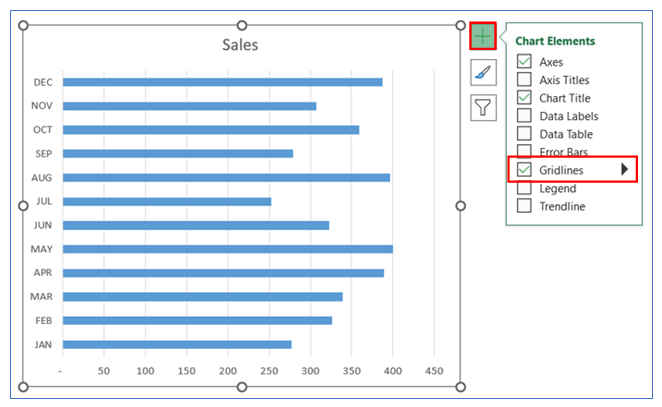
- To Remove Gridline, click on the chart then select the + button, and uncheck the Gridline.
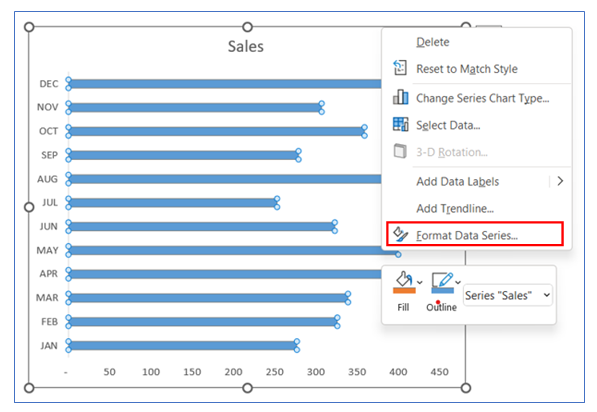
- To change the gap width, right-click on the chart and select Format Data Series.
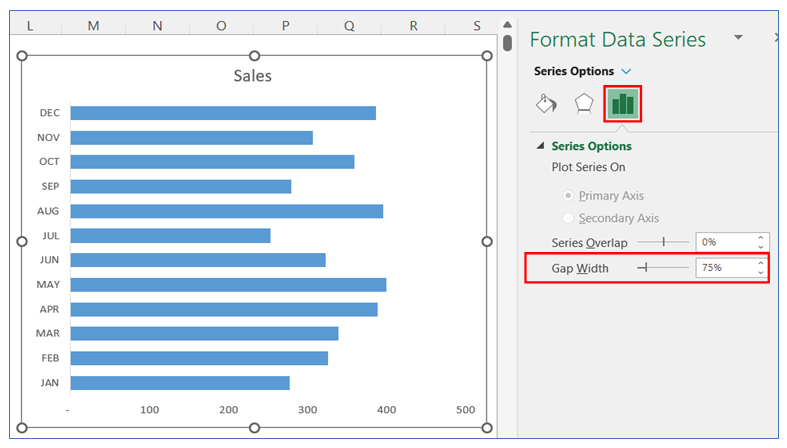
- After selecting Format data series go to the series Option and change the Gap width to 75%.
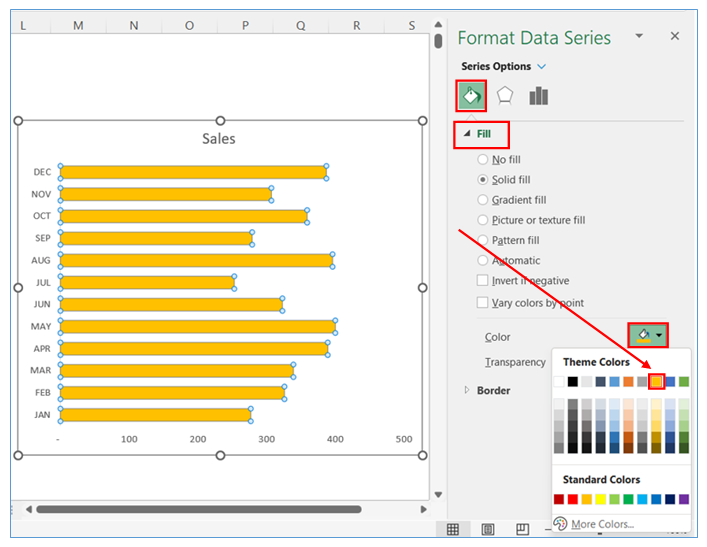
- To change the color in the bar, right-click on the chart and select Format Data Series, in Format Data Series select Fill and choose your color.
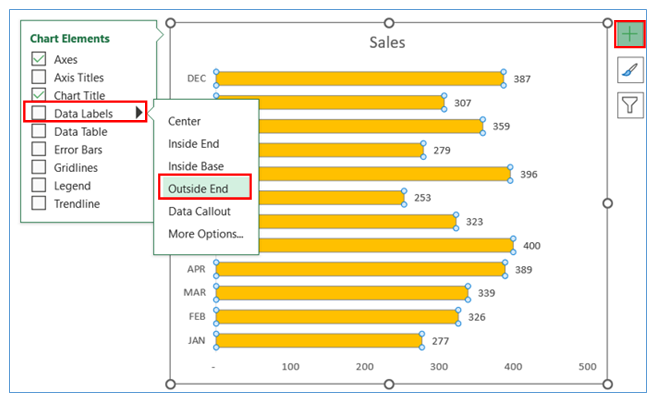
- To give Data Labels in the chart click on your chart and select the + button to give your Data labels. Select Data labels and click on Inside End or any other option.
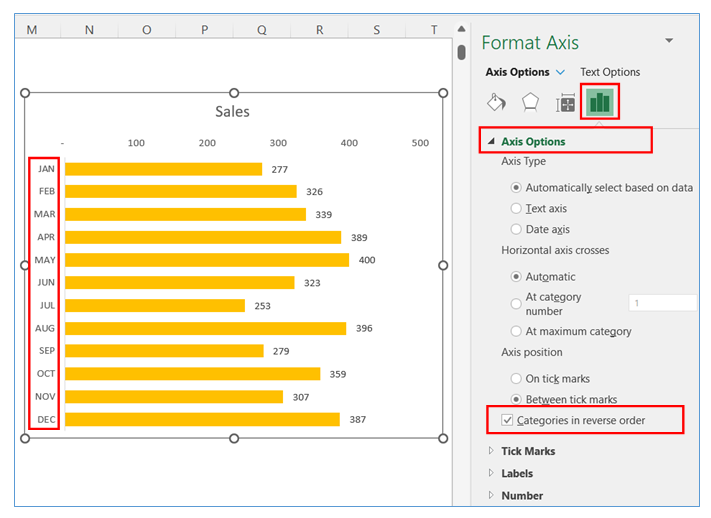
- To change the Categories in reverse order, right-click on the axis and select Format Axis, in Format Axis Series select the Axis option and check the Categories in reverse order.
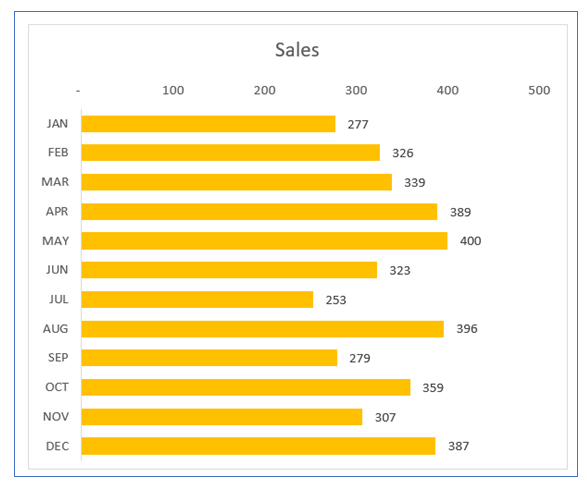
- The chart looks like below.
Application of Stacked Column Chart in Dashboard Reporting
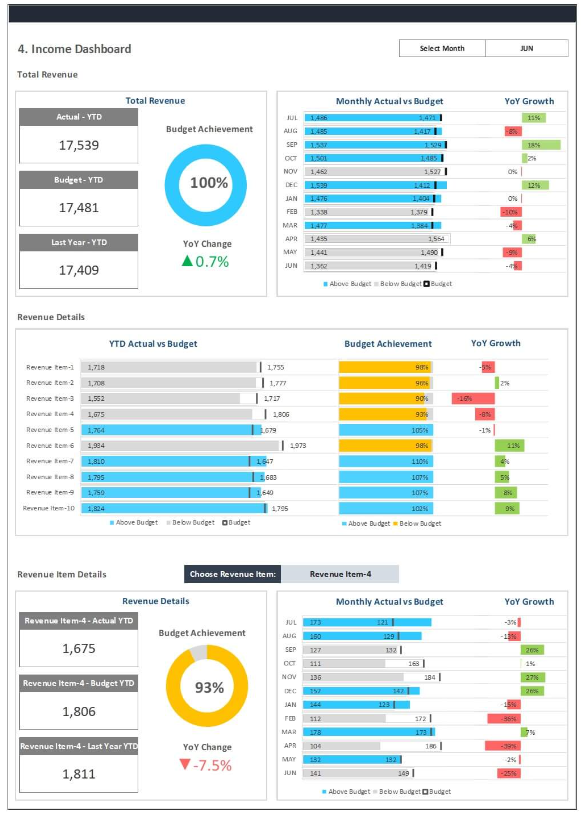
Here are Some uses of bar charts in dashboard reporting:
- Comparing Individual Categories:
- Ideal for displaying and comparing discrete data points across different categories, such as sales by product, customer counts by region, or expenses by department.
- Showing Frequency or Counts:
- Useful for representing the distribution or frequency of occurrences within different categories, like the number of issues reported in each category or attendance figures for events.
- Performance Benchmarking:
- Compares the performance of different entities against a specific benchmark or average, clearly showing which are above or below the standard in areas like sales targets, production goals, or customer satisfaction ratings.
- Temporal Comparisons:
- Displays data across different time periods for comparative analysis, such as quarterly sales figures, monthly website traffic, or yearly revenue growth, making temporal trends and patterns evident.
- Part-to-Whole Relationships:
- When used as stacked bar charts, they show the composition of different parts that make up the whole for each category, suitable for visualizing product mix, revenue streams, or demographic breakdowns.
- Deviation Visualization:
- Illustrates deviations or differences from a central value, commonly used in finance or quality control to show variances from a projected budget or standard measurements.
Bar charts are particularly effective in these scenarios because they provide a straightforward visual comparison of different categories or groups, making the differences and trends easily discernible at a glance.
For ready-to-use Dashboard Templates:
