Two Variable Data Tables in Excel offer a dynamic approach to analyzing the impact of varying two different parameters on your results. This robust feature allows you to explore and understand the relationship between these variables, providing valuable insights for decision-making and strategic planning. In this guide, we delve into the practical applications of creating and using Two Variable Data Tables, enabling you to conduct comprehensive what-if analyses with ease. Unlock the full potential of your data by mastering Two Variable Data Tables in Excel and make informed decisions with confidence.
This tutorial demonstrates how to use data tables in Excel for What-If analysis. Learn how to build up a data table to assess numerous formulas simultaneously, as well as how to establish a one-variable and two-variable table to see the effects of one or two input values on your formula.
This ‘Two Variable Data Tables’ Tutorial Covers:
- What is a data table in Excel
- How to make an Excel table with only one variable
- How to create a two variable Excel data table
- Data table to compare multiple results
- Things to Keep in Mind When Using Excel’s Data Table
- How to get rid of an Excel data table
- How to edit data table results
- How to recalculate data table manually
1. What is a data table in Excel?
A data table is one of the What-If Analysis tools in Microsoft Excel that enables you to experiment with various formula input values and observe how such changes impact the formulae’ output.
Data tables differ from Excel tables, which are used to manage a collection of connected data. A data table is where various values can be found by adding more fields and formulas. A table with only two parameters that can alter its value is said to have two variables, while the other values are maintained constant.
When a calculation depends on numerous values, and you want to experiment with different input combinations and evaluate the outcomes, data tables are extremely helpful.
One variable data table and two variable data tables are currently available. A data table allows you to test as many distinct variable values as you’d like but is only limited to a maximum of two separate input cells.
2. How to create a one-variable data table?
In an Excel one variable data table, you can test a range of values for a single input cell and see how they affect the outcome of a linked formula.
Instead of outlining general steps, we will use a specific example to assist you grasp this functionality.
Let’s say you’re thinking about putting your funds in a bank that offers 5% interest that multiplies every month. You created the following compound interest calculator in order to test various settings.
- The FV formula found in B7 is used to determine the closing balance.
- The variable you wish to test is B2 (initial investment).
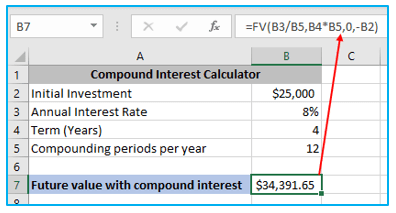
And now, let’s perform a straightforward What-If analysis to determine your savings after 4 years based on the range of your original investment, which is between $23,000 and $27,000.
Here are the steps to create a one variable data table in Excel:
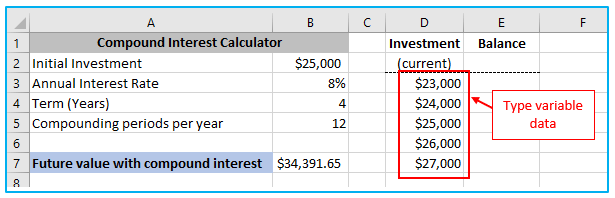
Step 1: Either enter the variable values in a single column or row. We’re going to make a column-oriented data table in this example, so we type our variable values in a column (D3:D7) and leave at least one vacant column to the right for the results.
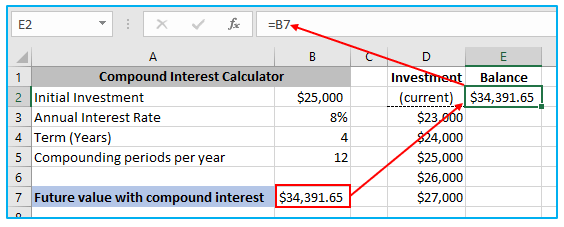
Step 2: In the cell one row above and one cell to the right of the variable values, type your formula (E2 in our case). Alternately, connect this cell to the formula in the first dataset (if you decide to change the formula in the future, you will need to update only one cell). We pick the second option and type the following straightforward formula into E2: =B7
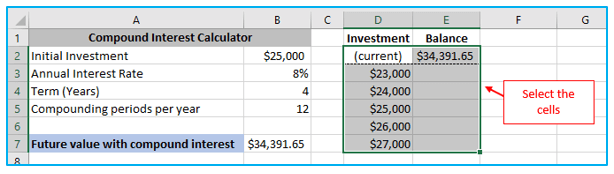
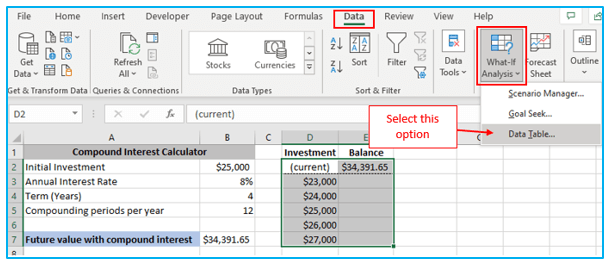
Step 3: Choose the data table range, which should contain the cells with your formula, variable values, and empty cells for the outcomes (D2:E7).
Step 4: Navigate to the “Data” tab, select the “What-If Analysis” button from the “Data Tools” group, and then select “Data Table…”
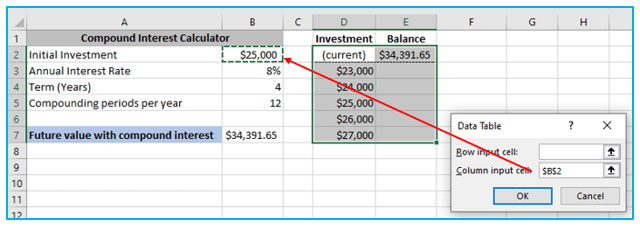
Step 5: Because the values for our Investment are in a column, choose the variable value in cell specified in your formula by clicking in the “Column Input cell” box in the “Data Table” dialog window. In this case, we choose B2 because it has the initial investment amount in it.
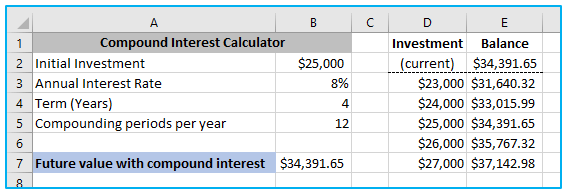
Step 6: As soon as you click OK, Excel will begin to fill the empty cells with results that correspond to the variable value in the adjacent row. You are ready to go once you apply the proper number format to the results (in our case, currency).
Now that you have your one-variable data table, you can quickly review the potential balances and select the ideal deposit size:
3. How to create a two-variable data table in Excel?
The formula result is affected by different combinations of the values of the two sets of variables, as seen in a two variable data table in Excel. In other words, it demonstrates how altering two input values can alter the result of a given calculation.
With the exception of entering two ranges of potential input values, one in a row and one in a column, the methods to construct a two variable data table in Excel are essentially the same as in the example above.
Let’s use the same compound interest calculator to investigate how the quantity of the initial investment and the number of years affect the balance to see how it works.
Steps to make two variable data table is shown below:
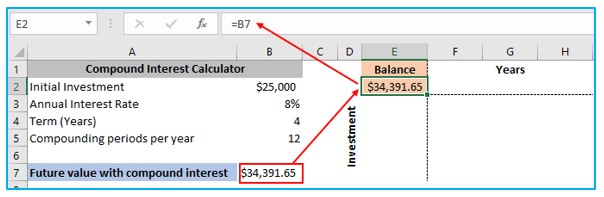
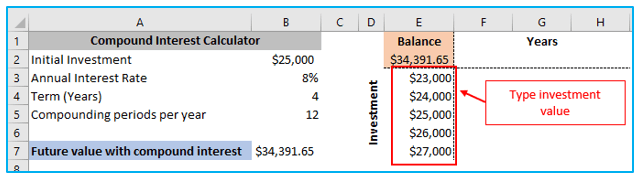
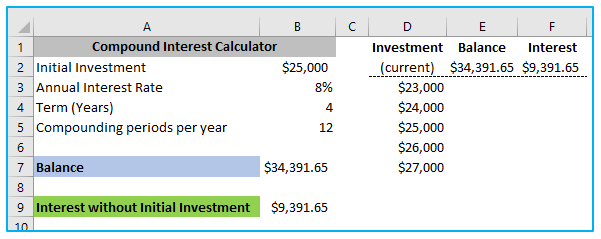
Step 1: Fill in a blank cell with your formula or connect it to the formula in the first cell. Make sure there are enough empty rows below and empty columns to the right to accommodate your variable values. The cell E2 is once again connected to the initial FV formula that determines the balance: =B7
Step 2: Below the formula, enter one set of input values in the same column (investment values in E3:E7).
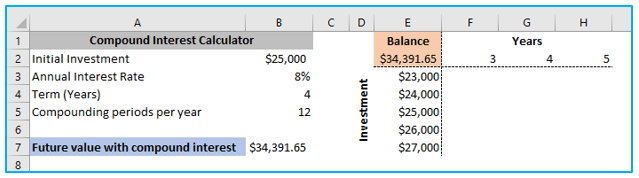
Step 3: Put the values for the other set of variables in the same row, to the right of the formula (number of years in F2:H2).
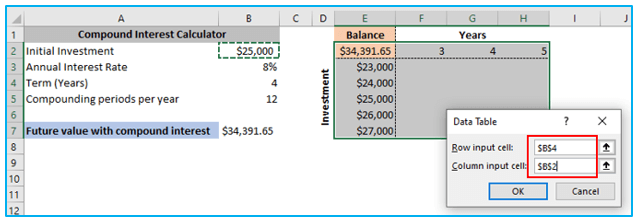
Your two-variable data table should now resemble the following:
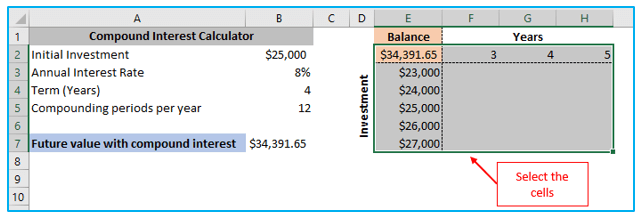
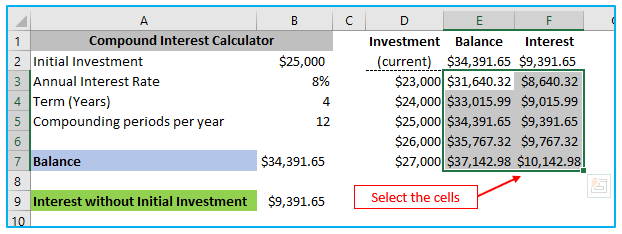
Step 4: Choose the whole data table range, including the formula, the variable values’ row and column, and the cells that will contain the calculated values. E2 through H7 is the range we choose.
Step 5: Navigate to the “Data” tab, select the “What-If Analysis” button from the “Data Tools” group, and then select “Data Table…”
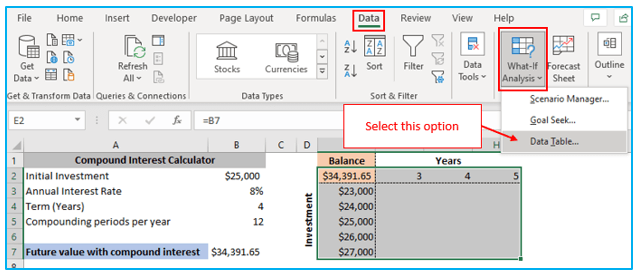
Step 6: Enter the reference to the input cell for the variable values in the row (in this example, it is B4 with the Years value) in the “Row input cell” box. Then enter the reference to the input cell for the variable values in the column in the “Column input cell” box (B2 containing the Initial Investment value). Select OK.
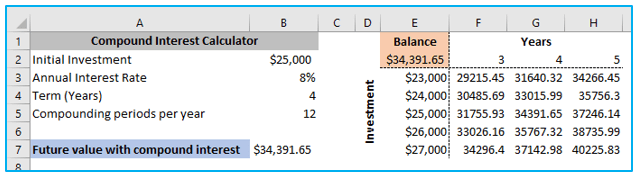
Step 7: Optionally, format the outputs as necessary (in our example, using the Currency format), then examine the outcomes:
4. Data table to compare multiple results:
Build your data table as indicated in the preceding instances if you want to assess more than one formula at once, and then enter the additional formula(s):
- In the case of a vertical data table with columns, to the right of the first formula.
- In the case of a horizontal data table with rows, the first formula is below the table.
All of the formulae in the “multi-formula” data table must use the same input cell in order to function properly.
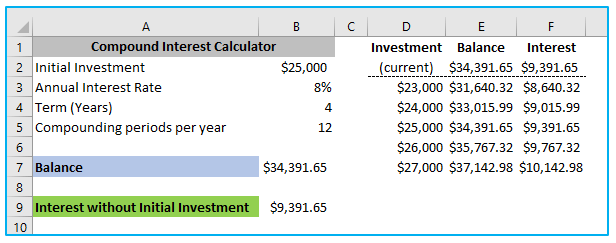
Let’s add another formula to our one-variable data table as an illustration to calculate the interest and see how the initial investment size affects it.
What we do is as follows:
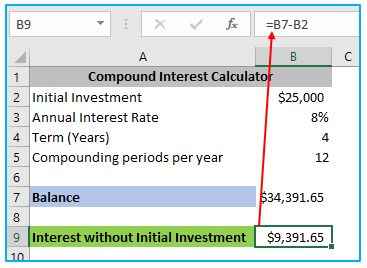
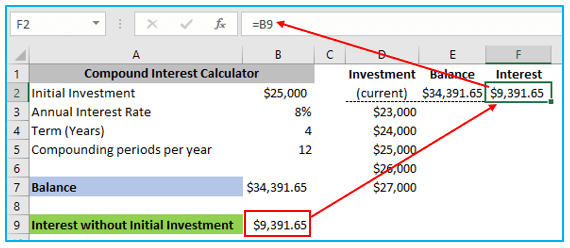
First, Use the following formula to calculate the interest in cell B9:
=B7-B2
Second, Organize the data table’s source data in the same manner as before: Variables in D3:D7 and E2 are connected to B7 by the balance formula.
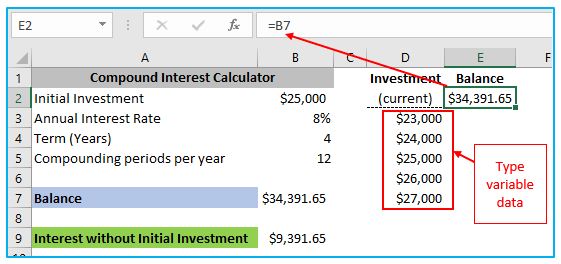
Third, Column F should be added to the data table range, and F2 should be connected to B9 (interest formula).
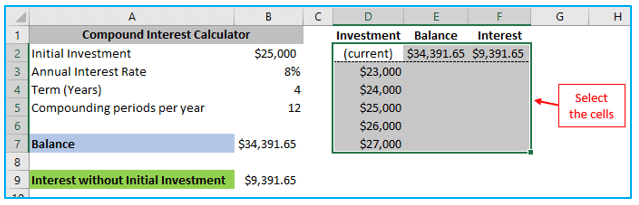
Fourth, The extended data table range should be chosen (D2:F7).
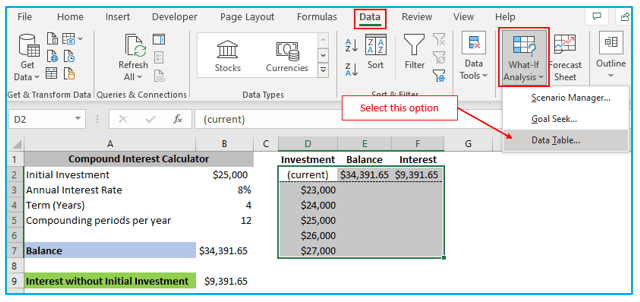
Fifth, Navigate to the “Data” tab, select the “What-If Analysis” button from the “Data Tools” group, and then select “Data Table…”
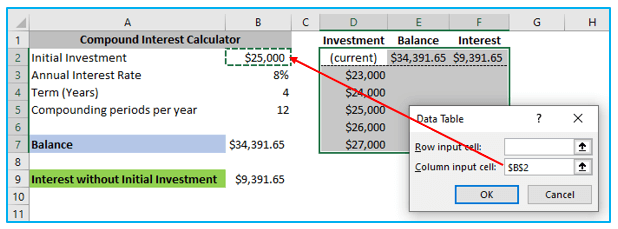
Sixth, Enter the input cell (B2) in the column input cell box and press OK.
Finally, you can see how your variable values affect both formulas:
5. Things to Keep in Mind When Using Excel’s Data Table:
Please bear in mind these 3 straightforward facts in order to efficiently use data tables in Excel:
- The input cell(s) for a data table must be on the same sheet as the data table in order for it to be correctly constructed.
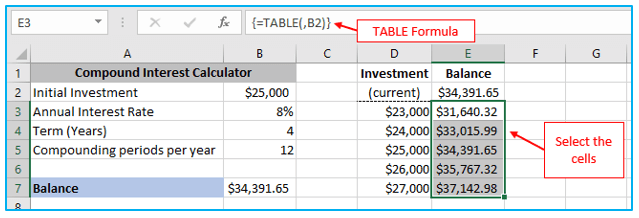
- The TABLE(row_input_cell, colum_input_cell) function in Microsoft Excel is used to compute the results of a data table:
- Depending on the layout, one of the arguments in a one-variable data table is omitted (column-oriented or row-oriented).
- Both arguments are present in the data table for the two-variables.
A formula for an array is used to enter the TABLE function. You may verify this by choosing any cell that has the calculated value, selecting the formula bar, and observing the “curly brackets” that surround the formula. However, it differs from a typical array formula in that neither you nor another user can alter an existing one or enter a new one. It’s all “for show.”
- The resulting cells cannot be modified separately since the array formula used to produce the data table results was used. Only the full array of cells can be changed or removed, as will be described later.
6. How to get rid of an Excel data table?
Excel does not let you delete data from specific cells that include results, as was already indicated. The error “Cannot update part of a data table” will appear whenever you attempt to do this.
However, you can quickly remove all of the generated values from the entire array.
The steps to delete data table in excel are described below:
Step 1: Choose either all of the data table’s cells or just the ones containing results, depending on your requirements.
Step 2: Simply press the Delete key on your keyboard. Done!
7. How to edit data table results?
You cannot alter individual cells that contain computed values in Excel since it is not possible to update a portion of an array.
Step 1: Choose every cell in the outcome.
Step 2: In the formula bar, remove the TABLE formula. Then, enter the desired value while holding down the Ctrl key. The same value will be entered in each of the chosen cells as a result:
Once the TABLE formula is removed, the previous data table transforms into a regular range, allowing you to change any individual cell as you normally would.
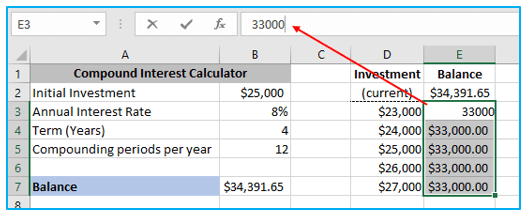
8. How to recalculate data table manually?
You can stop automatic recalculations in that and all other data tables if they are causing your Excel to lag because they contain a high number of variable values and formulas.
Go to the “Formulas” tab to do this. Then select “Automatic Except for Data Tables” from the list of options under the “Calculation” category by clicking the “Calculation Options” button.
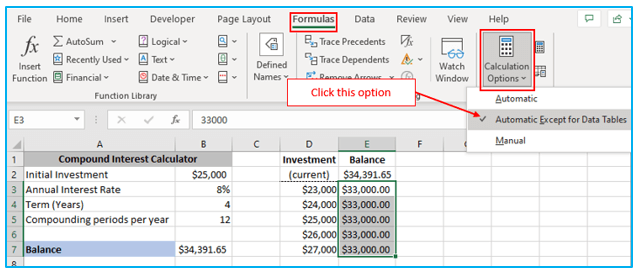
This will hasten workbook recalculations by disabling automated data table calculations.
Select your data table’s resulting cells, or the cells with TABLE() formulae, then press F9 to manually recalculate it.
For ready-to-use Dashboard Templates:
