Many Excel users are quite familiar with the idea of Unique and Distinct values in Microsoft Excel. You may have come across Unique and Distinct values frequently when working on an Excel spreadsheet with a lot of data and numbers. This article will show you how to count Unique and Distinct values in your Excel spreadsheets.
This Content Covers:
- What is the difference between Unique Value and Distinct Value?
- How to Count Unique Values in Excel?
- Count Unique Values in a Column
- Count Unique Text Values
- Count Unique Numbers
- Count Case-Sensitive Unique Values
- How to Count Distinct Values in Excel?
- Count Distinct Values ignoring Blank Cells
- Count Distinct Text Values
- Count Distinct Numbers
- Method to Count Case-Sensitive Distinct Values
- Count Distinct Values in Excel Pivot Table
- By Adding a Helper Column in the Dataset
- By Adding Data to Data Model and Summarizing Using Distinct Count
1. What is the difference between Unique Value and Distinct Value?
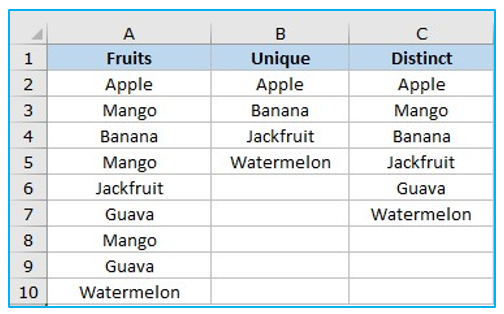
The difference between Unique and Distinct values in Excel is that Unique values are those which are present in our worksheet only once and not more than once, but on the other hand, Distinct values can be present in our worksheet multiple times. When counting Excel count distinct values, each data is counted only once regardless of how many times it is present in the datasheet.
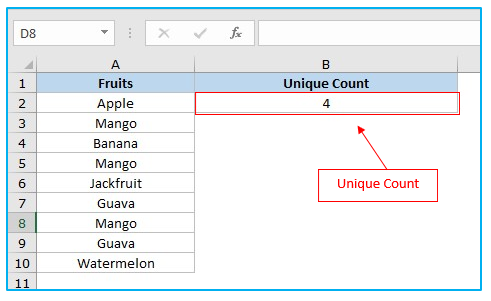
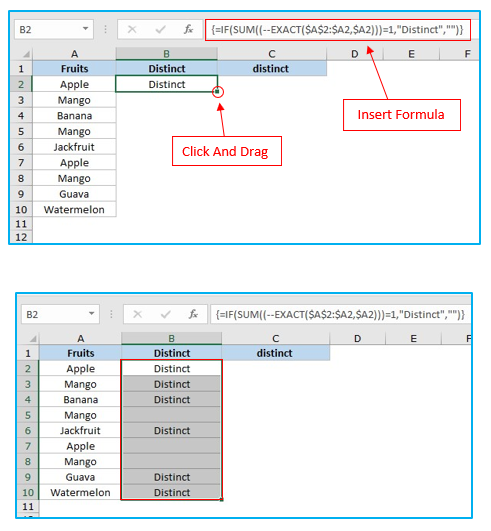
For example, have a look at the image below. The Fruit column has a list of names, and Apple, Banana, Jackfruit, and Watermelon are all present just once in the list, making them Unique values in accordance with the discussion we had before. All of the names of these fruits are included in the Distinct column. However, names that appear more than once, such as Mango and Guava, are also counted as one.
2. How to Count Unique Values in Excel?
There are a good number of ways to count unique Excel values in Microsoft Excel. Some of the most useful methods are shown below.
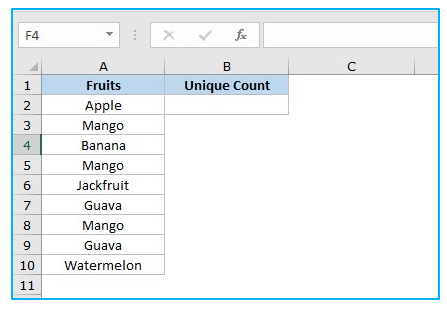
2.1 Count Unique Values in a Column
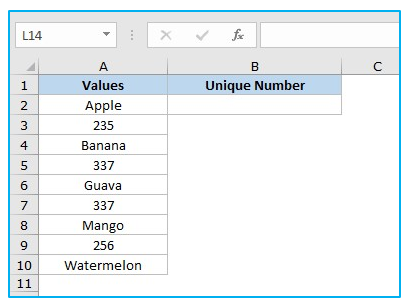
Using the data given in the picture below you must count unique values from the Fruit column.
Step 1: Select cell B2 and type of paste the formula given below in that cell.
=SUM(IF(COUNTIF(A2:A10,A2:A10)=1,1,0))
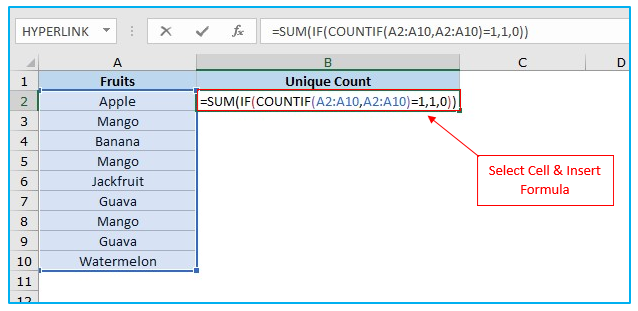
Step 2: This is an array formula so pressing the Enter key won’t work here. Press CTRL+SHIFT+ENTER and cell B2 will show how many fruit names are Unique values or how many fruit names are present in the column only once.
2.2 Count Unique Text Values
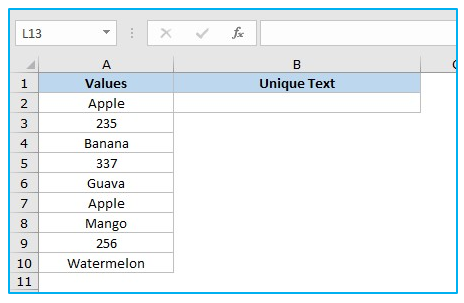
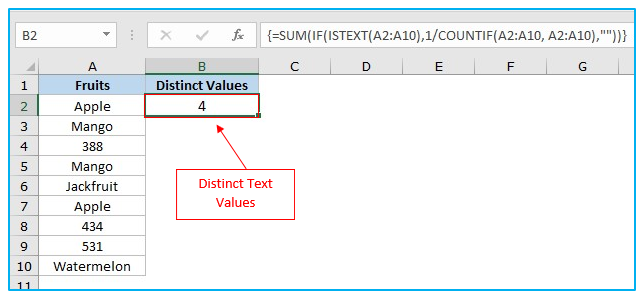
In the picture given below, you have two types of data numeric and text. Follow the steps below to count the Unique Text values from this data.
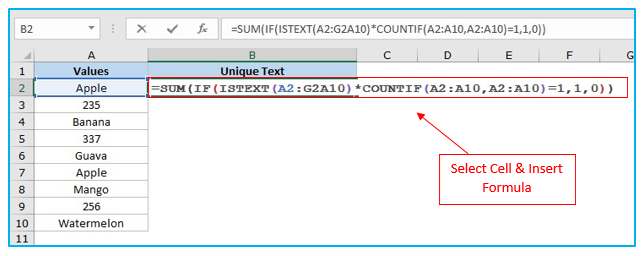
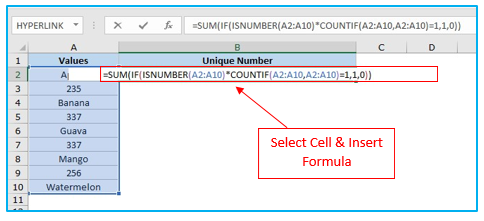
Step 1: Input the following formula into cell B2.
=SUM(IF(ISTEXT(A2:A10)*COUNTIF(A2:A10,A2:A10)=1,1,0))
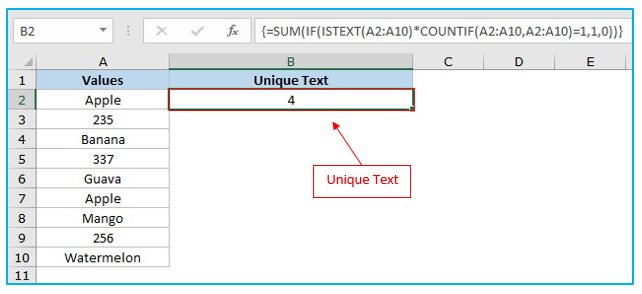
Step 2: Press CTRL+SHIFT+ENTER. In the column Banana, Guava, Mango and Watermelon these 4 are the Text values which are Unique values that cell B2 also confirms after using the formula in it.
2.3 Count Unique Numbers
You have two sorts of data—text and numeric—as shown in the image below. To count the Unique Numbers from this data, simply follow the instructions below.
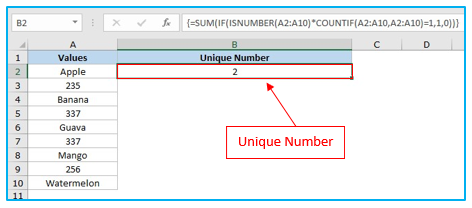
Step 1: Type of paste the formula given below in cell B2 after selecting it.
Step 2: Use CTRL+SHIFT+ENTER command and cell B2 will show you the count of Unique Numbers in the worksheet.
2.4 Count Case-Sensitive Unique Values
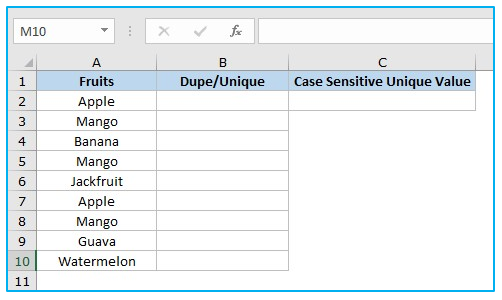
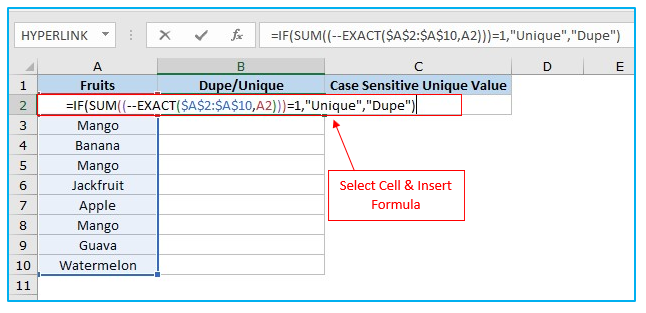
Here an additional Column has been created labeled as Dupe/Unique as a helper column to identify Unique and Duplicate data. To count Case Sensitive Unique Values using the data of the below given picture, simply follow the steps shown below.
Step 1: Select cell B2 and input the bellow given formula.
=IF(SUM((–EXACT($A$2:$A$10,A2)))=1,”Unique”,”Dupe”)
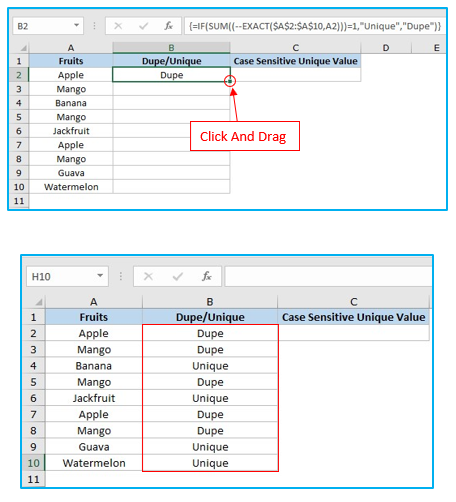
Step 2: Click CTRL+SHIFT+ENTER and cell B2 will show if the data from cell A2 is a Dupe or a Unique data. Now take your mouse cursor to the bottom right corner of cell B2 and drag it down from B2 to B10 to use the same formula in all those cells in order to find out which data is Dupe and which one is Unique.
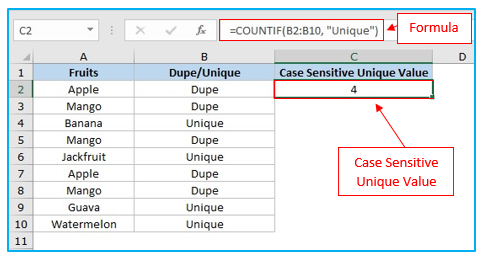
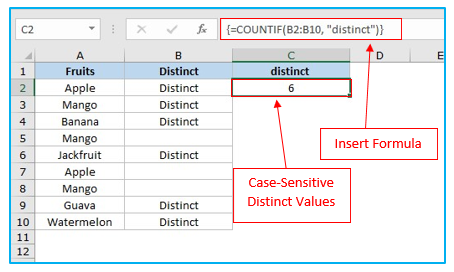
Step 3: Select cell C2 and use this formula and click Enter button cell C2 will show how many Case-Sensitive Unique Values are there in that worksheet.
=COUNTIF(B2:B10, “Unique”)
3. How to Count Distinct Values in Excel?
3.1 Count Distinct Values ignoring Blank Cells
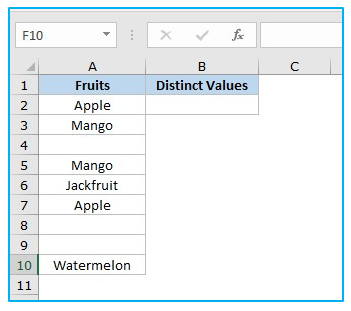
In the picture given below, there are some blank cells. Now to count Distinct values ignoring blank cells, repeat the steps as shown below.
Step 1: Select cell B2 and input the below given formula in that cell.
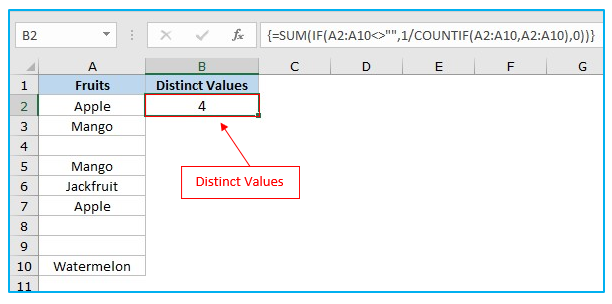
=SUM(IF(A2:A10<>””,1/COUNTIF(A2:A10,A2:A10),0))
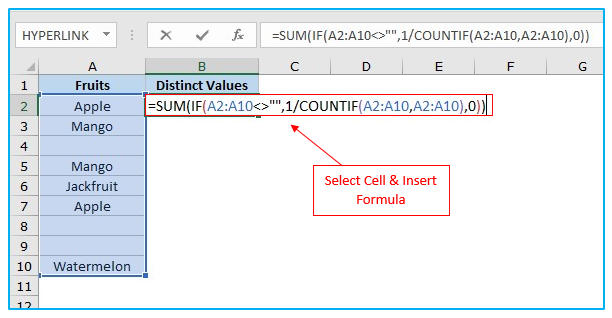
Step 2: This is an array formula so pressing the Enter key won’t work here also. Press CTRL+SHIFT+ENTER and cell B2 will show the count of Distinct values ignoring those blank cells.
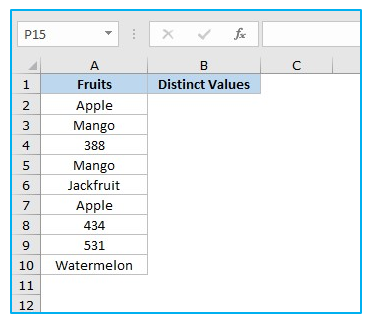
3.2 Count Distinct Text Values
Follow the steps below to count distinct text values from the data of this picture.
Step 1: Incorporate the formula in Cell B2 after selecting the cell.
=SUM(IF(ISTEXT(A2:A10),1/COUNTIF(A2:A10, A2:A10),””))
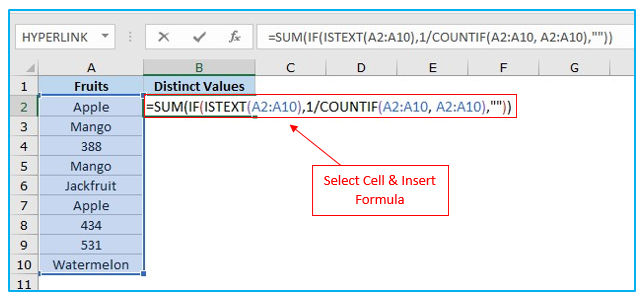
Step 2: Press CTRL+SHIFT+ENTER as this is an array formula and pressing only Enter won’t work correctly.
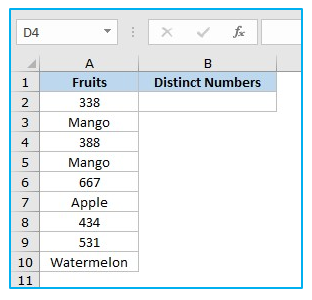
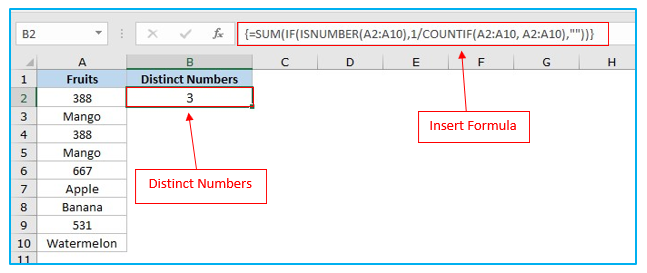
3.3 Count Distinct Numbers
By following the procedure shown below, you can count Distinct numbers from the data of this picture.
Step 1: Select cell B2 like previous methods and input the formula given below. Now click CTRL+SHIFT+ENTER key. Cell B2 will display the count of distinct numbers of this datasheet.
=SUM(IF(ISNUMBER(A2:A10),1/COUNTIF(A2:A10, A2:A10),””))
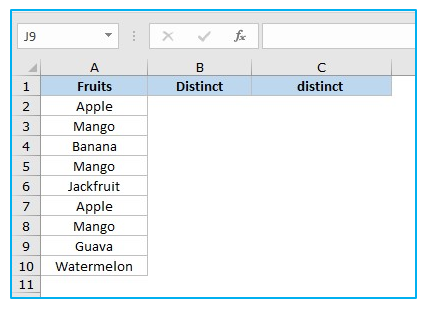
3.4 Method to Count Case-Sensitive Distinct Values
Here an additional Column has been created labeled as Distinct as a helper column. To count Case Sensitive Distinct Values using the data of the below given picture, simply follow the steps shown below.
Step 1: Select cell B2 and input the bellow given formula. Press CTRL+SHIFT+ENTER. Take your mouse cursor to bottom right corner of cell B2 and drag it down from B2 to B10.
Step 2: Select cell C2 and use this formula and click Enter button and cell C2 will show how many Case-Sensitive Distinct Values are there in that worksheet.
4. Count Distinct Values in Excel Pivot Table
4.1 By Adding a Helper Column in the Dataset
You can count Distinct values in Excel Pivot Table by adding a helper column in your datasheet.
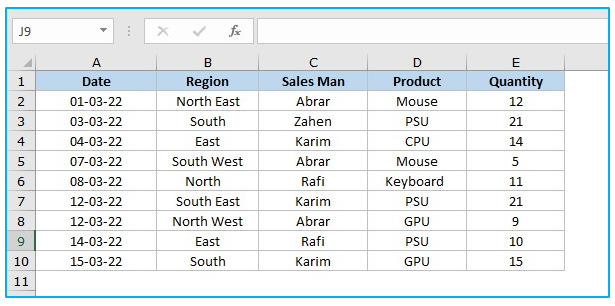
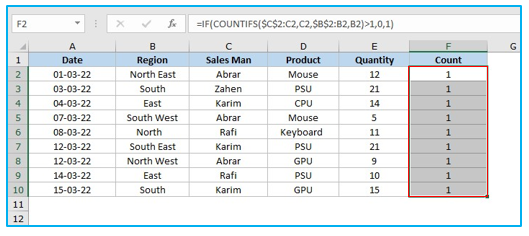
Here you have this datasheet as shown in the picture below. Here we will learn how to add a helper column in this datasheet and create a pivot table to count Distinct values.
Step 1: Column F has been chosen as the helper column in this datasheet. Select cell F2 and insert the formula given below in that cell. And Click enter.
=IF(COUNTIFS($C$2:C2,C2,$B$2:B2,B2)>1,0,1)
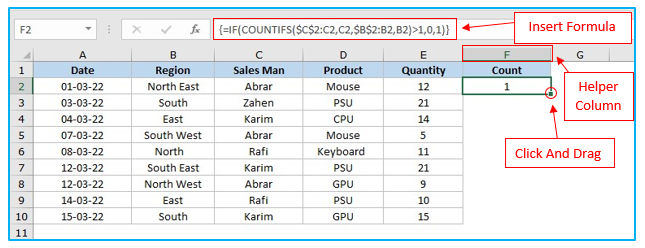
Step 2: Drag the lower right corner of cell F2 to F10 in order to quickly incorporate the same formula in all these cells.
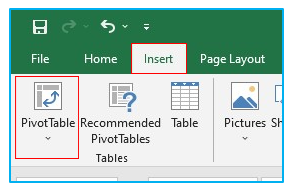
Step 3: Select Pivot Table under Insert tab.
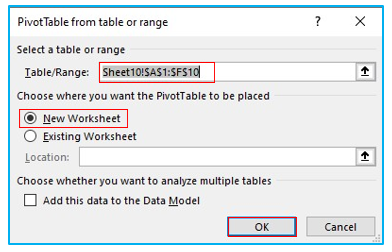
Step 4: In the Pivot table dialogue box, select the range of your datasheet containing data in the box labeled as Table/Range. Then select New Worksheet and click OK.
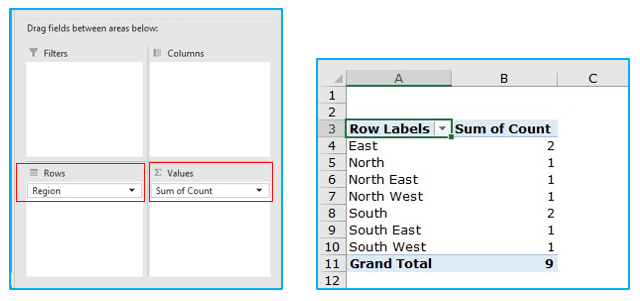
Step 5: Drag Region in the Row tab and Count in Values tab. You will have your pivot table which looks like the one below.
4.2 By Adding Data to Data Model and Summarizing Using Distinct Count
Here you have this datasheet as shown in the picture below.
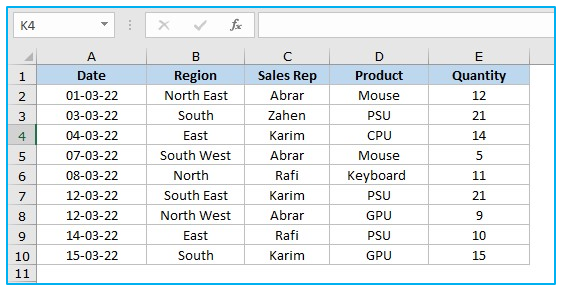
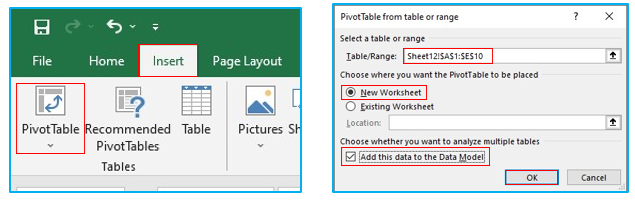
Step 1: Select Pivot Table under the Insert tab. In the Pivot table dialogue box, select the range of your datasheet containing data in the box labeled as Table/Range. Then select New worksheet, check to Add this data to the Data Model and click OK.
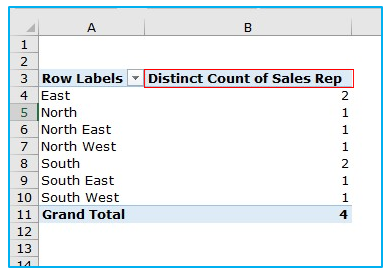
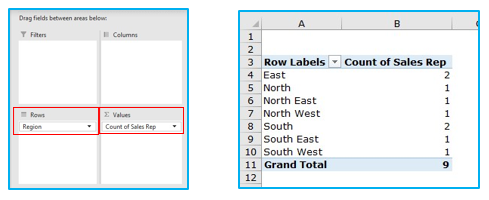
Step 2: Drag Region in Rows section and Sales Rep in Values section. Now you have this pivot table shown below.
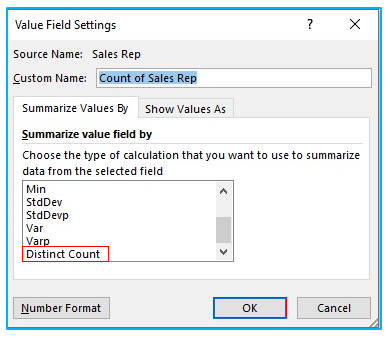
Step 3: Right click on any cell containing data under Count of Sales Rep. Select Value Field Settings.
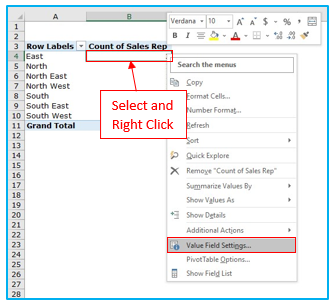
Step 4: From Value Field Settings dialogue box select Distinct Count and click OK.
Step 5: In the pivot table the column name changed from Count of Sales Rep to Distinct Count of Sales Rep.