Count Colored Cells in Excel to unlock a new dimension of data analysis and reporting. This technique enhances your ability to quickly interpret and act upon data categorized by color, making it indispensable for project management, budgeting, and inventory control. By mastering the skill to count colored cells, you can streamline workflows, improve accuracy, and present data in a more intuitive and accessible manner. Elevate your Excel skills by incorporating this function into your data management strategy, and transform color-coded information into actionable insights.
This Content Covers:
1.1 Using the Find and Select option
1.2 Using Filter and SUBTOTAL
1.3 Using GET.CELL Function
1.4 Using VBA
1. How to Count Colored Cells in Excel?
1.1 Using the Find and Select option
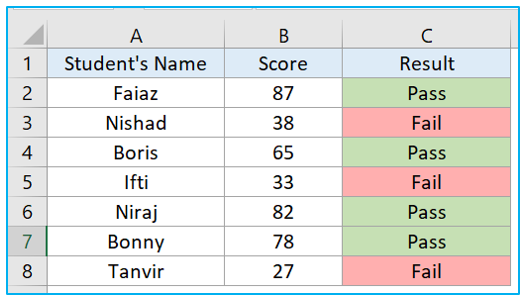
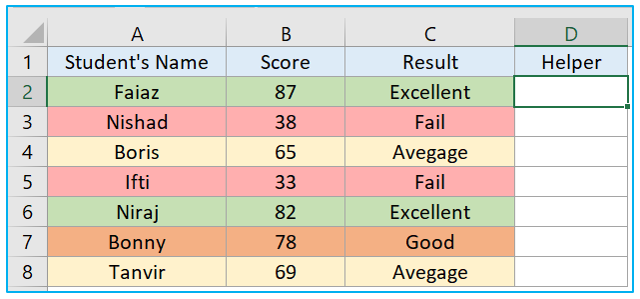
Suppose you have a table like this and you want to extract the information about how many students have passed or failed based on the Result column’s-colored cells. Here color green represents Pass and the color red represents Fail. Follow the steps below to learn how you can count colored cells using Excel’s Find and Select option.
Step 1: Go to Home Tab>>Find & Search>>Find. Or press CTRL+F shortcut key to open Find and Replace dialogue box.
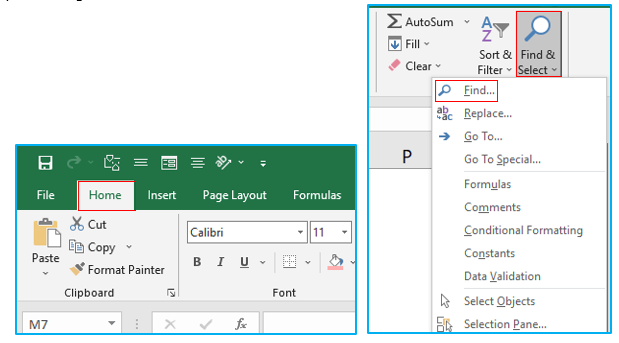
Step 2: From Find and Replace dialogue box, click on the drop-down button of Format and select Choose Format From Cell.
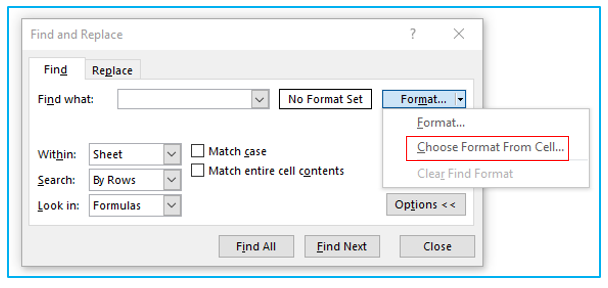
Step 3: You will see a dropper like icon on your worksheet, now take that on any of the colored cell which you want to count and click on it. The Preview box inside Find and Replace dialogue box will display that color for you. Click on Find All and all the cells that matched the formatting are displayed in the lower portion of the Find and Replace dialog box. The total count of that particular-colored cells can be found in the lower left corner. So now you know that 4 students have passed the test.

1.2 Using Filter and SUBTOTAL
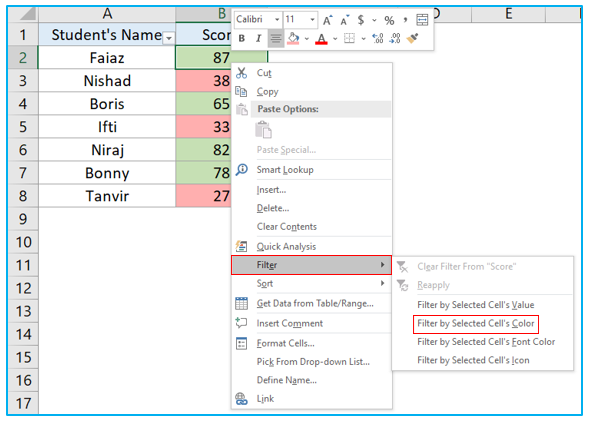
Step 1: Right click on any cell of the table and select Filter>>Filter by Selected Cell’s Color. Or just use CTRL+SHIFT+L shortcut keys to apply filters in your data table.
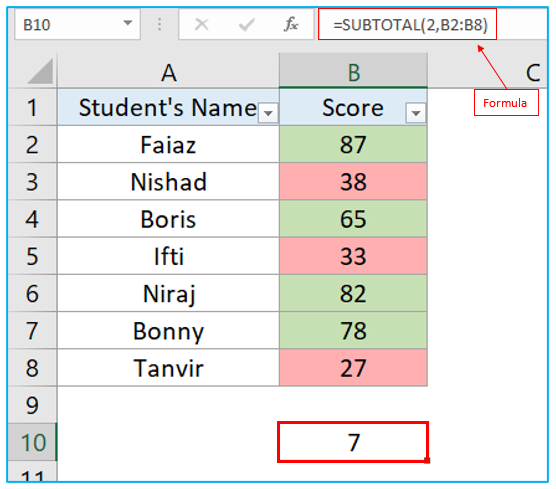
Step 2: Insert the following formula in a cell where you want the count to be displayed and hit Enter key. This will show you how many cells are there in that range that have a data in them. The number 2 in the formula is the numerical indicator for the COUNT function.
=SUBTOTAL(2,range)
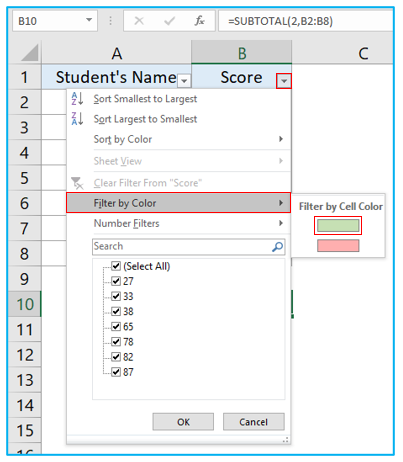
Step 3: Now click on the filter button>>select Filter by Color and choose the color you want.
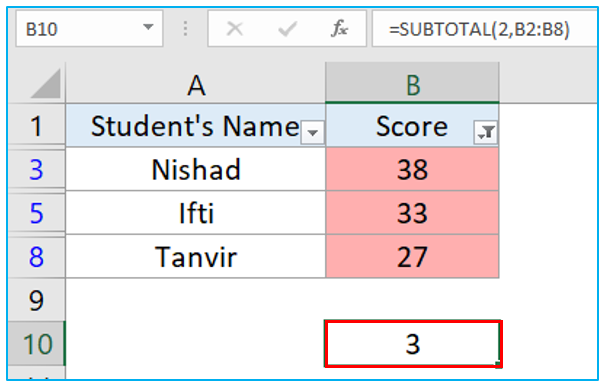
Step 4: Here I have selected color red to know how many students have failed in the test and B10 cell showing me the exact amount of red colored cells visible. So now I know that 3 of the students have failed in the test.
1.3 Using GET.CELL Function
Due to compatibility concerns, the Macro4 function GET.CELL has been preserved. If you utilize it as one of the worksheet’s normal functions, it won’t function. It also won’t work with conditional formatting; however, this function works with Excel named ranges.
Suppose we have this data table and now we want to count the colored cells using GET.CELL function. Follow the steps below:
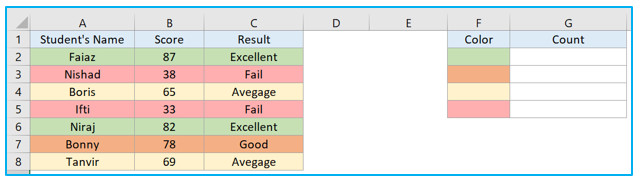
Step 1: Create a Helper column in column D and select cell D2.
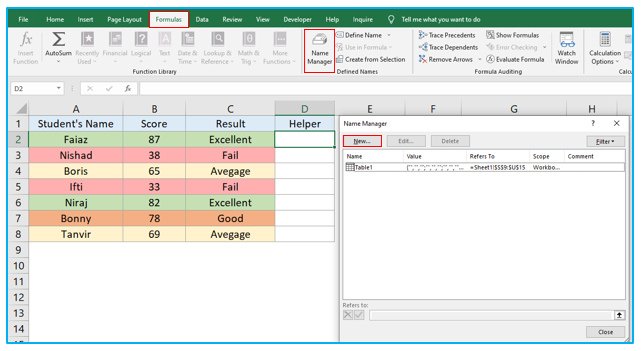
Step 2: Go to Formulas>>Name Manager and from the Name Manager dialogue box select New.
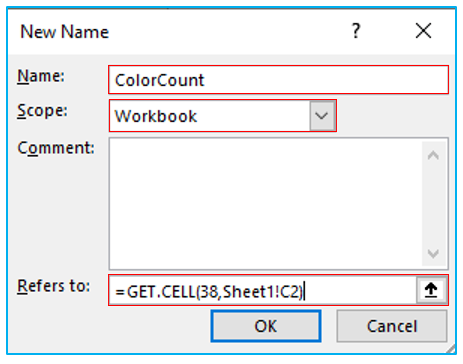
Step 3: Inside the New Name dialogue box, name your formula something that you can remember in the Name box. For Scope select Workbook. Now insert this GET.CELL formula given below inside Refers to box. Here the number 38 inside the formula is a parameter that returns the shade of the foreground color of the selected cell. Now click OK>>Close.
=GET.CELL(38,SheetName!colored cell)
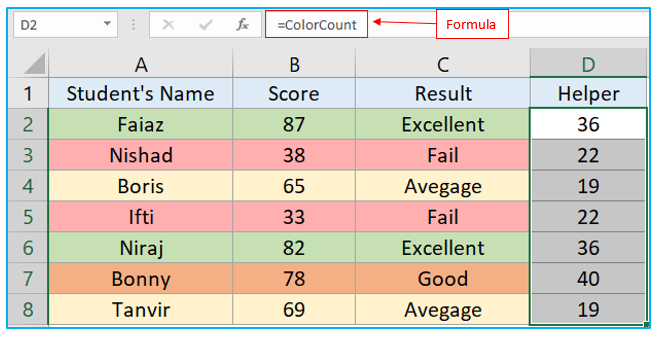
Step 4: Select cell D2 and start typing the formula you just created and you will see the formula in the drop-down menu. Click on it and hit Enter. This will convert the color from cell C2 into a numerical form in D2. Now drag D2 down to D8 to apply the formula in the whole column of this table. You have the numerical value for each of the colors available in your data sheet which are different from each other.
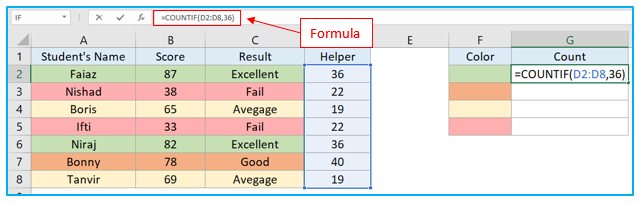
Step 5: Now select cell G2 and insert the following formula in that cell and hit Enter key. The digit 36 inside the formula is the numerical value of color Green. When you hit the Enter key this cell will display the count for color Green in the data table.
=COUNTIF(range of numerical value,[numerical value for a particular color])
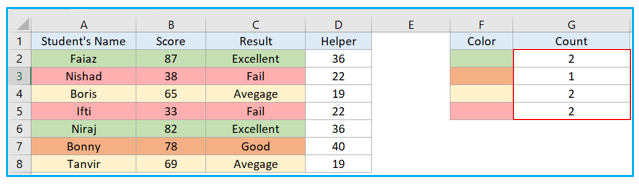
Step 6: Repeat this formula in cell G3, G4 and G5 with the color’s numerical value from the helper column to have the count of these colored cells.
1.4 Using VBA
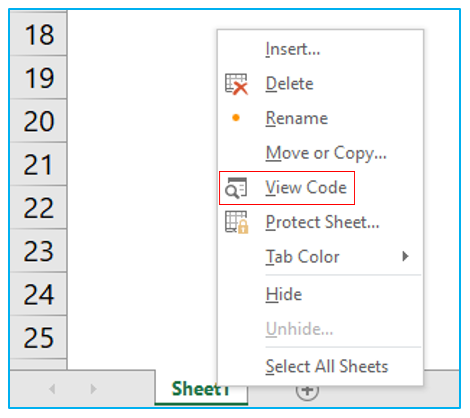
Step 1: Right click on the worksheet name and select View Code.
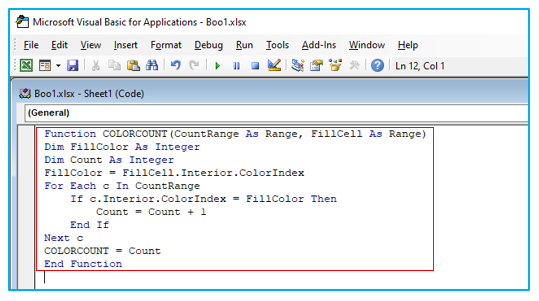
Step 2: Insert the below given code inside VBA Code box and then close the VBA window.
Function COLORCOUNT(CountRange As Range, FillCell As Range)
Dim FillColor As Integer
Dim Count As Integer
FillColor = FillCell.Interior.ColorIndex
For Each c In CountRange
If c.Interior.ColorIndex = FillColor Then
Count = Count + 1
End If
Next c
COLORCOUNT = Count
End Function
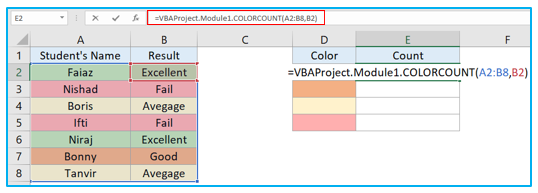
Step 3: Select cell E2 and start typing =vba and you will see the VBAProject formula. Select it then select the range and the color which you want the count of. Click Enter and the cell will display how many cells are there of that particular color.
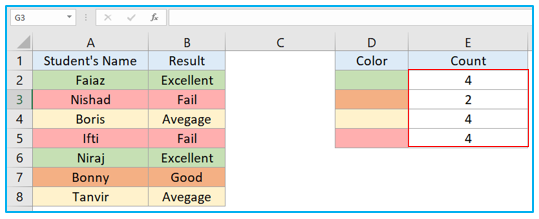
Step 4: Follow the previous step for the other colors too.
Application of Count Colored Cells in Excel
- Project Status Tracking: Utilize colored cells to represent different statuses of tasks (e.g., complete, in progress, pending) and count them to get a quick overview of project progress.
- Budget Allocation Analysis: Apply different colors to cells based on expenditure categories within a budget and count the number of cells per category to analyze budget allocation.
- Attendance Records: Mark attendance using different colors for present, absent, and leave days in a spreadsheet and count the colored cells to summarize individual attendance records.
- Sales Performance Metrics: Color-code sales data based on performance thresholds (e.g., above or below targets) and count the colored cells to assess overall sales performance.
- Inventory Level Indicators: Use colors to indicate inventory levels (e.g., low, medium, high) in a stock list and count the occurrences to manage stock more efficiently.
- Customer Feedback Analysis: Categorize customer feedback into different sentiment categories using colors and count them to gauge overall customer satisfaction and areas for improvement.
For ready-to-use Dashboard Templates:
