Area Under the Curve in Excel is a powerful method for analyzing data trends and calculating integral values, especially in fields like finance, biology, and engineering. By mastering this technique, you can gain deeper insights into your data, visualize cumulative totals, and make more informed decisions. Whether you’re analyzing growth rates, assessing performance metrics, or conducting scientific research, calculating the area under the curve in Excel provides a clear and accurate way to interpret complex data sets. Embrace this feature to enhance your analytical capabilities, streamline your workflow, and unlock new levels of precision and understanding in your data analysis tasks. With the area under the curve in Excel, transform your data into actionable insights that drive better outcomes and success.
This Tutorial Covers:
- Using Excel formula for computing the area under a curve
- Utilizing the Trend line Equation to calculate Area Under the Curve
1. Using Excel formula for computing the area under a curve:
AUC cannot be calculated directly, as I previously stated, but it can be done using a helper column and a basic formula.
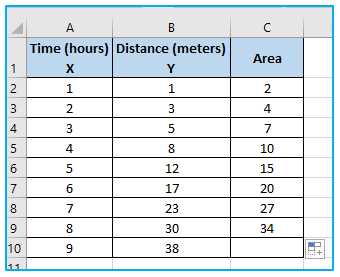
Below I have a dataset that represents the distance traveled by a vehicle over a period of time. The time column represents the number of hours since the vehicle started its journey, and the distance column represents the corresponding distance traveled in meters.
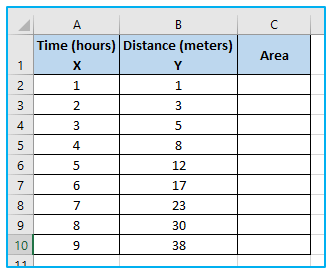
The Time column represents X-Axis value and the Distance column represents Y-Axis value in the chart.
The steps to determine area under curve in excel using formula are described below:
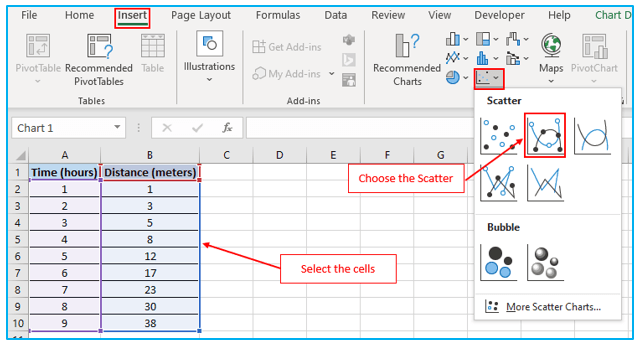
Step 1: Choose the dataset’s region A1:B10. After that, select the “Insert” option. Continue by choosing the “Charts” section’s “Insert Scatter (X, Y)” option. Choose “Scatter with Smooth Lines and Markers” from the drop-down menu now.
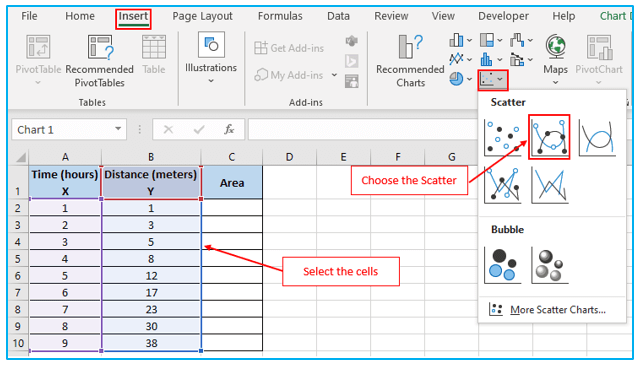
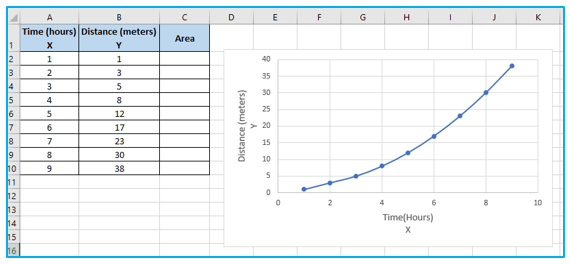
This will consequently show a chart similar to the one below.
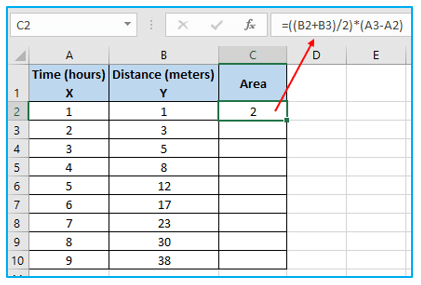
Step 2: We will also determine the area of our first trapezoid, which lies beneath the curve between X = 1 and X = 2.
To do so, put the following formula in cell C2:
=((B2+B3)/2)*(A3-A2)
Step 3: To determine the area of the trapezoids, use the Fill Handle tool up until the second-to-last column.
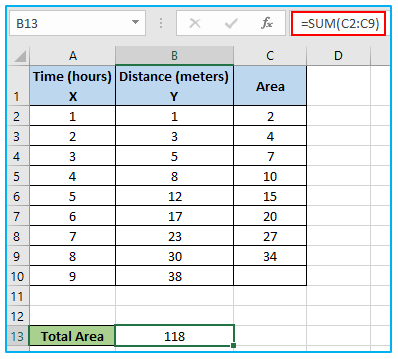
Step 4: Then we will combine all of the trapezoids’ areas. In order to do this, put the following formula in cell B13:
=SUM(C2:C9)
2. Utilizing the Trend line Equation to calculate Area Under the Curve:
We can discover an equation for the curve with the help of the Excel Chart Trendline. To determine the area under the curve, we use this formula. Assume we have a dataset with the same columns A and B but distinct points on the X and Y axis. The formula from which we can determine the area under the curve is obtained using the chart trendline.
How to calculate area under curve using the Trend line Equation is shown below:
Step 1: Choose the dataset’s region A1:B10. After that, select the “Insert” option. Continue by choosing the “Charts” section’s “Insert Scatter (X, Y)” option. Choose “Scatter with Smooth Lines and Markers” from the drop-down menu now.
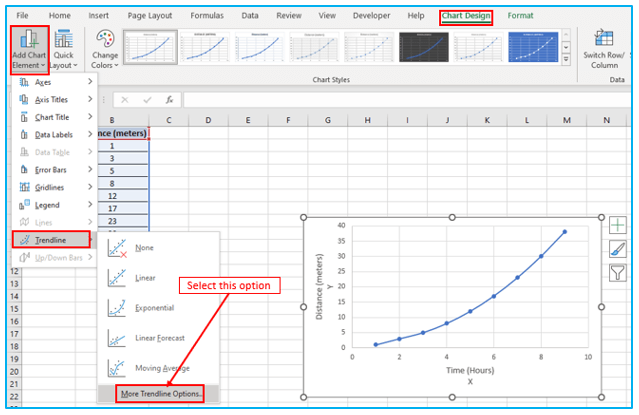
Step 2: Navigate to the “Chart Design” tab. Furthermore, choose “Add Chart Element” drop down from the “Chart Layouts” section. Select “Trendline” from the drop-down menu. Select “More Trendline Options” after that.
Step 3: In this case, it will launch the “Format Trendline” window. Choose “Polynomial” from the “Trendline Options”.
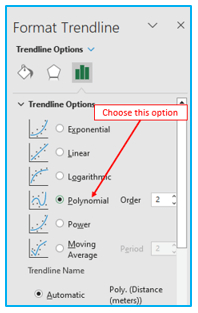
Step 4: In addition, check “Display Equation on chart” from the drop-down menu.
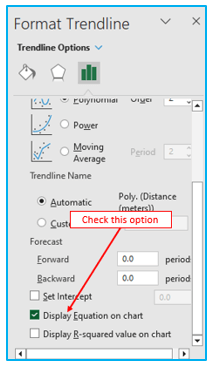
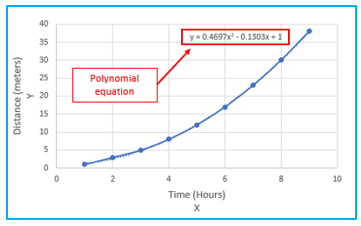
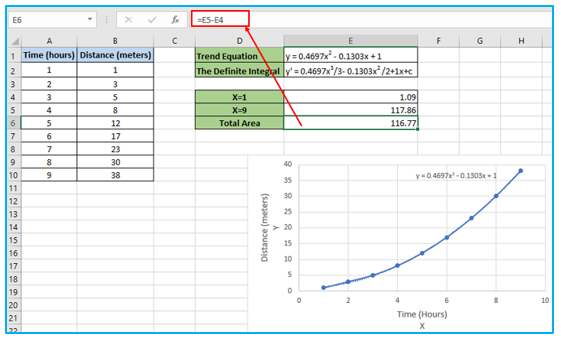
The polynomial equation is finally visible on the chart. The following is the polynomial equation:
y = 0.4697×2 – 0.1303x + 1
Step 5: If you are not familiar with integrals, this step is the most difficult of this tutorial. In a nutshell, you must convert the equation to its definite integral and use the definite integral to determine the lowest and maximum values. The area under the curve will be determined by the difference between the two outcomes.
Each x value must be given a 1 power boost before being divided by the new power value. As an illustration, x2 becomes x3/3. This means that the following will be our formula:
0.4697×3/3- 0.1303×2 /2+1x+c

Step 6: Calculating the precise integral values for the smallest and largest x follows next. The c values don’t matter because subtracting them nullifies them, so you can remove them. In our case, they are 1 and 9:
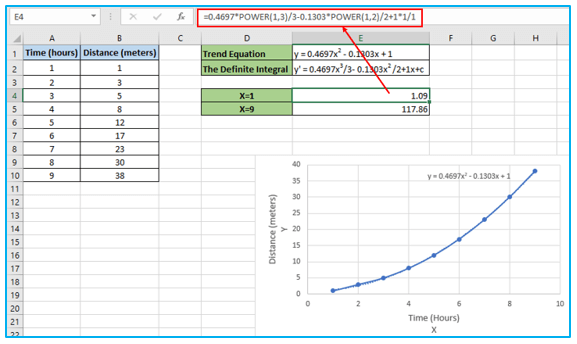
Step 7: In order to determine the area under the curve, the difference between largest and smallest X value’s integral values . So, enter the following formula:
Application of Area Under the Curve in Excel
For ready-to-use Dashboard Templates:
