Calculate Percentage Change in Excel to unlock a deeper understanding of your data’s dynamics. This crucial analytical tool allows you to measure growth, assess performance, and make informed decisions based on clear, quantifiable changes. By mastering percentage calculations, you can present your findings more effectively, identify trends, and set actionable goals. Whether for personal finance, business analysis, or academic research, knowing how to accurately calculate percentage change in Excel can transform raw data into valuable insights, driving your projects and decisions forward with precision and confidence.
What is percentage Change between two values? Percentage increase & Percentage decrease.
Excel simply need one formula to determine percentage differences between two numbers. Divide the new value by the old value after deducting the old value.
Increase and Decrease Percentage
The term “percentage increase” refers to how much a value has increased, represented as a percentage. In contrast, percentage drop refers to the amount by which the measure of an object decreases.
Example of Percent Change:
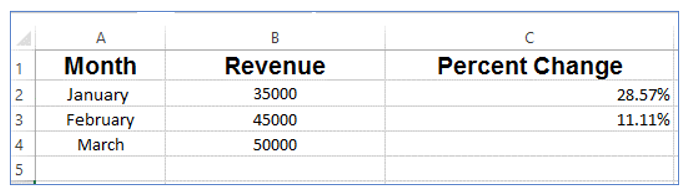
For example, XYZ company have achieved a revenue of $35,000 in the previous month. However, the current month’s revenue is $45,000. What is the percentage change in revenue compared to the last month?
Percent Change = (New Value – Old Value) / Old Value
So, Percent Change = (45000 – 35000) / 35000
= 10000 / 35000
Percent Change = 0.2857
=28.57%
To better understand how Excel functions operate, let’s look at how to achieve this using a few data inputs in Excel:
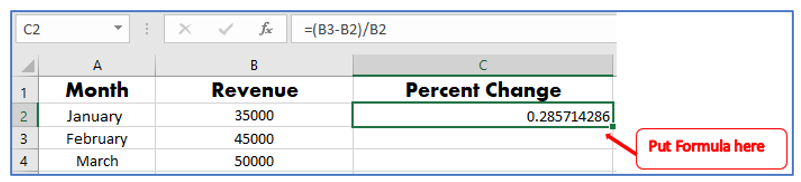
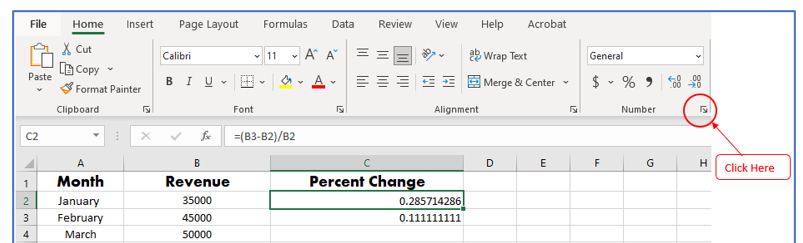
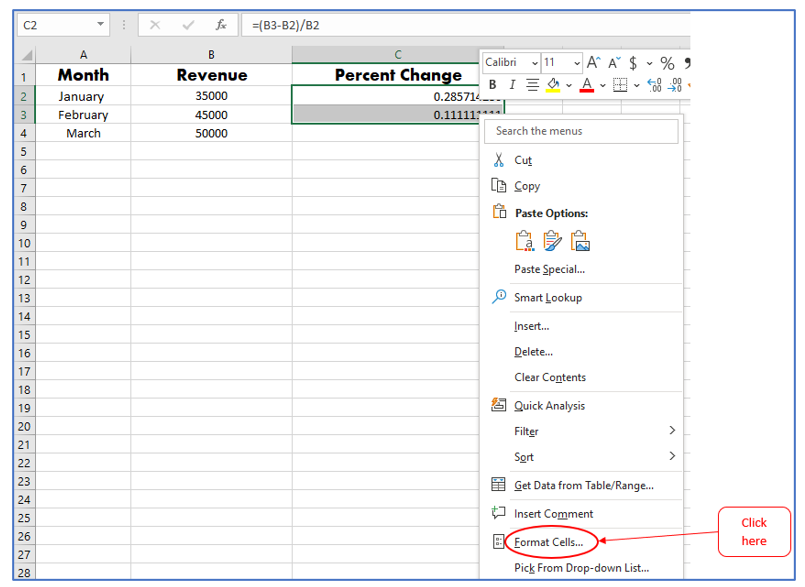
Percent Change =(B3-B2)/B2
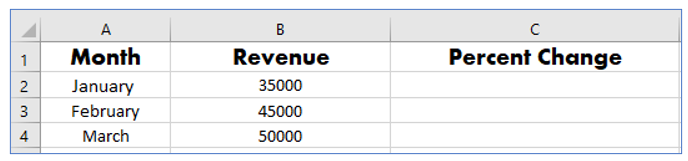
Step-1: Prepare a data table with information outlined below:
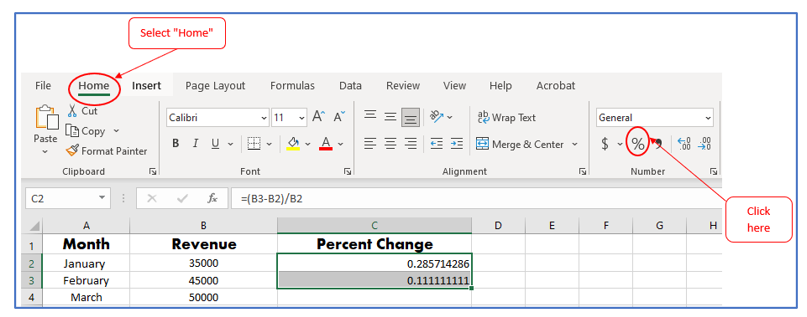
Step-2: Select cell C2 and type the formula =(B3-B2)/B2 into the Formula Bar. Then press the Enter key.
Step-3: To format the result cell as a percentage, keep selecting it and then click the Percent Style button in the Number group under the home tab.
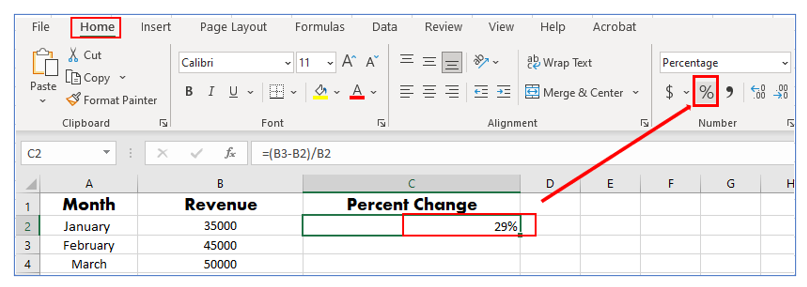
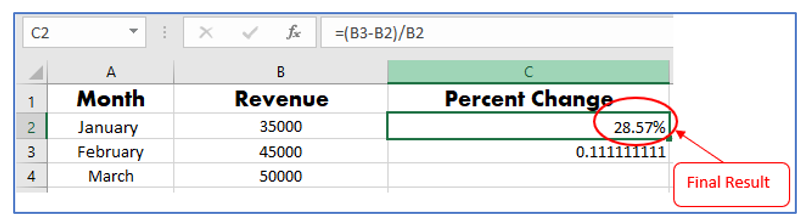
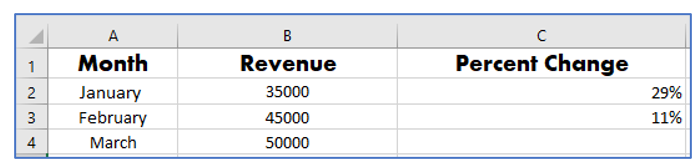
This time, the % difference between the two figures is generated.
How to show percentages in Excel?
Option 1:
- Choose a cell (s).
- Use the keyboard shortcut Control + Shift +% (hold down the Control and Shift keys while pressing the % key).
Option 2:
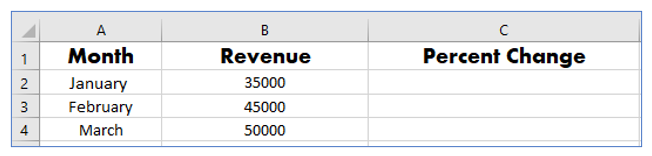
Step-1: Prepare a data table with information outlined below:
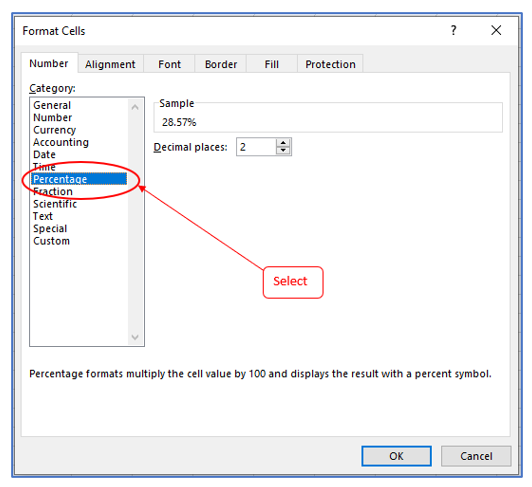
Step-2: Click the icon next to Number on the Home tab’s Number group to open the Format Cells dialog box.
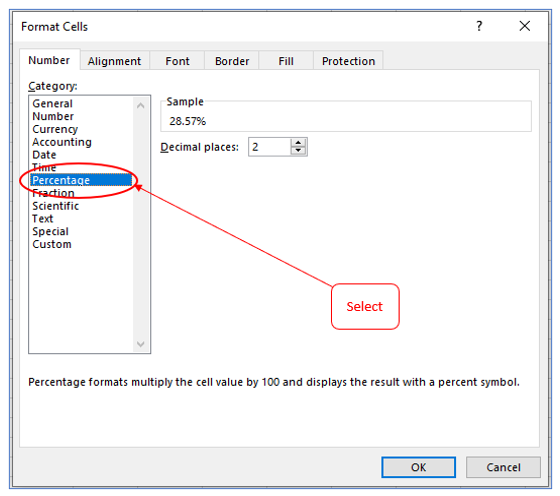
Step-3: Select ‘Percentage’ in the Category list of the Format Cells dialog box.
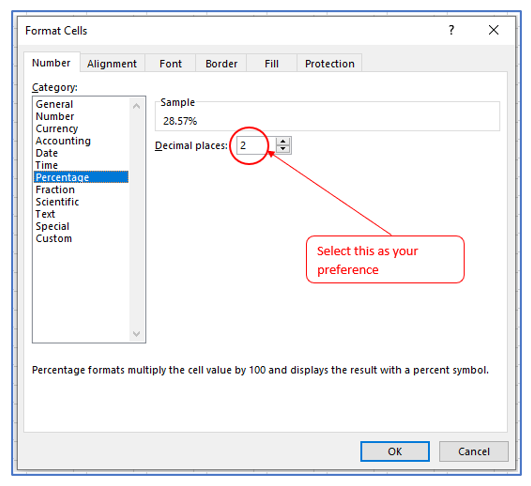
Step-4: Enter the number of decimal places you want to show in the Decimal places box. For example, to see 28.57% rather than 28%, put 2 in the Decimal places box.
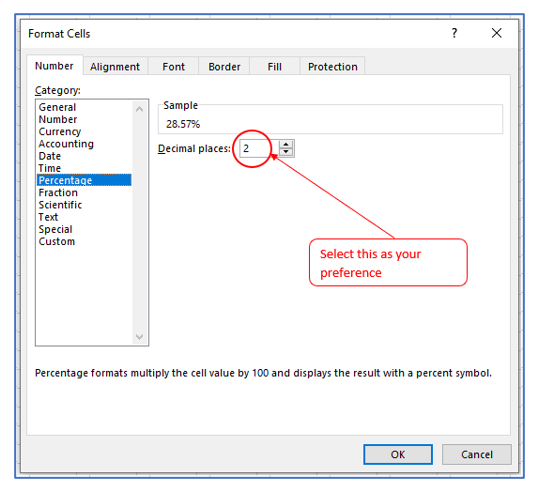
Step-5: Click ok, Result outlined in below:
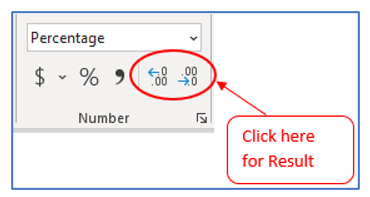
Alternative: You may also change the number of decimal places displayed by clicking the Increase Decimal or Decrease Decimal icons on the ribbon (Home tab > Number group):
Option 3:
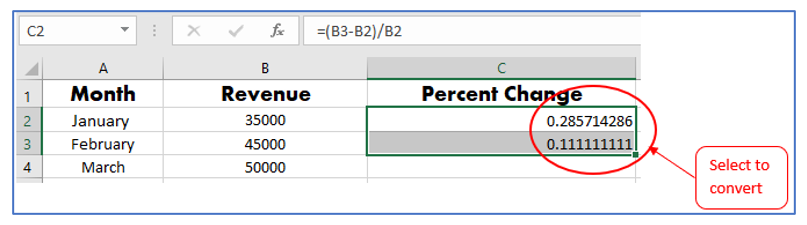
Step-1: Select the cells which needs to convert to percentages.

Step-2: In the top left corner of your screen, select the “Home” tab. To convert all of the numbers in your specified cell range to percentages, click the “%” button from the ‘Number’ Group.
Result outlined in below:
Option 4:
Step-1: Select the cells which needs to convert to percentages.
Step-2: Right-click on the cells and select “Format Cells” from the drop-down menu that appears.
Step-3: When the “Format Cells” dialog box opens, select the “Number” tab.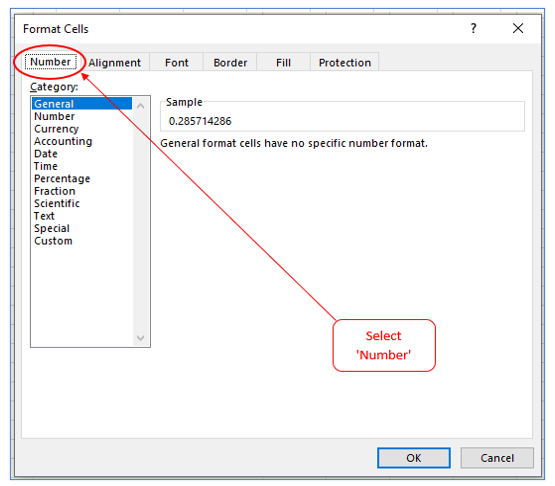
Step-4: Choose “Percentage” from the “Category” drop-down menu on the left side of the dialog box.
Step-5: Select the number of decimal points to include, then click “OK” to convert all of the numbers in your specified cell range to percentages.
Result outlined in below:
How to determine the value after an increase or decrease in percentage?
We learned how to determine the percentage difference between two values. Now, we’ll explore at how to raise the total by a given percentage.
To increase an amount by a percentage, use this formula:
= Amount * (1 + %)
To decrease an amount by a percentage:
= Amount * (1 – %)
Follow the below process to Determine the value after an increase in percentage in Excel:
Step-1: Prepare a data table with information outlined below:
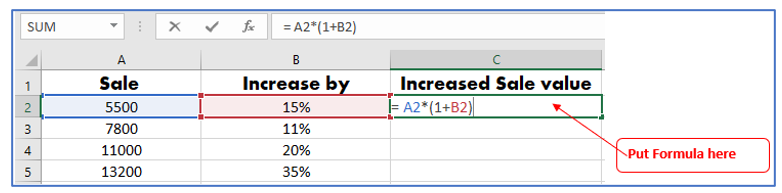
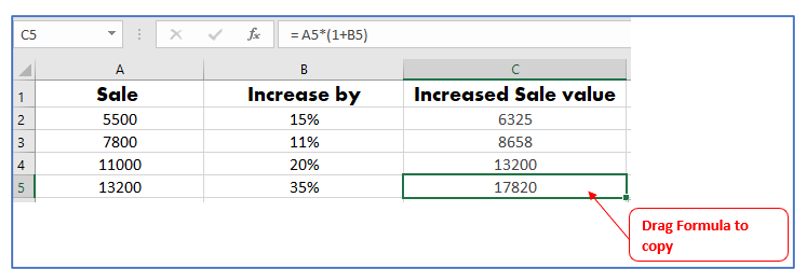
Step-2: Select cell C2 if A2 represented your current Sale and B2 represented the percentage you wanted to increase or decrease by. Put the formula and then press enter:
= A2*(1+B2)
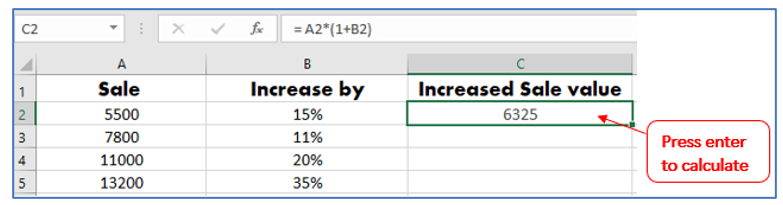
Step-3: Position the cursor to the lower right corner of the cell C2, wait until it turns into the plus sign, and then double-click the plus and drag below to copy the formula to C3-C5, outlined below:
Below is the process to determine the value after a decrease in percentage in Excel:
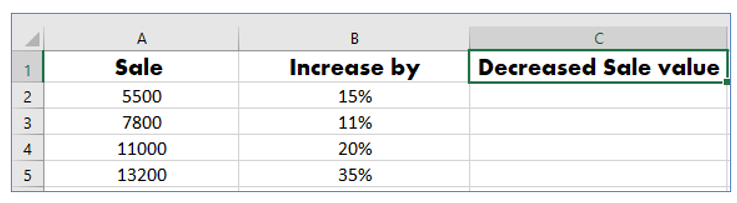
Step-1: Prepare a data table with information outlined below:
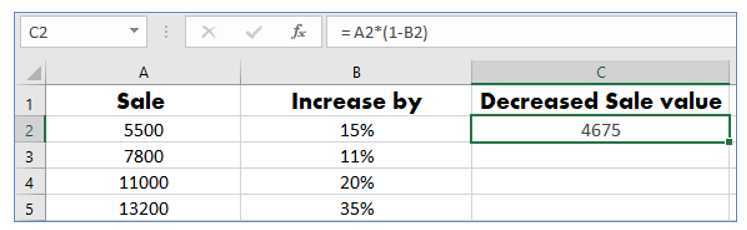
Step-2: Select cell C2 if A2 represented your current Sale and B2 represented the percentage you wanted to increase or decrease by. Put the formula and then press enter:
= A2*(1-B2)
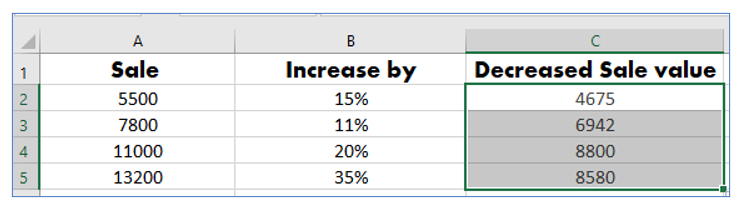
Step-3: Position the cursor to the lower right corner of the cell C2, wait until it turns into the plus sign, and then double-click the plus and drag below to copy the formula to C3-C5, outlined below:
Option 2:
You can use the below formula if you don’t want to copy-pasting the formula:
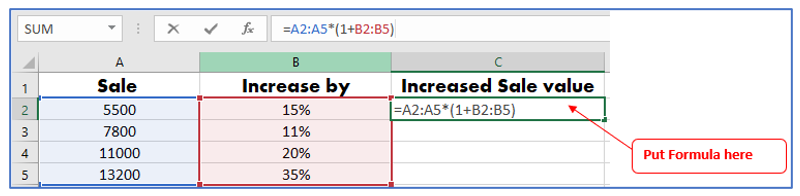
=A2:A5*(1+B2:B5) (For Increase)
=A2:A5*(1-B2:B5) (For Decrease)
Process:
- Select the cell C-2
- Put the formula
- Press Enter
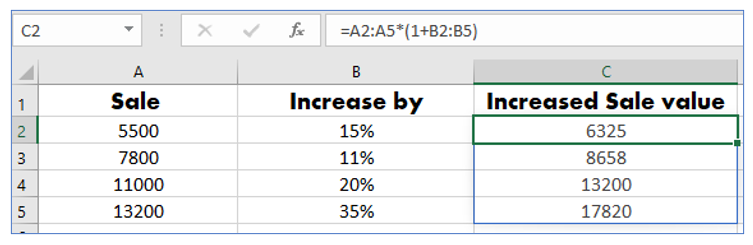
Result outlined below:
How to calculate increase / decrease of an entire column with specific percentage value?
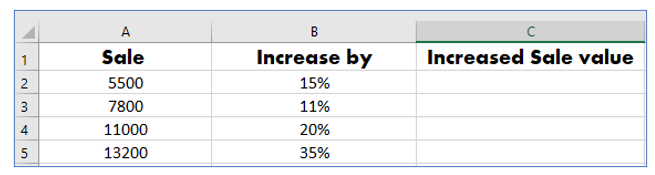
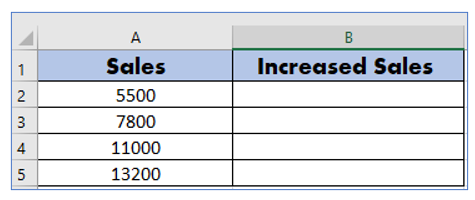
Suppose, you have a column of numbers that you want to increase or reduce by a certain percent. Here in the below screenshot, we can see some sales value in the column A, which I want to increase by 15%.
Follow the below process to determine the increase of an entire column with specific percentage value:
Step-1: prepare a table with formula, outlined below:
Step-2: Set a formula in cell B-2, outlined below:
The formula will be this:
=A2*(1+15%)
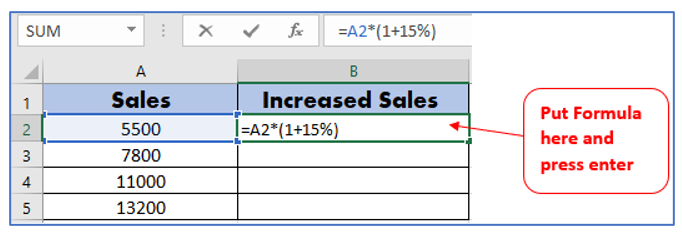
Step-3: Drag the cell below to copy the formula. Result outlined below: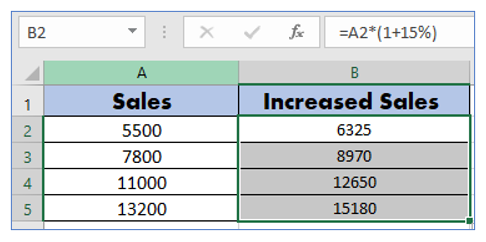
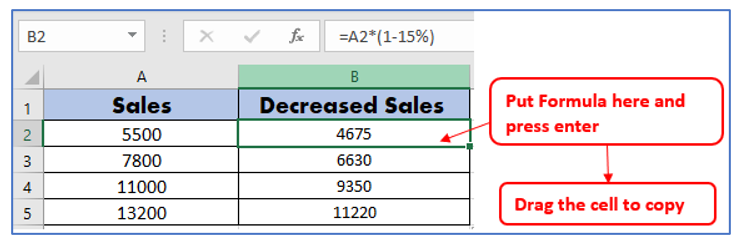
For decrease:
And for 15% decrease the formula will be:
=A2*(1-15%)
Process:
- Select the cell B-2
- Put the formula
- Press Enter
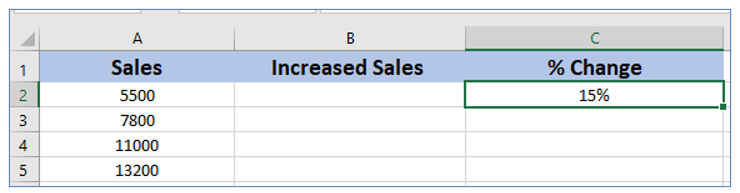
How to calculate increase / decrease of an entire column with specific cell value?
Using the cell reference rather than hardcoding the value into the formula is an option if you know the value by which you want to increase or decrease the entire column in a cell.
Process:
Step-1: Prepare a table with Specific Cell Value, outlined below:
Step-2: Set a formula in cell B-2, outlined below:
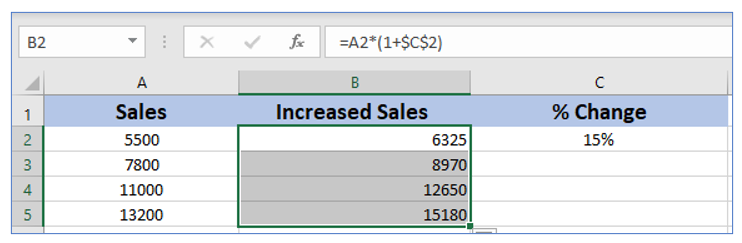
For instance, if cell C2 has the % value, you may use the formula below to determine the new value after the percentage change:
=A2*(1+$C$2)
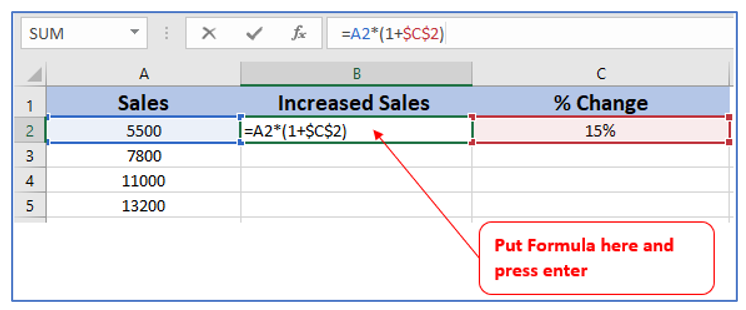
Step-3: Now drag the upper cell below and thus you will get the remaining values. Result outlined below:
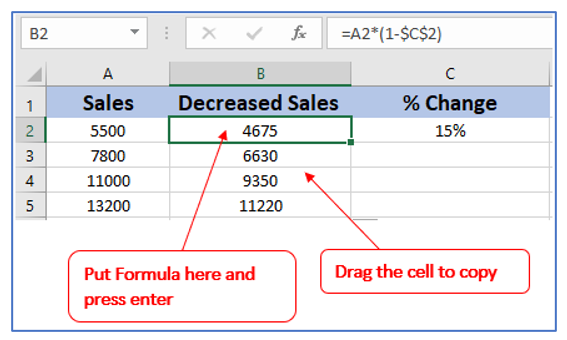
For decrease:
And for 15% decrease the formula will be:
=A2*(1-$C$2)
Process:
- Select the cell B-2
- Put the formula
- Press Enter
Application of Calculate Percentage Change in Excel
- Financial Analysis: Determine the percentage change in revenue, profit, or expenses over time to assess financial health and performance trends of a business.
- Sales Performance Tracking: Measure the percentage change in sales figures between different time periods to evaluate sales strategies and market trends.
- Inventory Management: Calculate the percentage change in inventory levels to understand stock fluctuations and optimize inventory control.
- Budgeting and Forecasting: Assess how different budgetary items or forecasted figures vary from actual expenses or revenues to manage finances better.
- Market Analysis: Determine the percentage change in market share, product prices, or customer base to analyze market dynamics and business growth.
- Employee Performance Reviews: Evaluate the percentage change in productivity metrics or key performance indicators (KPIs) for employee assessments and development plans.
You may be interested:
