Calculate Correlation Coefficient in Excel to unlock insightful data relationships and strengthen your analytical capabilities. This function allows you to measure and interpret the degree of association between two variables, facilitating informed decision-making and hypothesis testing. By integrating this statistical tool into your Excel skill set, you can enhance your ability to identify trends, predict outcomes, and understand complex datasets. Embrace the power of the correlation coefficient to elevate your data analysis and bring clarity to the interconnectedness of variables in your studies or business scenarios.
This Topic Covers:
- What is the Correlation Coefficient?
- How to Calculate Correlation Coefficient in Excel Using CORREL Formula?
- How to Calculate Correlation Coefficient in Excel Using the Data Analysis Toolpak?
- Enabling the Data Analysis Toolpak
- Calculating the Correlation Coefficient
- How to Calculate Correlation Coefficient in Excel Using PEARSON Function
1. What is the Correlation Coefficient?
In Microsoft Excel, a correlation coefficient (a value between -1 and +1) is a number or value that reveals the degree to which two data series are connected or related to one another. To determine the correlation coefficient between two variables, we can use Excel’s CORREL function or the Analysis Toolpak add-in, or the PEARSON function. A complete positive connection is indicated by a correlation value of +1 and a complete negative connection is indicated by a correlation value of -1. A correlation coefficient value near 0 indicates no correlation.
2. How to Calculate Correlation Coefficient in Excel Using CORREL Formula?
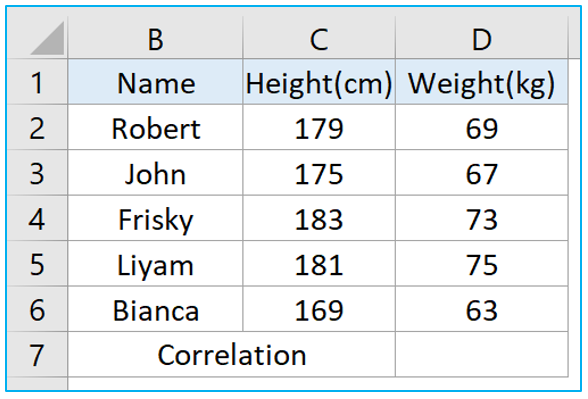
Let’s say you want to calculate the correlation coefficient between the height and weight of 5 persons using the data set given below.
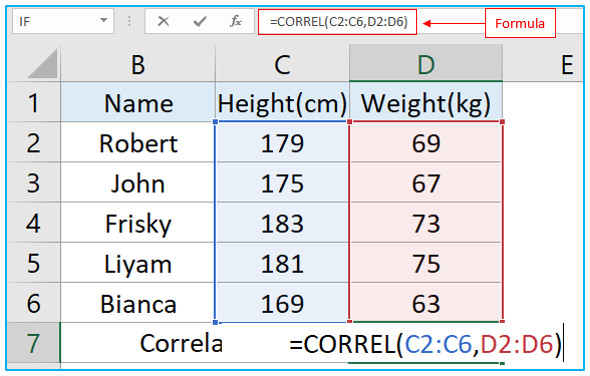
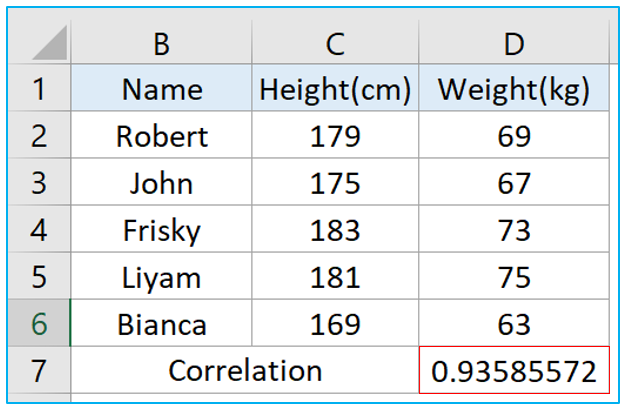
Step 1: Insert the following formula in cell D7 after selecting it and hit Enter key.
=CORREL(C2:C6,D2:D6)
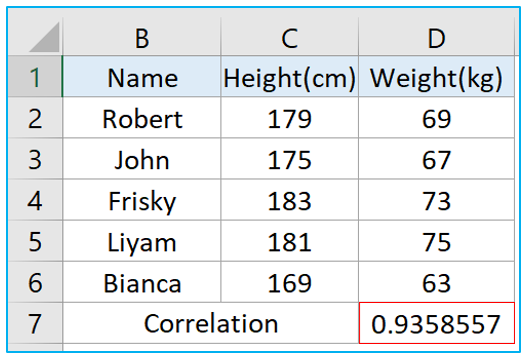
Step 2: When you press enter, Excel immediately does all necessary calculations and provides you with a single correlation coefficient value. In our example, that value is over 0.9, which indicates that there is a strong positive correlation.
3. How to Calculate Correlation Coefficient in Excel Using the Data Analysis Toolpak?
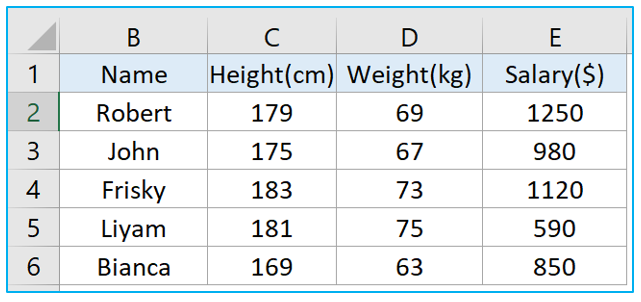
Using Excel’s data analysis tool pack is another option to think about if you need to calculate the correlation coefficient of multiple series like the picture given below.
3.1 Enabling the Data Analysis Toolpak
Step 1: Right click anywhere on the ribbons and select Customize The Ribbon.

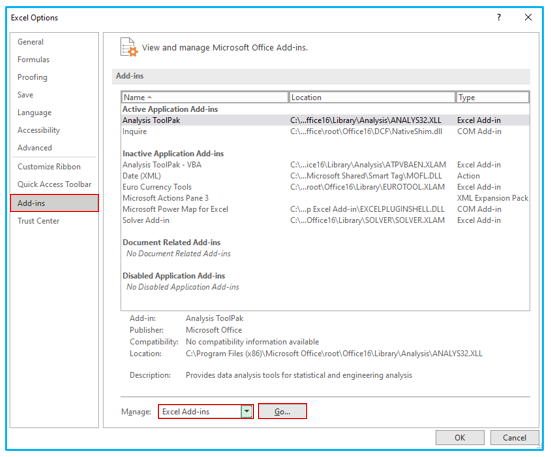
Step 2: From Excel Options dialogue box, go to Add-ins tab and from Manage box select Excel Add-ins. Click on Go.
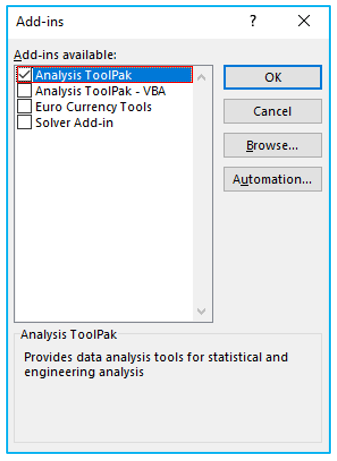
Step 3: Check Analysis ToolPak box and click OK.
3.2 Calculating the Correlation Coefficient
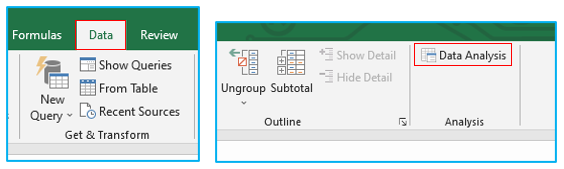
Step 1: Go to Data>>Data Analysis.
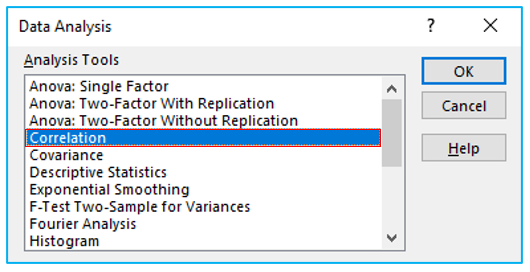
Step 2: From the Data Analysis dialogue box select Correlation and click OK.
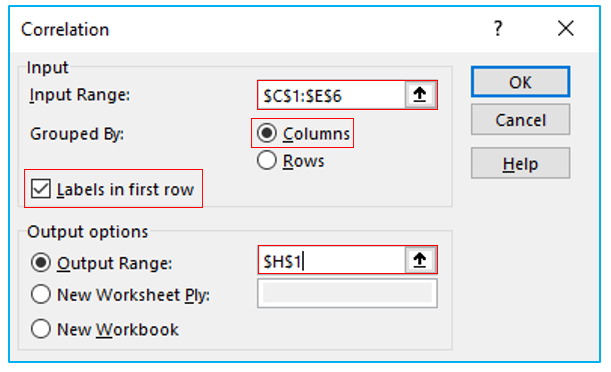
Step 3: Choose the three series, including the headers, for the Input Range. Select Columns from Grouped By category, make sure Labels in first row is checked and finally choose where you want the resulting table inside Output Range box. Now click OK.
Step 4: When you click OK, Excel will calculate the correlation coefficient for each series and will provide you with a table like the one below. This is a static table so any changes made inside the series won’t be updated in this table, you have to repeat all the steps again to generate a new table for the changed or updated series.
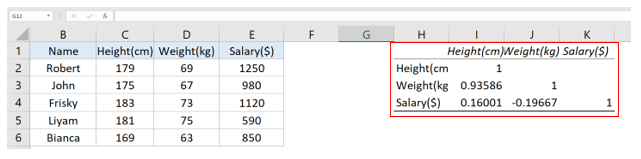
Here, Height and Weight are positively correlated (0.94) but Weight and Salary (0.16) and Height and Salary (-0.19) are not correlated
- How to Calculate Correlation Coefficient in Excel Using PEARSON Function?
Step 1: Instead of CORRELL function you can also use the PEARSON function to calculate correlation coefficient in Excel like the picture below.
=PEARSON(C2:C6,D2:D6)
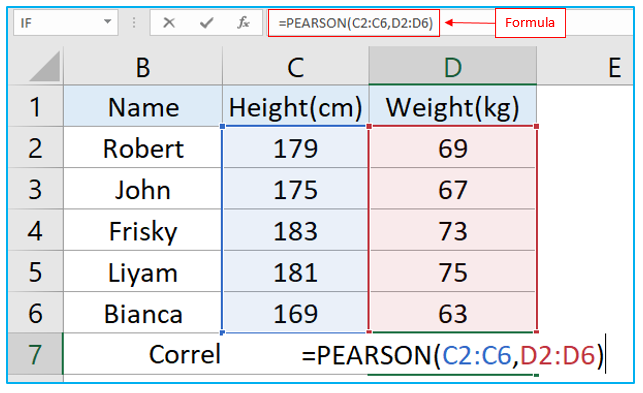
Step 2: Once you enter the formula and hit Enter key you will see the correlation status between the two series you input inside the formula.
Application of Calculate Correlation Coefficient in Excel
- Market Analysis: Use the correlation coefficient to assess the relationship between different financial indicators or stocks, aiding in investment decisions and portfolio management.
- Customer Behavior Study: Calculate the correlation between different customer behaviors, such as purchase frequency and spending amount, to tailor marketing strategies effectively.
- Product Performance Evaluation: Analyze the correlation between marketing spend and product sales to evaluate the effectiveness of advertising campaigns and budget allocation.
- Risk Management: Determine the correlation between various risk factors and project outcomes to identify potential risk drivers and inform mitigation strategies.
- Employee Performance Assessment: Calculate the correlation between employee satisfaction scores and their productivity levels to understand the impact of job satisfaction on performance.
- Healthcare Research: Use correlation analysis to explore relationships between different health indicators, such as exercise frequency and blood pressure levels, contributing to medical studies and public health policies.
For ready-to-use Dashboard Templates:
