Confidence Interval in Excel provides a valuable statistical tool for estimating population parameters based on sample data. By calculating the range within which the true population parameter is likely to fall with a specified level of confidence, users can make informed decisions and draw reliable conclusions from their data. Excel offers various functions and tools to compute confidence intervals for means, proportions, and other parameters, empowering users to conduct rigorous statistical analysis directly within the familiar spreadsheet environment. Whether you’re conducting scientific research, analyzing survey data, or performing quality control tests, Confidence Interval in Excel equips you with the capability to assess the precision and reliability of your findings. Embracing the use of Confidence Interval in Excel enhances the accuracy and credibility of your statistical analyses, enabling you to make data-driven decisions with confidence.
This Tutorial Covers:
- What Is Confidence Interval
- 4 Effective Excel Techniques for Calculating Confidence Interval
- How to Calculate Confidence Interval in Excel using the Conventional Function
- How to Calculate Confidence Interval in Excel using CONFIDENCE Function
- Utilizing CONFIDENCE.T Function to calculate Confidence Interval in Excel
- How to Calculate Confidence Interval by using Data Analysis Tool in Excel
- Things to Remember
1.What Is Confidence Interval?
A confidence interval is a statistical measure that provides a range of values within which the true population parameter is likely to lie, with a certain level of confidence. It is a useful tool for estimating population characteristics based on a sample. Confidence intervals are associated with a degree of certainty and uncertainty in the estimation.
There are upper and lower confidence levels that define the range. A narrower interval indicates a more precise prediction, while a wider interval suggests greater uncertainty. To calculate the confidence interval, the standard error is often used. A smaller error leads to a better prediction.
For example, when developing an app for a large population, it is impractical to obtain feedback from every individual. By taking a sample and calculating the confidence interval, we can identify which specific group of individuals, based on age or other factors, are likely to be satisfied with the app. This allows us to target those individuals for feedback and make assumptions about the overall population.
The advantage of using confidence intervals is that they are less time-consuming than hypothesis testing and easier to interpret. They provide valuable insights into the estimated parameter without requiring extensive statistical analysis.
To calculate the confidence interval, the following formula can be used:
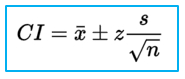
Where:
CI = Confidence Interval for Infinite Population
X̄ = Sample Mean
Z = Z Value for Confidence Level
S = Sample Standard Deviation
n = Number of Elements in a Sample
2. 4 Effective Excel Techniques for Calculating Confidence Interval:
In this article, we will explore four different effective methods to calculate confidence intervals in Excel. These methods make use of various Excel functions and the data analysis tool. Each method is user-friendly and provides valuable insights. By following these methods, you will gain a comprehensive understanding of how to calculate confidence intervals using Excel.
-
How to Calculate Confidence Interval in Excel using the Conventional Function?
In our first method, we will use the conventional formula to calculate the confidence interval. This method involves determining the standard deviation, the z-value for the desired confidence level, and the sample size.
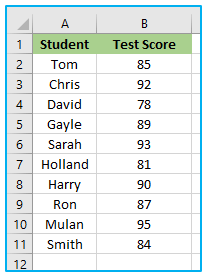
Suppose you have a dataset like the one below and you want to calculate a confidence interval value.
How to use conventional formula to determine confidence interval in Excel is shown below:
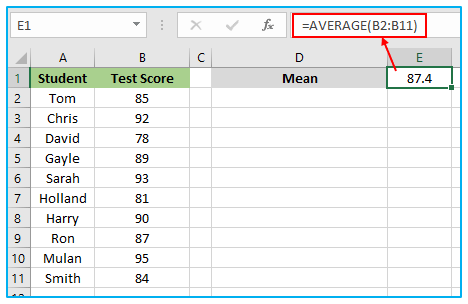
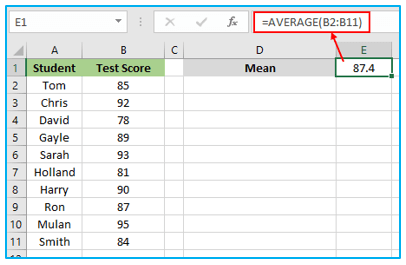
Step 1: The AVERAGE function must first be used to get the sample’s mean value.
Apply the formula shown below in cell E1 for getting this.
=AVERAGE(B2:B11)
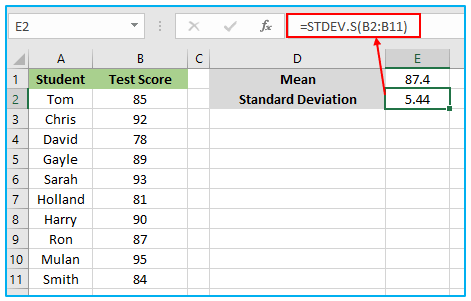
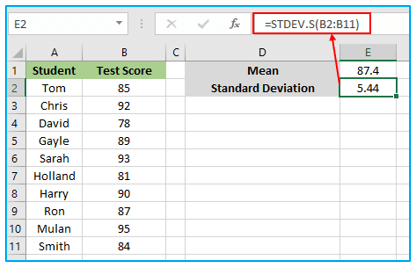
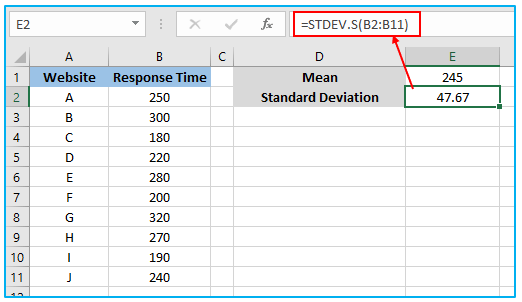
Step 2: After that, we must use the STDEV.S function to determine the standard deviation.
Apply the formula below to cell E2 to obtain this.
=STDEV.S(B2:B11)
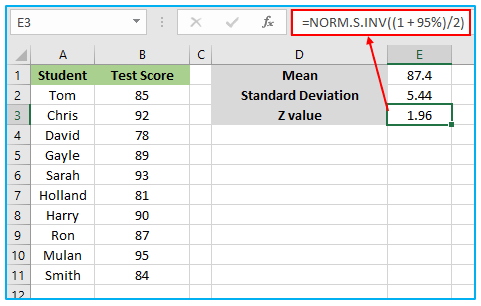
Step 3: The z value for the confidence level needs to be determined next. Apply the following formula to cell E3 for a 95% confidence level.
=NORM.S.INV((1 + 95%)/2)
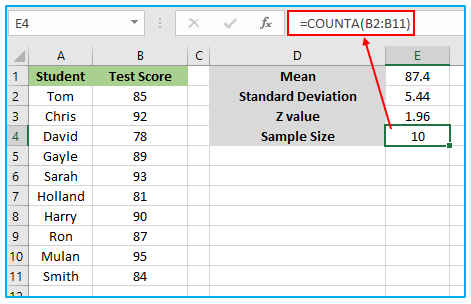
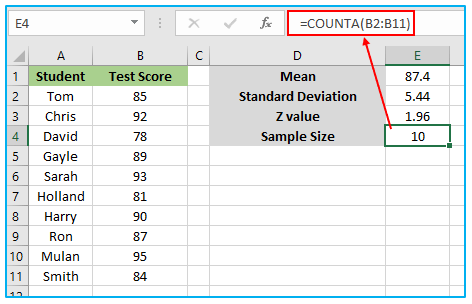
Step 4: After that, use the formula below in cell E4 to get the sample size.
=COUNTA(B2:B11)
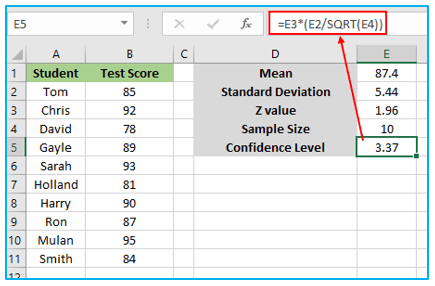
Step 5: Then, we’ll concentrate on figuring out how to calculate the confidence value using the conventional formula.
Put the following formula into cell E5.
=E3*(E2/SQRT(E4))
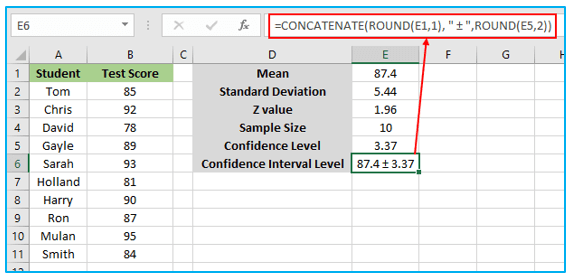
Step 6: The confidence value must then be added to or subtracted from the mean value to obtain the value of the confidence interval. Calculate the lower confidence value by subtracting the confidence value from the mean value and adding the confidence value to get the higher confidence interval.
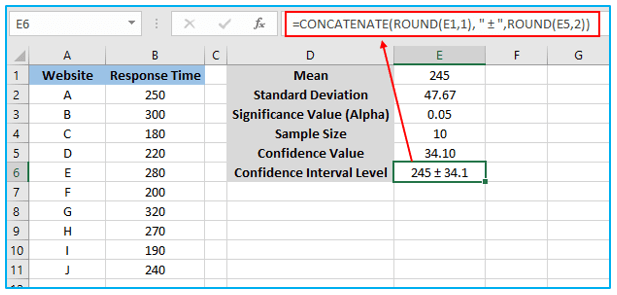
In cell E6, use the following formula.
=CONCATENATE(ROUND(E1,1), ” ± “,ROUND(E5,2))
-
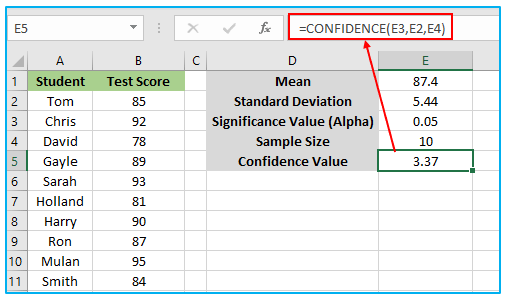
How to Calculate Confidence Interval in Excel using CONFIDENCE Function?
The CONFIDENCE function is the foundation of our next approach. To obtain the necessary confidence value using this method, we will compute the mean, standard deviation, and alpha.
Procedure of confidence interval calculation in Excel using CONFIDENCE function are described below:
Step 1: The AVERAGE function must first be used to get the sample’s mean value.
Apply the formula shown below in cell E1 for getting this.
=AVERAGE(B2:B11)
Step 2: After that, we must use the STDEV.S function to determine the standard deviation.
Apply the formula below to cell E2 to obtain this.
=STDEV.S(B2:B11)
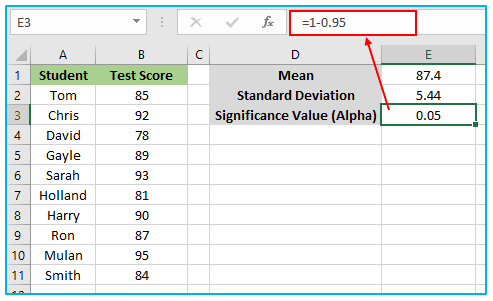
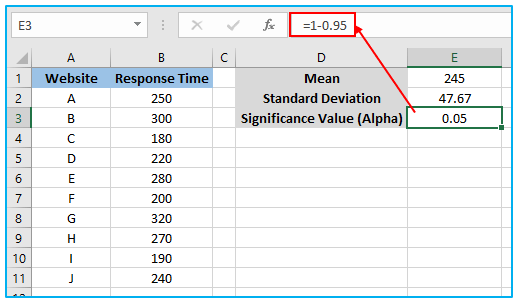
Step 3: Then, using the 95% confidence level, you have to calculate alpha. A 95% confidence level must be subtracted from 1 to obtain alpha.
Use the following formula in cell E3.
=1-0.95
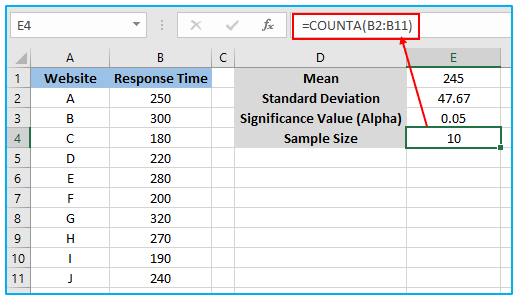
Step 4: After that, use the formula below in cell E4 to get the sample size.
=COUNTA(B2:B11)
Step 5: Then, we’ll concentrate on applying the CONFIDENCE formula to determine the confidence value.
Put the following formula into cell E5.
=CONFIDENCE(E3,E2,E4)
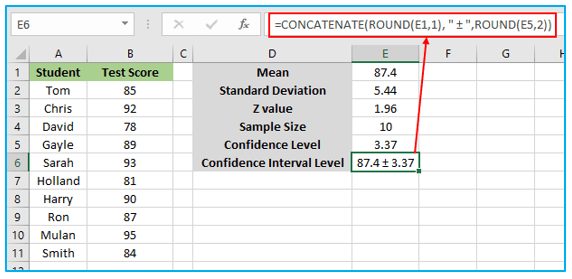
Step 6: The confidence value must then be added to or subtracted from the mean value to obtain the value of the confidence interval. Calculate the lower confidence value by subtracting the confidence value from the mean value and adding the confidence value to get the higher confidence interval.
In cell E6, use the following formula.
=CONCATENATE(ROUND(E1,1), ” ± “,ROUND(E5,2))
-
Utilizing CONFIDENCE.T Function to calculate Confidence Interval in Excel?
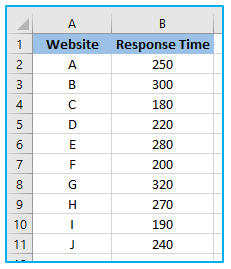
Utilizing the CONFIDENCE.T function is the foundation of our third approach. Using the CONFIDENCE.T function, we will compute the mean, standard deviation, and alpha to arrive at the appropriate confidence value in this way. We use a dataset of a few websites’ response times to demonstrate the method.
The steps to calculate confidence interval in Excel using CONFIDENCE.T function are described below:
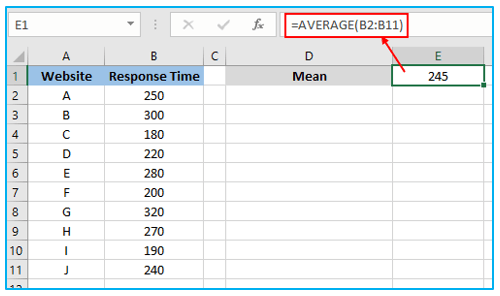
Step 1: The AVERAGE function must first be used to get the sample’s mean value.
Apply the formula shown below in cell E1 for getting this.
=AVERAGE(B2:B11)
Step 2: After that, we must use the STDEV.S function to determine the standard deviation.
Apply the formula below to cell E2 to obtain this.
=STDEV.S(B2:B11)
Step 3: Then, using the 95% confidence level, you have to calculate alpha. A 95% confidence level must be subtracted from 1 to obtain alpha.
Use the following formula in cell E3.
=1-0.95
Step 4: After that, use the formula below in cell E4 to get the sample size.
=COUNTA(B2:B11)
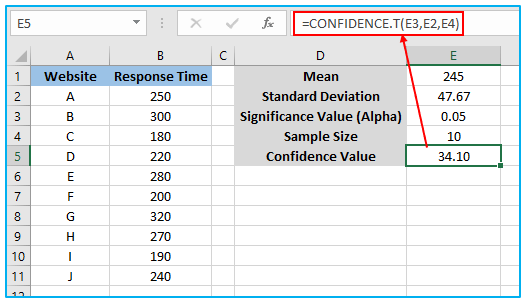
Step 5: Then, we’ll concentrate on applying the CONFIDENCE.T formula to determine the confidence value.
Put the following formula into cell E5.
=CONFIDENCE.T(E3,E2,E4)
Step 6: The confidence value must then be added to or subtracted from the mean value to obtain the value of the confidence interval. Calculate the lower confidence value by subtracting the confidence value from the mean value and adding the confidence value to get the higher confidence interval.
In cell E6, use the following formula.
=CONCATENATE(ROUND(E1,1), ” ± “,ROUND(E5,2))
-
How to Calculate Confidence Interval by using Data Analysis Tool in Excel?
The data analysis tool is the foundation of our final approach. We must activate the data analysis tool from Excel Add-ins in order to demonstrate this strategy. We’ll be able to use this tool after that. By utilizing the dataset listed below, this tool will assist us in obtaining the crucial result.

The steps to calculate confidence interval in Excel using data analysis tool are described below:
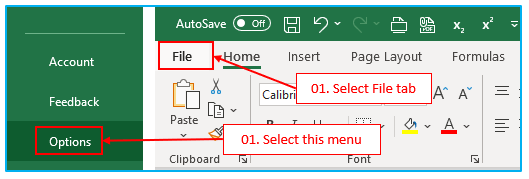
Step 1: Click on the “File” tab located in the upper-left corner of the Excel window.
In the backstage view, select “Options” from the left-hand menu.
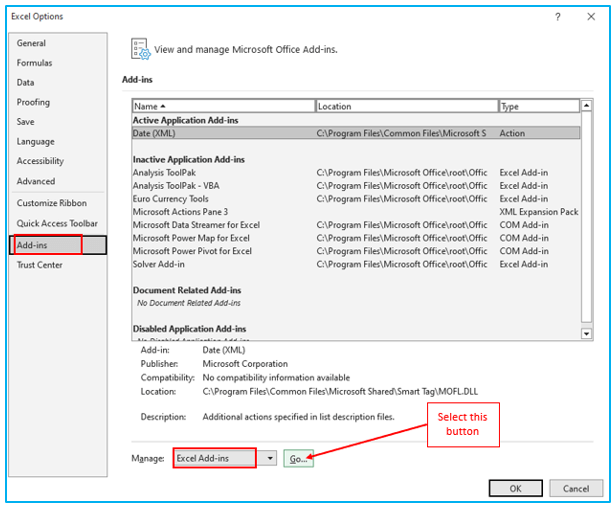
Step 2: The “Excel Options” dialog box will therefore show up. Select “Add-ins” next.
Next, choose “Excel Add-ins” from the “Manage” group. After that, select “Go”.
Step 3: It will display the “Add-ins” dialog box. Select “Analysis Toolpak” and “Solver Add-ins” at that point. Click “OK” to continue.
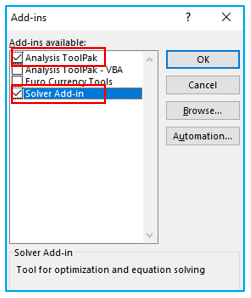
As a result, you will notice the “Data Analysis” and “Solver” options in the “Data” tab’s “Analyze” group.
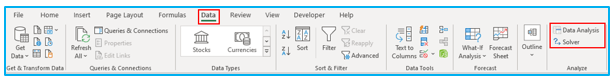
Step 4: To use the data analysis process, select the “Data” tab from the ribbon.
Select “Data Analysis” from the “Analyze” group after that.

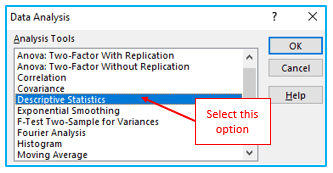
Step 5: The “Data Analysis” dialog box will then show up. Choose “Descriptive Statistics” from there. Click “OK” one again.
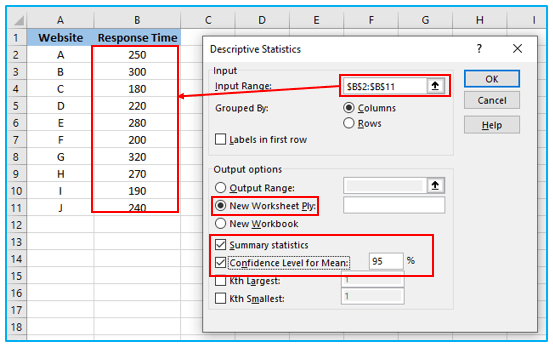
Step 6: After selecting the “Descriptive Statistics” dialog box, proceed to choose the desired “Input Range” from your dataset. Next, opt for the “New Worksheet Ply” option under the “Output options” setting. Once done, ensure that both the “Summary statistics” and “Confidence Level for Mean” options are checked. To finish the process, click “OK” at the end.
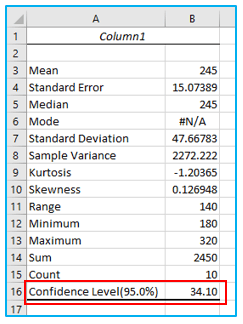
The resulting summary, obtained from the data analysis tool’s calculation of the confidence value, is displayed in the provided image below.
3. Things to Remember:
Please note that in recent versions of Excel, the CONFIDENCE function has been replaced by the T function. It’s important to use numeric values when using these functions; otherwise, an error will occur. The confidence interval in Excel can be calculated by adding or subtracting the confidence value from the mean value.
Application of Confidence Interval in Excel
- Population Parameter Estimation: Confidence intervals in Excel are used to estimate population parameters, such as the mean or proportion, based on sample data.
- Statistical Inference: They provide a range of values within which the true population parameter is likely to lie with a specified level of confidence, aiding in statistical inference.
- Quality Control: Confidence intervals help assess the reliability of process or product quality by determining the range of values for key parameters.
- Market Research: Researchers use confidence intervals to estimate population characteristics, such as customer preferences or market trends, based on survey data.
- Clinical Trials: Confidence intervals are essential in clinical trials to estimate treatment effects and assess the precision of the results.
- Financial Analysis: Analysts use confidence intervals to estimate financial parameters, such as return on investment or stock price volatility, based on historical data.
For ready-to-use Dashboard Templates:
