The DURATION function in Excel serves as a powerful tool for financial analysts, investors, and professionals alike. By accurately calculating the Macaulay duration of a bond, it provides crucial insights into the bond’s sensitivity to changes in interest rates and helps in making informed investment decisions. With its ability to handle various bond types and coupon frequencies, the DURATION function offers versatility and precision in financial analysis. Whether assessing portfolio risk, optimizing asset allocation, or evaluating fixed-income securities, incorporating the DURATION function in Excel enhances analytical capabilities and fosters better decision-making.
- What is the duration function in Excel?
- Why do you need to duration function in Excel?
- How to use the DURATION function in Excel?
- Duration Syntax.
- Duration Example.
- Important Things to Know about Duration.
1. What is the duration function in Excel?
The DURATION function is classified as an Excel financial function. Useful for calculating Macaulay periods. This function computes the life of a $100 face-value security that pays periodic interest. DURATION is often used by portfolio managers who use vaccination strategies. Additionally, this feature is useful for financial modeling, especially for predicting future cash flows from investments.
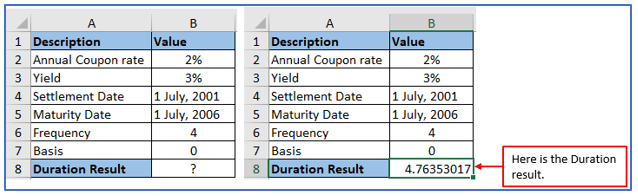
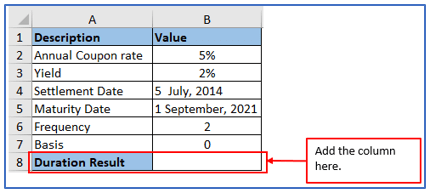
The image below displays the description in column A and the value in a second column, where B is the actual value. Calculated the output by applying Excel’s DURATION function.
2. Why do you need to duration function in Excel?
Financial statements include the continuance function before determining the Macaulay run of a security. Macaulay duration measures the weighted average time it takes to receive cash flows from a bond. It takes into account both the timing and cash flow. For a quick overview of the DURATION function, here’s what it means in finance.
Interest Rate Sensitivity: Macaulay duration helps investors and analysts evaluate a bond’s interest rate sensitivity. Bonds with longer maturities are more sensitive to changes in interest rates.
Fixed Income Portfolio Management: For portfolio managers managing bond portfolios, it is important to understand the Macaulay duration of individual bonds or the entire portfolio.
Supports decision-making based on interest rate forecasting and risk management.
Immunization Strategies: Investors can use Macaulay duration in their vaccination strategy to match asset maturities with liability maturities and minimize interest rate risk.
Risk Assessment: Macaulay Duration is a measure of the potential impact of interest rate changes on the value of a bond or bond portfolio.
It helps investors assess the risks associated with interest rate fluctuations.
3. How to use the DURATION function in Excel?
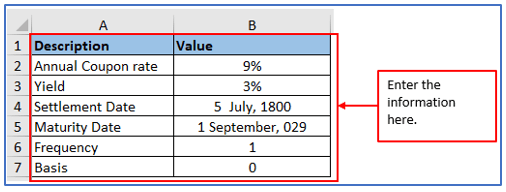
Step 1: You have to make a dataset first.
Placed the information here.
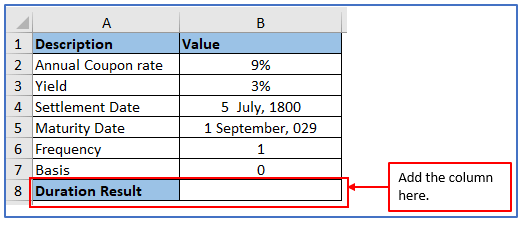
Step 2: Add a column in A8 and B8 to get the Duration value there.
A column has been added you can see it below.
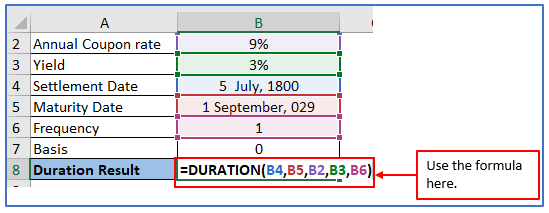
Step 3: Now, use the formula: =DURATION(B4,B5,B2,B3,B6) or =DURATION(B4,B5,9%,3%,1)
Applied the formula here.
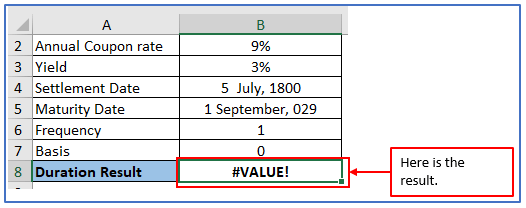
Step 4: Press the Enter button the Duration value will comes out.
The result is “#VALUE! Because the argument should be number-independent, leading to an error. The data is not accurate Excel date.
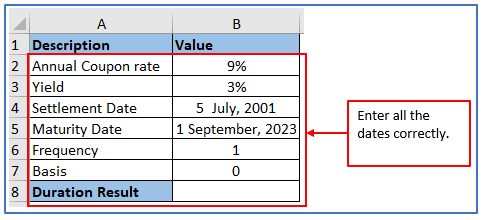
Step 5: The above(Step 4) result is #VALUE! because the data is not accurate Excel date. Enter the dates correctly as shown below.
Entered all the data here.
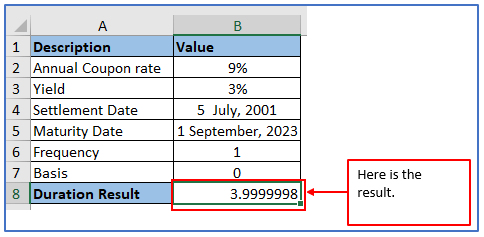
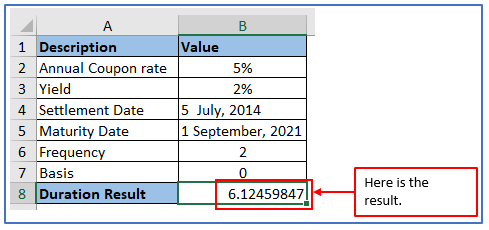
Step 6: Now, use the same formula from Step 3, the formula: =DURATION(B4,B5,B2,B3,B6) or =DURATION(B4,B5,9%,3%,1) and press enter button.
Here is the result.
4. Duration Syntax.
Duration syntax is: DURATION(settlement, maturity, coupon, yld, frequency, [basis])
Where:
Settlement (required argument) – This is the settlement date of the security or the date the coupon was purchased.
Maturity (required argument) – The maturity date of a security or the date on which a coupon expires.
Coupon (required argument) – This is the coupon rate of the security.
Yield (required argument) – Annual return on securities.
Frequency (required argument) – This is the number of coupon payments per year. For annual payments, frequency = 1. For half a year, frequency = 2. and for quarterly, frequency = 4.
Basis (optional argument) – This is the number of coupon payments per year.
| Basis | Day Count Basis |
| 0 or omitted | US(NASD) 30/360 |
| 1 | Actual/actual |
| 2 | Actual/360 |
| 3 | Actual/365 |
| 4 | European 30/360 |
5. Duration Example.
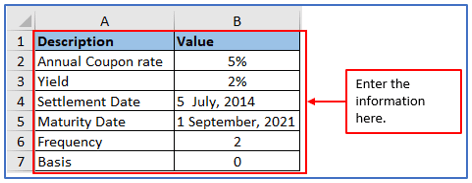
Step 1: First create a dataset like the image.
Entered the information here.
Step 2: Add a column in A8 and B8 to get the Duration value there.
A column has been added you can see it below.
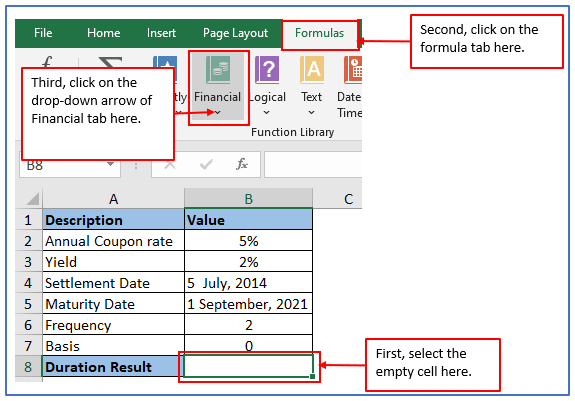
Step 3: Select blank cells for output then Select the Formulas tab. Click the Financials dropdown list.
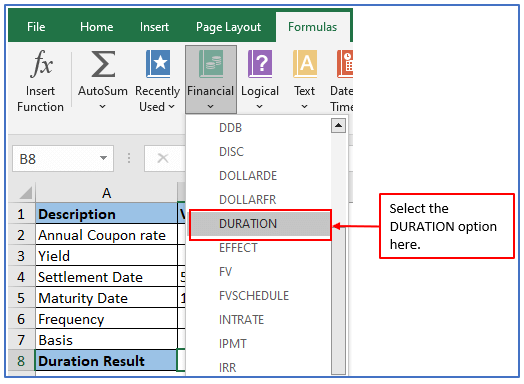
Step 4: After clicking on the Financials dropdown list, you will get the options. Select the “DURATION” function as shown below.
Step 5: After pressing on DURATION option, you will get a box as shown below. Placed all the data’s there and click on OK.
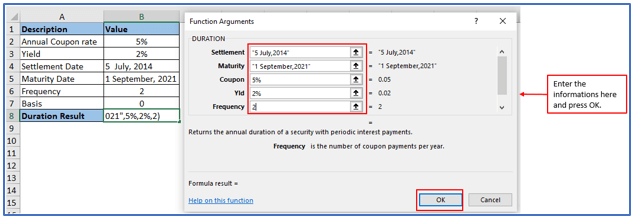
Step 6: While clicking on Ok, the Duration result will be outlined below.
Here is the Duration Value.
6. Important Things to Know about Duration.
- The “#NUM!
” Error occurs when the settlement date matches the due date. The cell value in an argument is invalid “.
- “#VALUE!
” An error occurs if the argument is not a number. The data provided is not valid Excel date”.
Application of DURATION function in Excel
- Bond Portfolio Management: DURATION function helps in managing bond portfolios by calculating the duration of individual bonds or the entire portfolio. This aids in assessing interest rate risk and optimizing portfolio composition.
- Risk Assessment: It assists in evaluating the interest rate sensitivity of bonds, allowing investors to gauge the potential impact of interest rate changes on bond prices and overall portfolio value.
- Portfolio Optimization: By comparing the durations of different bonds, investors can optimize their portfolio’s risk-return profile, ensuring a balance between risk and reward.
- Asset Liability Management: Financial institutions use the DURATION function to manage their asset-liability positions effectively, ensuring that the durations of assets and liabilities are matched to minimize interest rate risk.
- Duration Matching: Investors and fund managers use duration matching strategies to match the duration of their assets with their liabilities, thereby reducing the risk of losses due to interest rate fluctuations.
- Hedging Strategies: DURATION function aids in designing hedging strategies against interest rate risk by identifying bonds or derivatives with durations that offset the risk exposure of existing positions.
These applications demonstrate the versatility and importance of the DURATION function in financial analysis and risk management.
For ready-to-use Dashboard Templates:
