Calculate Mean, Median, and Mode in Excel to unlock the full potential of your data analysis. These fundamental statistical tools provide invaluable insights into the distribution, central tendency, and frequency of your datasets, facilitating informed decision-making and strategic planning. Whether you’re working in finance, marketing, education, or any other field, mastering these calculations in Excel will enhance your ability to interpret data accurately and make data-driven decisions. Embrace these techniques to elevate your analytical capabilities and transform raw data into meaningful information.
- How to find the mean (average) in Excel?
- How to calculate the median in Excel?
- Usage of Median IF formula with one condition.
- How to get mode in Excel?
- Mean vs. median: which is better?
1. How to find the mean (average) in Excel?
It is likely that the measure you are familiar with, arithmetic mean or simply mean, is its most prevalent form. To calculate the average, one must add groups of numbers and then divide the sum by the number of those numbers.
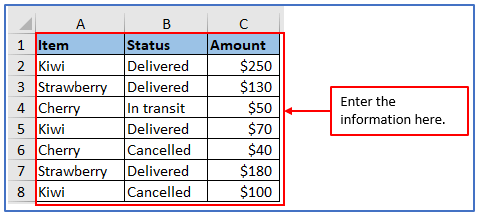
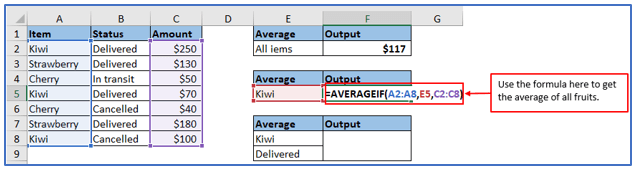
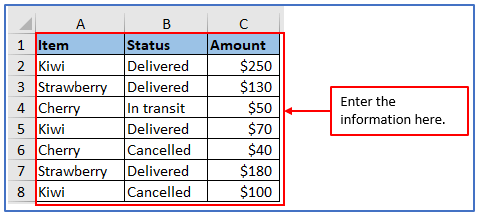
Step 1: Make a table with some products as fruits, status, and amount.
All the data has been placed in the table below.
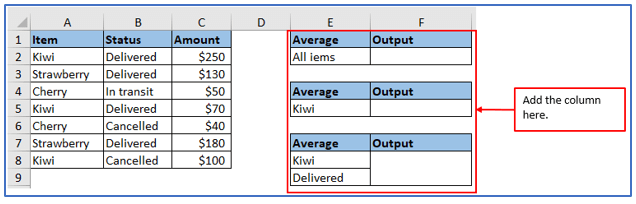
Step 2: Now, you want to get the average values of all items, for this add the column in E1,E2 and F1, F2. You want to get the average sales of “Kiwi”, to get the result of this add the column in E4, E5 and F4, F5. The average of “Kiwi” as sales with the status ‘Delivered’ for this add the column in E7:E9 and F7:F9.
The columns have added here.
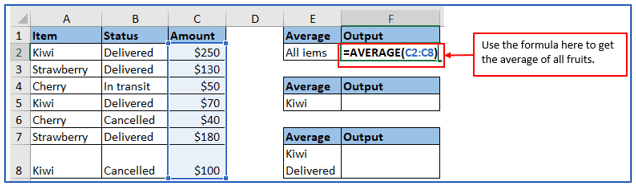
Step 3: Based on the Excel spreadsheet column, you need to use the formula. Average of all items the formula will be: =AVERAGE(C2:C8)
Applied the formula here.
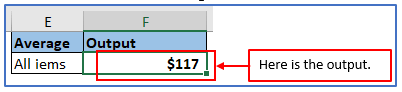
Step 4: Now, press Enter and you will get the result of the average amount of all fruits.
The result is shown in the image.
Step 5:To get the average of Kiwi, the formula will be: =AVERAGEIF(A2:A8,E5,C2:C8)
Used the formula below.
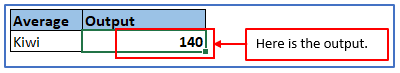
Step 6: Now, press Enter and you will get the average output of Kiwi .
Here is the result below.
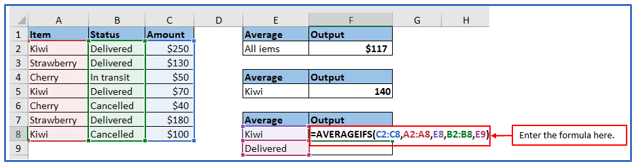
Step 7: To get the average of Kiwi as sales with the status ‘Delivered’ the formula will be: =AVERAGEIFS(C2:C8,A2:A8,E8,B2:B8,A9)
Used the formula below.
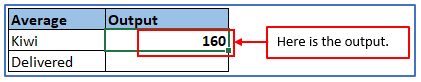
Step 8: After pressing the Enter button then you will get the average output of Kiwi as sales with the status ‘Delivered’ .
Here is the result below.
2. How to calculate the median in Excel?
The median is the numerical value at which a group of numbers can be ordered in either ascending or descending order and it represents their middle value. A significant portion of the data is above the median, while another is below the mean.
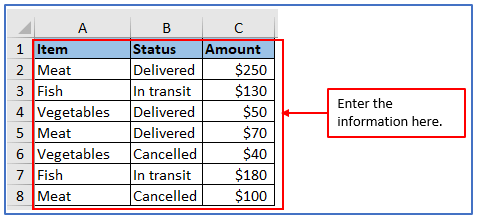
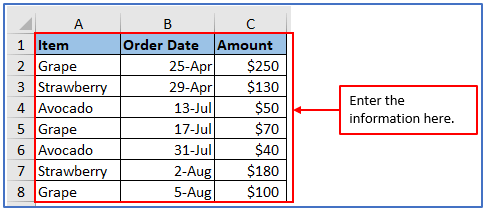
Step 1: Enter the data into the Excel sheet.
All the data has been entered here.
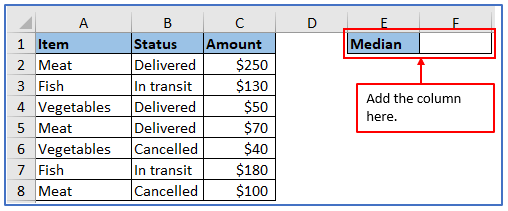
Step 2: Now add a column in E1 and F1 to get the result of median there.
The column has been added here.
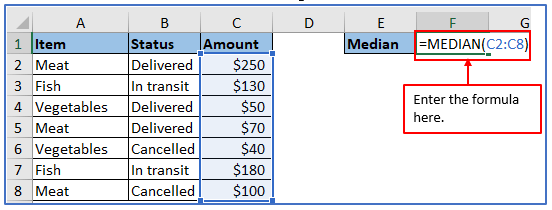
Step 3: Now, use the formula to get the median value. The Formula is: =MEDIAN(C2:C8)
You can see below the formula is used in the image.
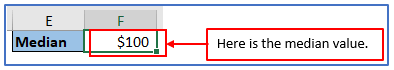
Step 4: Press the enter. Afterward, you will get the median value.
Here is the result of median value.
3. Usage of Median IF formula with one condition.
Step 1: Make a table and enter the data into the Excel sheet.
All the data has been placed here.
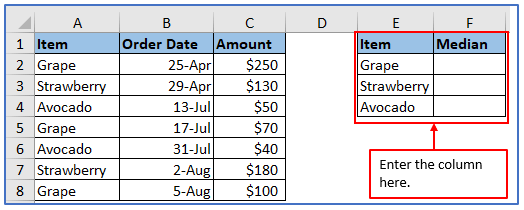
Step 2: Now add the columns in E1:E4 and F1:F4 to get the median value of all items there.
The column has been added here.
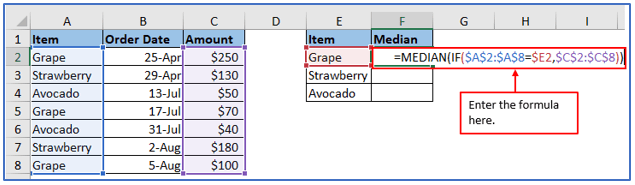
Step 3: To find the median value for a specific item in this enter the item name in a cell and use the following formula to find the median value based on those criteria. $ symbol to create an absolute cell reference. The formula: =MEDIAN(IF( $ A $2: $A$10=$E2, $C$2: $C$10))
Applied the formula here.
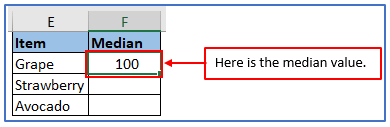
Step 4: After that, press Enter. Then it’ll return the median value of Grape.
The result is outlined below.
4. How to get mode in Excel?
The mode is the value that occurs most frequently n the data set. The mode can be identified easily by counting the number of times each value occurrence, while the mean and median require some calculation.
Step 1: Enter the data into the Excel sheet.
All the data has been entered here.
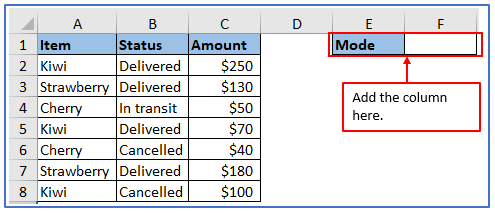
Step 2: Now add a column in A7and B7 to get the result of future value there.
A column has added here.
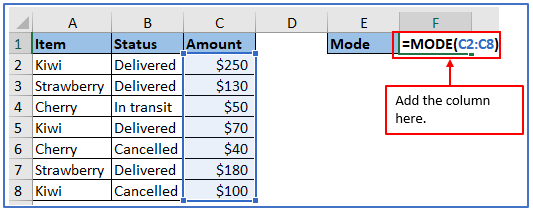
Step 3: Now, use the formula: =MODE(C2:C8)
You can see below the formula is used in the image.
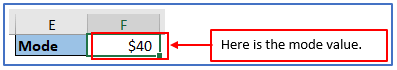
Step 4: Press the enter. Afterward, you will get the value.
Here is the value after calculating. If the data set contains more than one mode, the Excel MODE function returns the lowest mode.
5. Mean vs. median: which is better?
All in all, there is no universally accepted standard “best” gauge of central tendency.
Which measurement is most appropriate, depending on the data you are utilizing and your knowledge of the expected value you want to estimate? In a symmetric distribution (a distribution in which values occur with a constant frequency), the mean, median, and mode is the same.
A distorted distribution, with few high or low values, can result in differences among the three central tendency measures. Due to the significant difference between the mean and other data sources, it is more convenient to use the median value to measure asymmetric central tendency as opposed to binary distributions.
For example, it is generally accepted that the median is better than the average for calculating a typical salary.
why? The best way to understand this is with an example.
See salary samples for common jobs:
Electrician – $20 per hour
Watchman – $26 per hour
Army Officer – $47 per hour
Sales Manager – $54 per hour
Engineer – $63/hour
Now let’s calculate the average (average): Add the numbers above and divide by 5: (20+26+47+54+63)/5=42.
That means the average wage is $42 per hour.
The average wage is $47 an hour and that’s what Army officers earn (half the wages are low, half are high).
The median yields comparable values to the mean in this scenario. But let’s look at what happens if we expand the salaries to include, say, Football players who earn about $30 million a year.
This translates to approximately $14,500 per hour.
The average wage is currently $2,451.
67 an hour, a wage that no one deserves.
In contrast, the median price does not change much by this one outlier ($50.
50 per hour).
Application of Calculate Mean, Median and mode in Excel
- Data Analysis: Calculate the mean (average) to determine the central value of a data set, providing insights into the overall data trend.
- Statistical Reporting: Use the median to identify the middle value in a sorted data set, helping to understand data distribution and skewness.
- Market Research: Apply the mode to find the most frequently occurring value in a data set, useful for identifying common customer preferences or market trends.
- Quality Control: Employ mean and median calculations to monitor product quality, comparing against specified benchmarks to ensure consistency.
- Academic Research: Utilize mean, median, and mode to analyze research data, aiding in hypothesis testing and research conclusions.
- Financial Analysis: Calculate mean and median for financial data such as investment returns or expenses to assess typical financial performance and outliers.
You may be interested:
