Total Return formula is essential for evaluating the overall performance of investments by including both capital gains and income. By leveraging this formula in Excel, users can make informed financial decisions, compare various investment options effectively, and enhance portfolio management. Mastering the Total Return formula not only improves accuracy in financial analysis but also boosts confidence in tracking long-term returns efficiently.
- What is the Total Return?
- Key Considerations of using total Return in Excel?
- How to use total Return formula in Excel?Ex-1
- How to use total Return formula in Excel?Ex-2
- Purpose of using Total Return formula in Excel
1.What is the Total Return?
Measuring performance involves the total profit, which is the actual amount of profit generated by an investment or investment pool over a specific valuation period. The total returns comprise interest, capital gains, dividends, and distribution. There are two types of that comprise the total revenues., income, including interest paid through bond systems, distributions or dividends, and capital increases This corresponds to changes in the market price of an asset.
2. Key Considerations of using total Return in Excel?
- Consistency: Make sure the initial and end values are measured at consistent times
- Time: Throughout the calculation of the overall return, the visibility remains unbounded.
- The distribution and dividends: Don’t forget to include all the income achieved by investing in the calculation for actual overall profits.
- The negative outcome of the return: If the investment loses value, the Formula “Final Value – Beginner” part is negative, which leads to an overall return.
These formulas and implementations in Excel will help you analyze your investment performance with precision.
3. How to use total Return formula in Excel?Ex-1
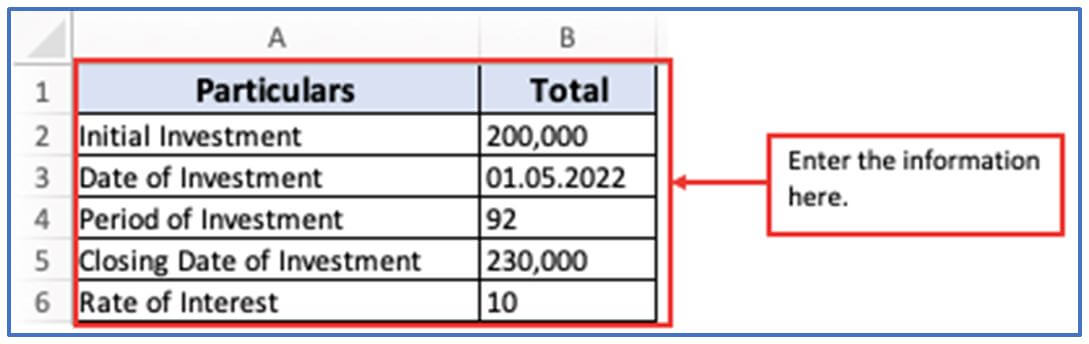
Let’s say Mr. AS invested a total of 200,000 in in the 10% debentures of SAD Co. on 01.05.2022, and the value of invested money on the concluding date is 230,000. The time of investment is 92 days. The company deposited interest on bonds during this time frame.
Step 1: Insert the above Data into the Excel sheet as shown below.
The information has been placed here.
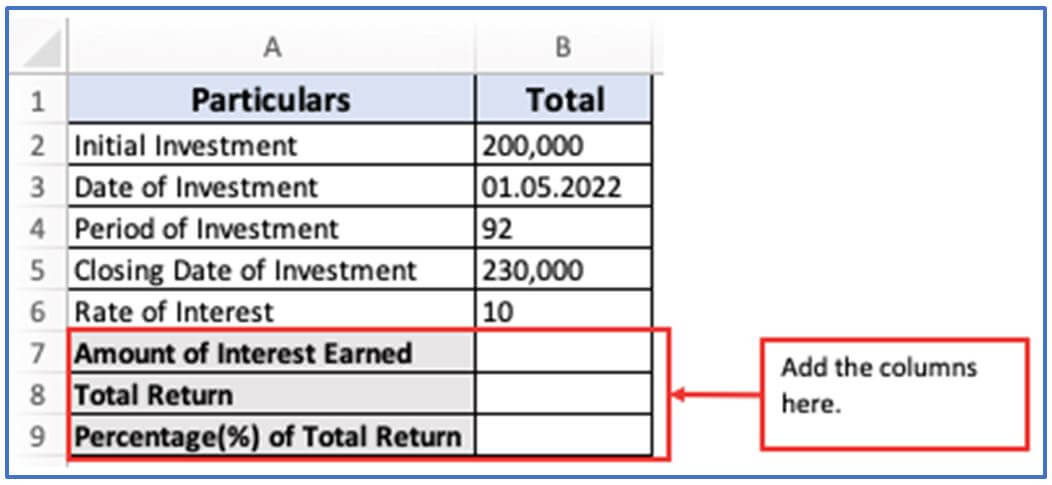
Step 2: To find the Total Return, first you need to get the answer of Amount of Interest Earned. Now, add the column in A7,B7 for getting the Amount of Interest Earned output there ,another column in A8,B8 for receiving the Total Return amount there and columns in A9,B9 to get the Percentage of Total return.
The columns have been added here.
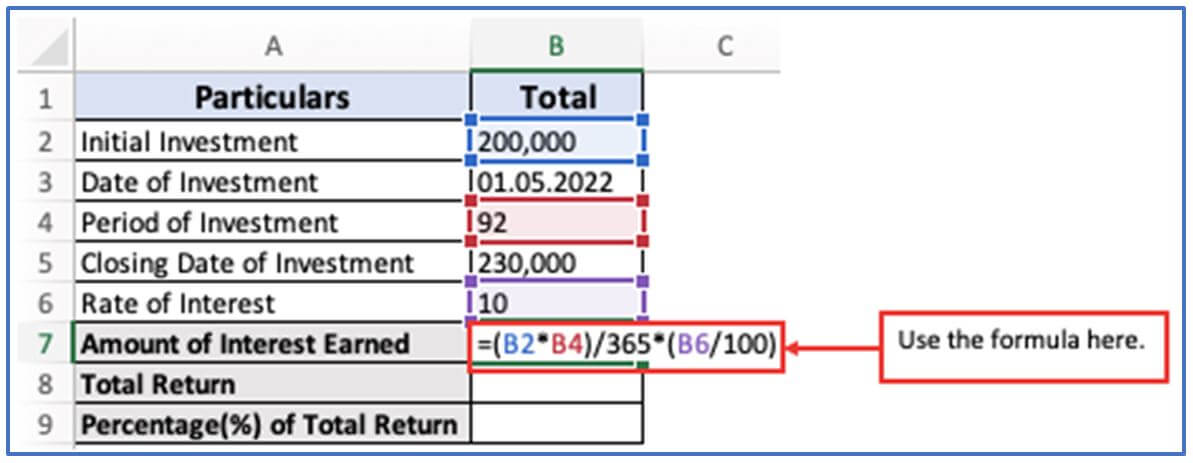
Step 3: The formula for Amount of Interest Earned is given below Now, insert the formula according to your information column.
Formula: =(B2*B4)/365*(B6/100) or (Principal Amount*Number of days/365*Rate of Interest/100
You can see the formula has been used below.
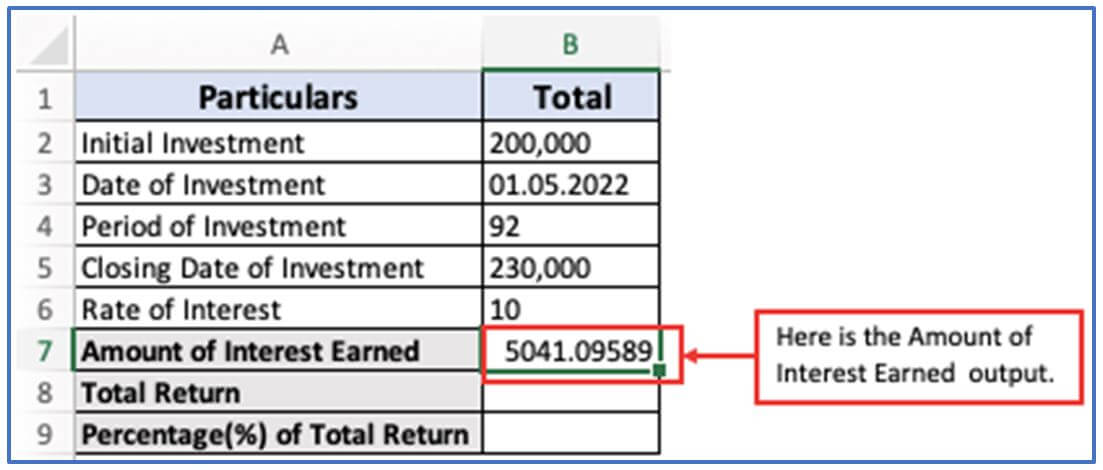
Step 4: After entering the formula Press enter.
Here is the Amount of Interest Earned output, 5041.09589.
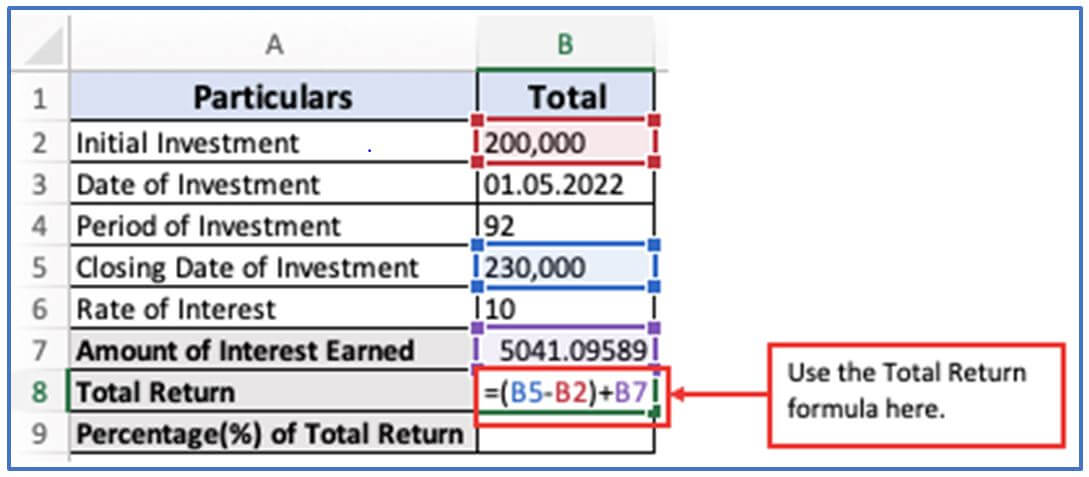
Step 5: Now, to get the Total Return use this formula in cell B8. The formula: =(B5-B2)+B7
Here is the formula illustrated.
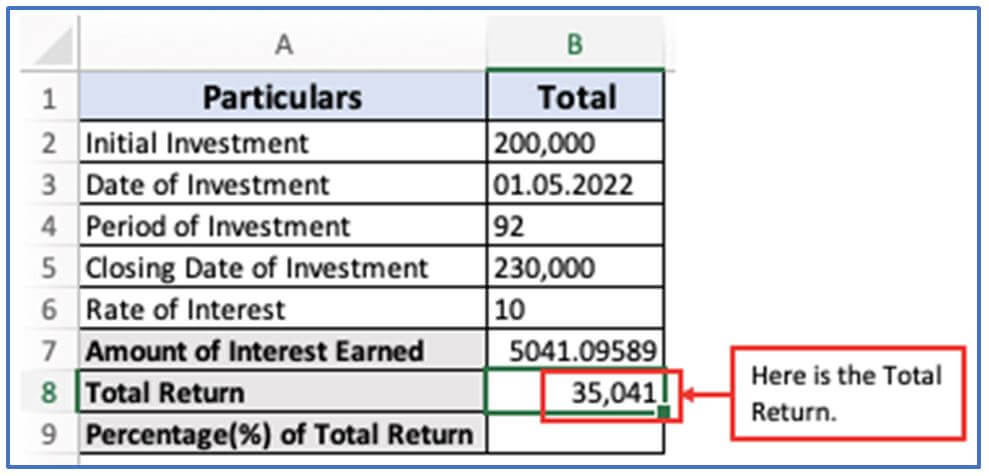
Step 6: After entering the formula press Enter.
The Total Return answer is shown below.
Step 7: Use this formula to convert the Total Return to a percentage. The formula: =B8/B2*100
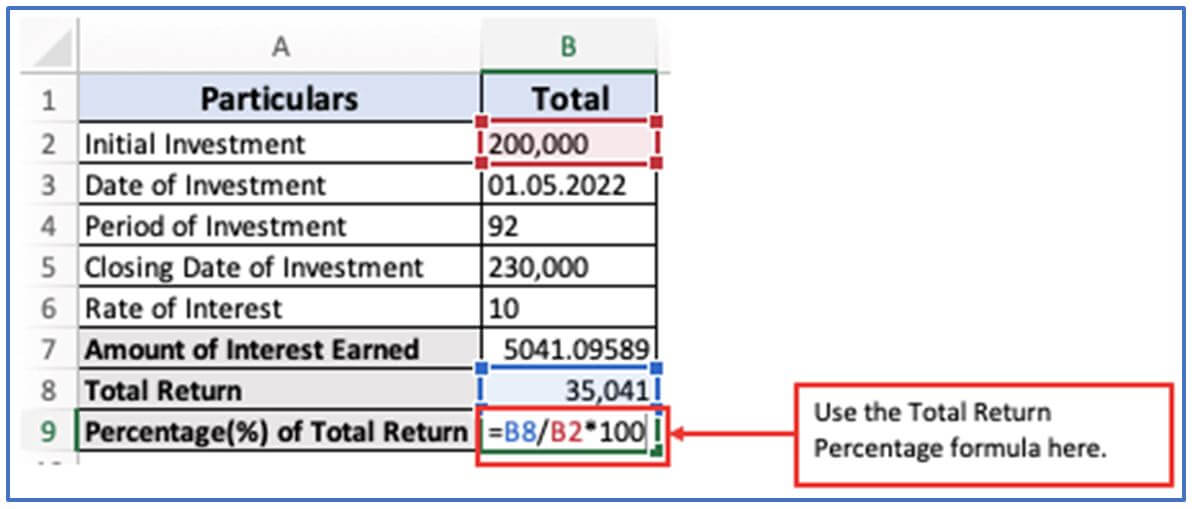
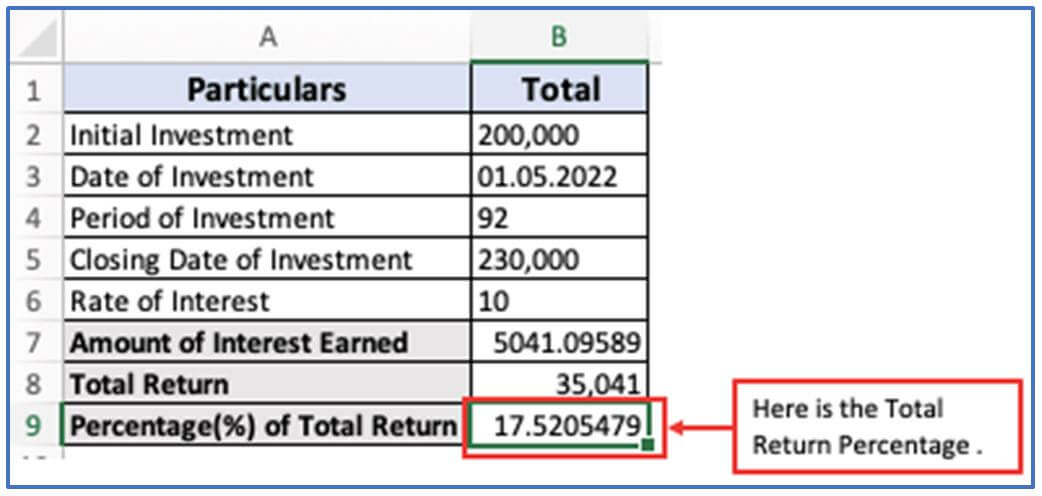
Step 8: Total Return output is outlined in percentage.
Them output is 17.52%.
4. How to use total Return formula in Excel?Ex-2
Step 1: Given,
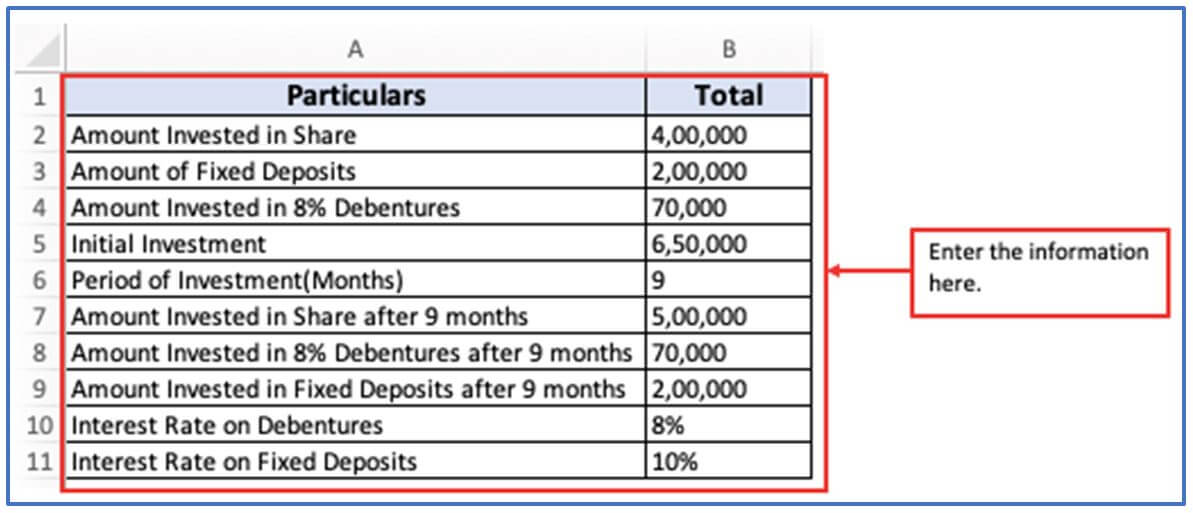
Amount invested on date 01.07.2021 = $6,50,000
Value of Investment on closing date = $8,40,000
Period of Investment = 9months
Write the below information into your Excel as illustrate.
Enlisting the data into the Excel sheet.
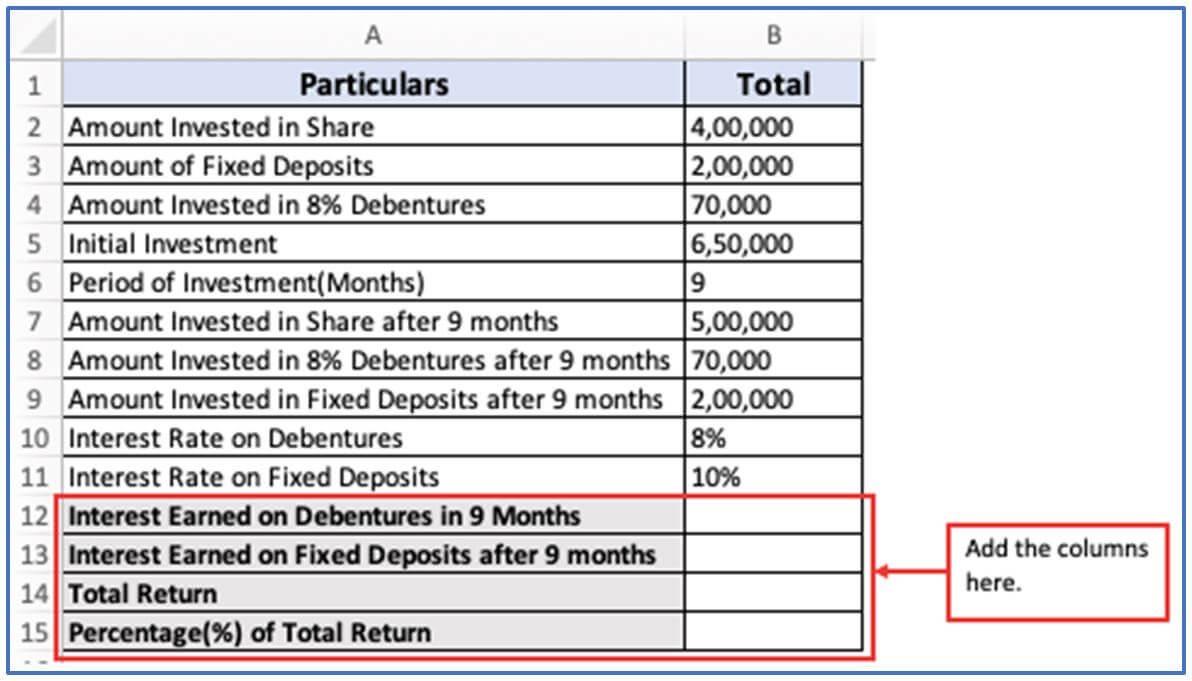
Step 2: To find the Total Return, first you need to get the answer of Interest Earned on Debentures in 9 Months. Now, add the column in A12,B12 for getting the Interest Earned on Debentures in 9 Months output there ,another column in A13,B13 for receiving the Interest Earned on Fixed deposits after 9 Months, columns in A14,B14 for getting Total Return amount there and columns in A15,B15 to get the Percentage of Total return.
Inserting the columns.
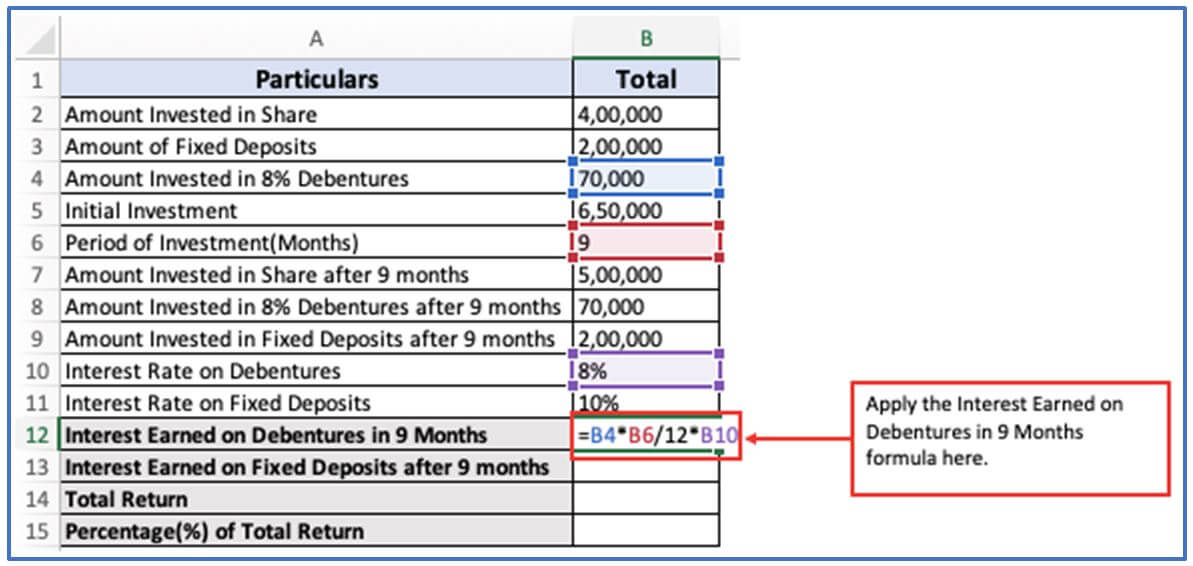
Step 3: The formula for Interest Earned on Debentures in 9 Months is given below. Now, insert the formula according to your information column.
Amount of Interest Earned on Debentures in 9 Months: =B4*B6/12*B10 or Principal Amount * Number of months/12 * Rate of Interest
The formula has been placed in the below picture.
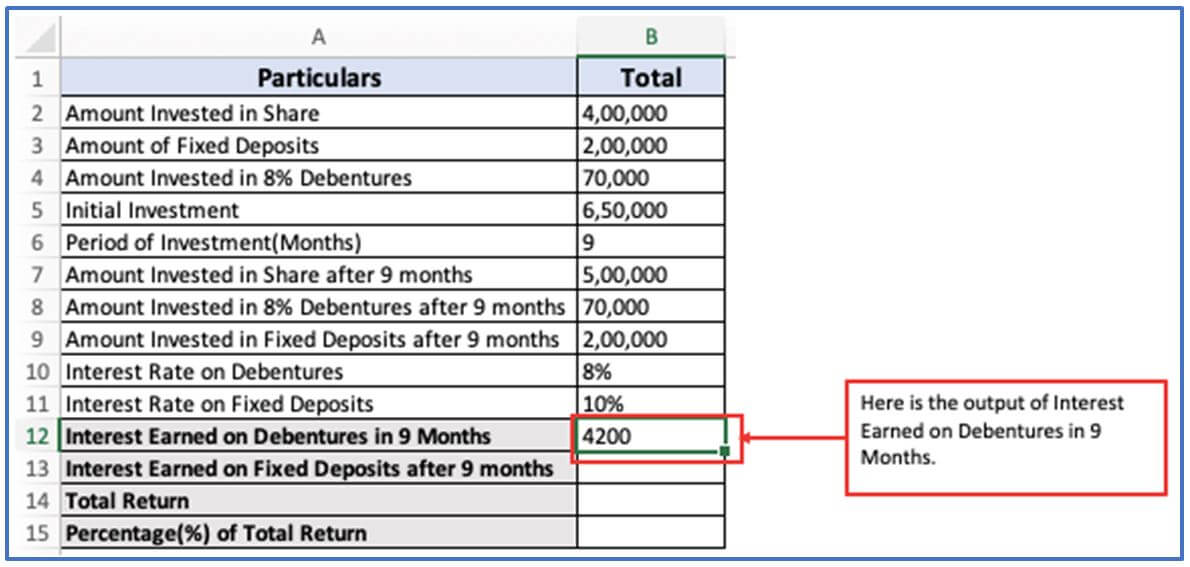
Step 4: When the formula is set, press enter and the result will come out.
Here is the output of Interest Earned on Debentures in 9 Months.
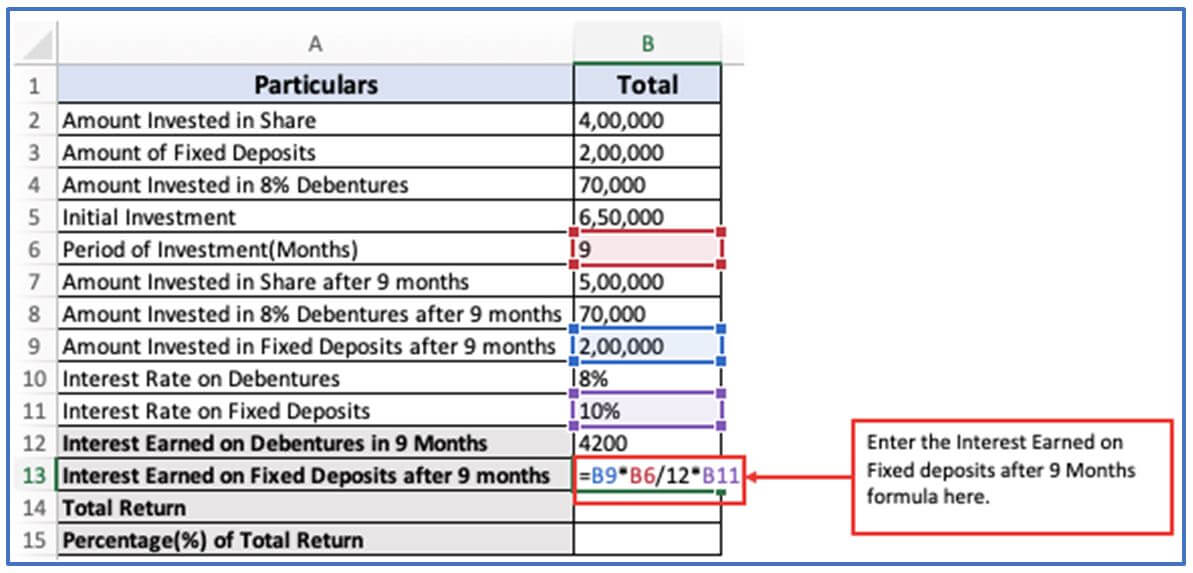
Step 5: Now, to get the Interest Earned on Fixed deposits after 9 Months, use this formula in cell B13. The formula: =B9*B6/12*B11
Here is the formula illustrated.
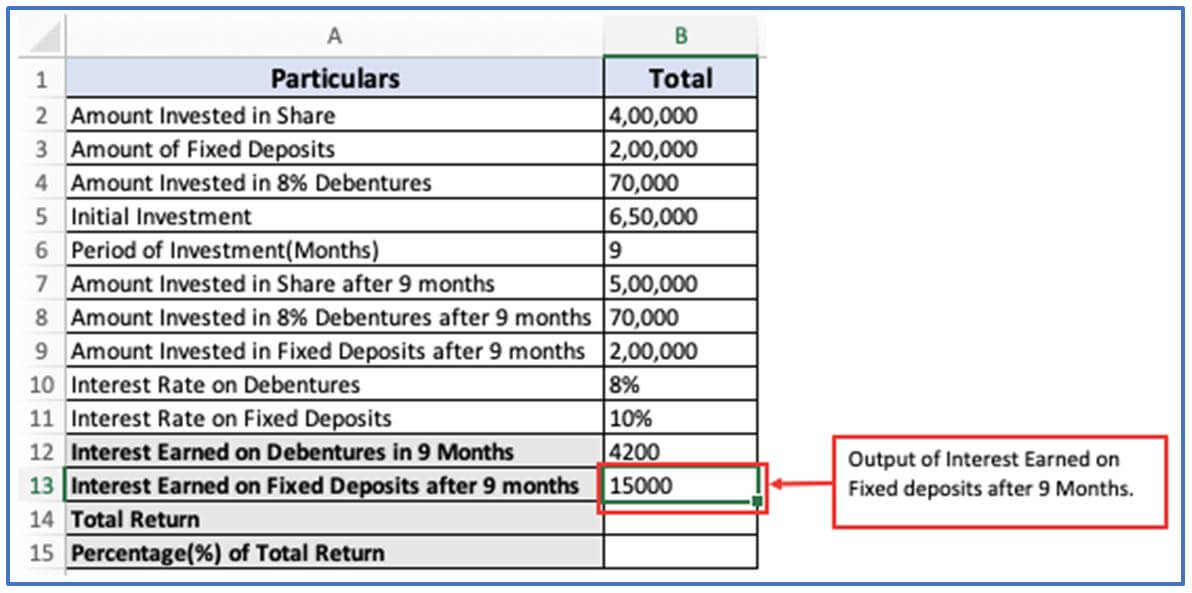
Step 6: After entering the formula press Enter.
The Interest Earned on Fixed deposits after 9 Months answer is shown below.
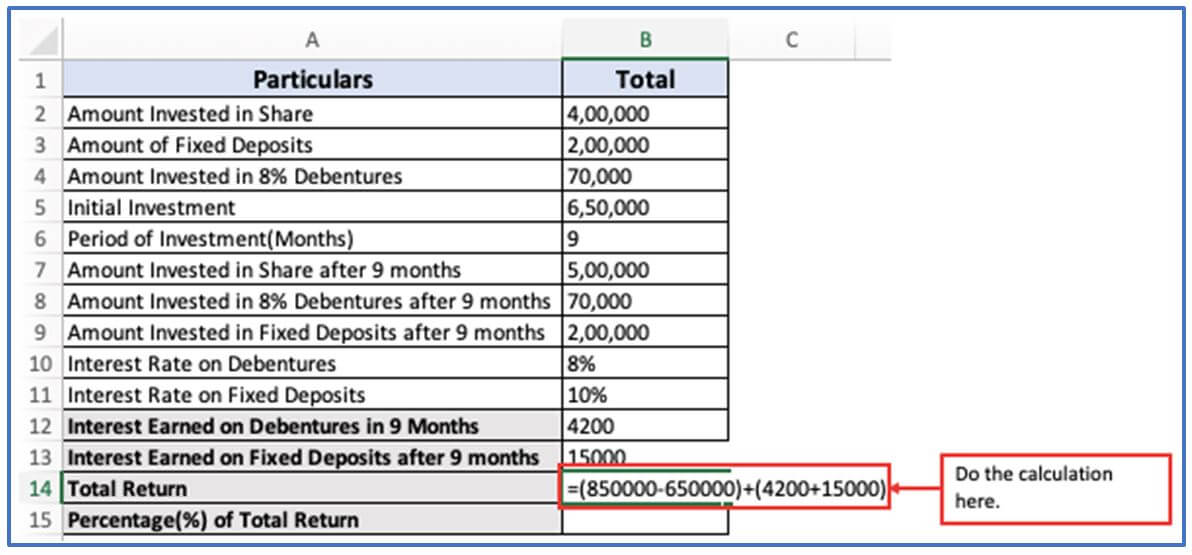
Step 7: Now use the Total Return formula. In step 1, Value of Investment on closing date has been mentioned.
The formula: =(850000-650000)+(4200+15000) OR =(Value of Investment on closing date- Amount invested on date 01.07.2021)+(Interest Earned on Debentures in 9 Months+ Interest Earned on Fixed deposits after 9 Months)
Using the formula below.
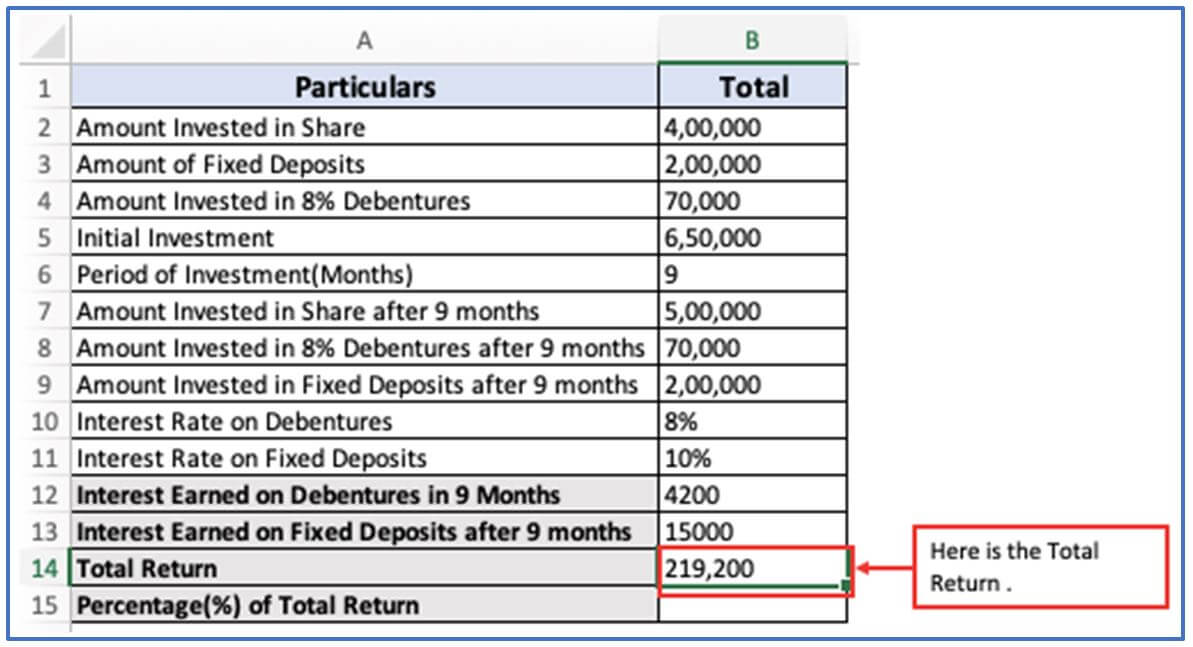
Step 8: Here is the output of Total return.
Total return is shown below.
Step 9: Use this formula to convert the Total Return to a percentage. The formula: =B15/B5*100
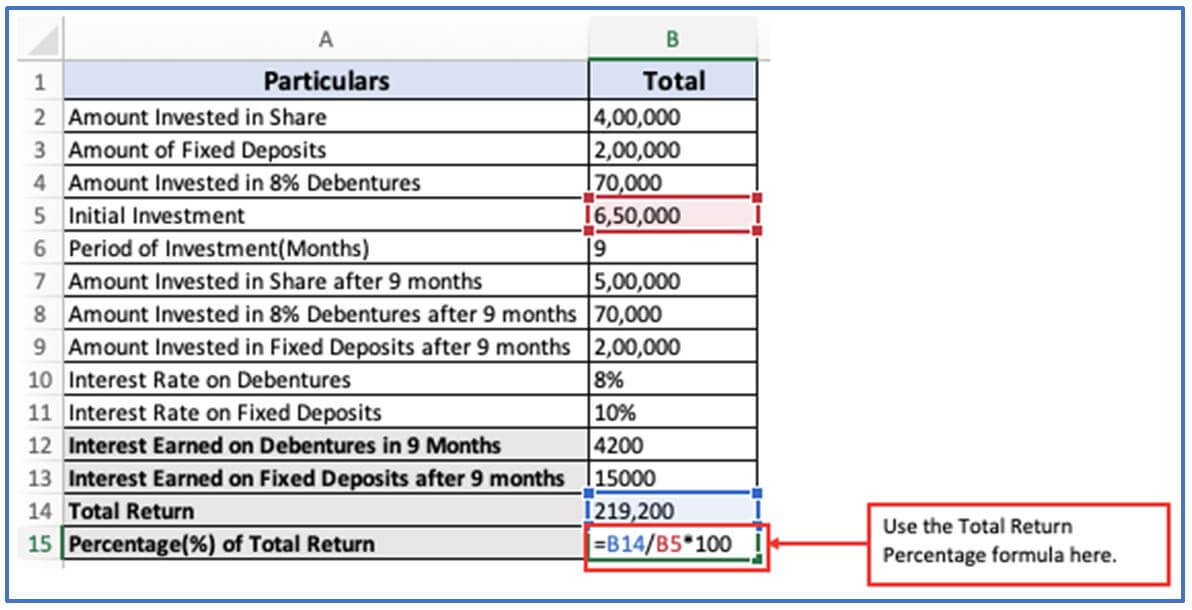
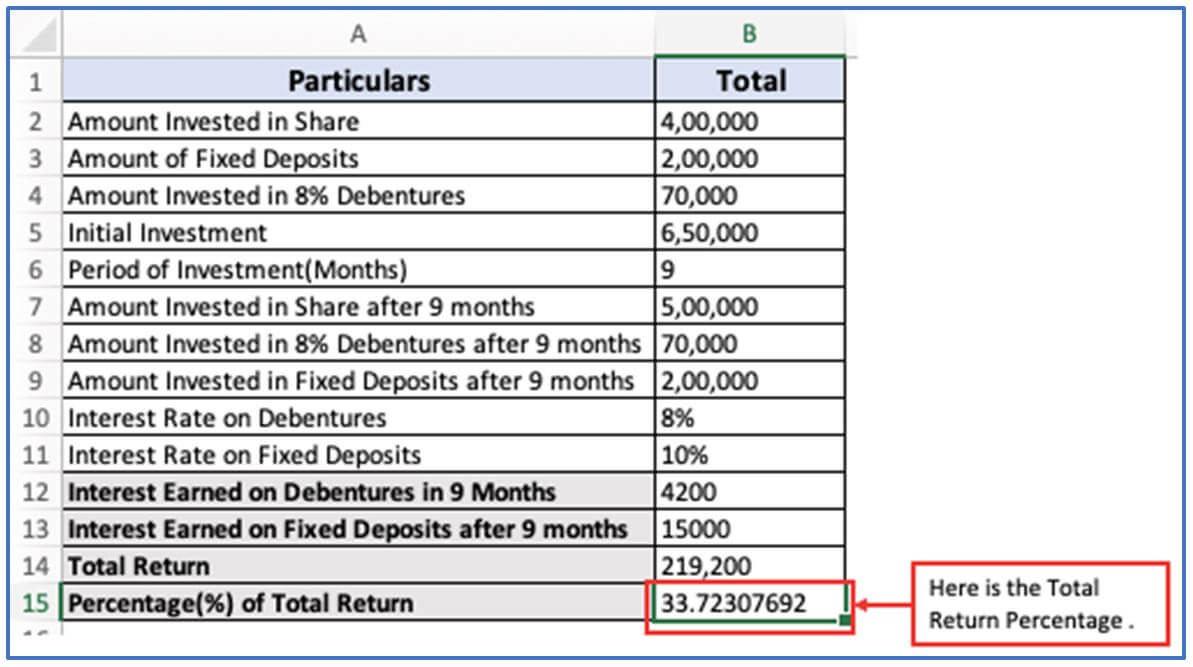
Step 10: Total Return output is outlined in percentage.
Here is the Output.
5. Purpose of using Total Return formula in Excel.
- To accurately measure the performance of your investment, Excel’s overall return formula incorporates both price increases and revenue (such as dividends and interest earned) over a period of time.
- Efficient Workflow. It gives a full insight into how you invested, not just price changes but cash flows such as interest and dividends.
- A comparison of investment options with greater efficiency. It Can help you compare different assets, especially when some wage dividends aren’t.
- DATA-controlled decision-making In Excel. You can perform analysis and comparison of returns over multiple systems or periods using automation.
- The management of portfolios. It Directs you towards identifying the areas of growth in your portfolio and improving your overall performance.
Analyzing a scenario. Various outcomes can be modeled by adapting variables such as dividend yields and price increases to predict potential returns.
Application of Total Return formula in excel
-
Evaluate Investment Performance
Calculates the overall return on an investment, including price appreciation and dividends. -
Compare Multiple Investments
Helps compare returns across various assets, such as stocks, bonds, or mutual funds. -
Track Portfolio Growth
Measures how an entire portfolio performs over a specific period, accounting for all income. -
Estimate Retirement Returns
Assists in forecasting the growth of retirement accounts by incorporating compound returns. -
Incorporate Dividends and Interest
Includes income from dividends or interest in return calculations for a more accurate performance picture. -
Create Financial Dashboards
Visualizes total return data to monitor financial goals using charts and summaries in Excel.
For ready-to-use Dashboard Templates:
