This Tutorial Covers:
- What is DAVERAGE function in Excel
- Syntax of DAVERAGE Function
- Excel versions to apply DAVERAGE Function
- Purpose and Arguments of DAVERAGE Function
- How to use DAVERAGE Function in Excel
- Examples of DAVERAGE Function in Excel
1. What is DAVERAGE function in Excel?
The DAVERAGE function in Microsoft Excel is a valuable tool for calculating averages within a list or database. With this function, you can easily determine the average of a column of numbers based on specific criteria. Whether you’re working with a large dataset or a simple list, the DAVERAGE function allows you to extract meaningful information by considering only the data that meets your defined conditions.
As a built-in function, DAVERAGE is categorized under Excel’s Database Functions. It can be used as a worksheet function, meaning you can include it in formulas within cells on your worksheet. This flexibility enables you to dynamically calculate averages based on changing criteria or conditions.
The syntax and arguments of the DAVERAGE function are described in the following section.
-
Syntax of DAVERAGE Function:
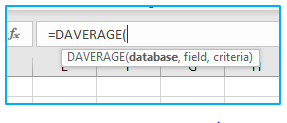
The syntax of the DAVERAGE function in Excel is as follows:
=DAVERAGE(database, field, criteria)
-
Excel versions to apply DAVERAGE Function:
The DAVERAGE function is available in various versions of Microsoft Excel, including Excel 2007, Excel 2010, Excel 2013, Excel 2016, Excel 2019, and Excel for Microsoft 365. Therefore, you can use the DAVERAGE function in any of these versions to perform calculations based on specific criteria within a database or list. Regardless of the version you are using, the syntax and functionality of the DAVERAGE function remain consistent.
-
Purpose and Arguments of DAVERAGE Function:
The purpose of DAVERAGE function in Excel is to calculate the average of numbers in a column or field within a database or list, based on specified criteria. It allows you to analyze subsets of data that meet specific conditions and derive average values from those filtered records.
The Excel DAVERAGE function takes three arguments:
database: This argument refers to the range of cells that represents the database or table you want to analyze. It should include the column headers and encompass the entire data set.
field: This argument specifies the column or field from which you want to calculate the average. It can be identified using either the column number (e.g., 1 for the first column) or the column header as text enclosed in double quotation marks.
criteria: This argument refers to a range of cells that define the criteria or conditions for filtering the data. Each column in the criteria range should have a corresponding header or label that matches the headers in the database range.
By utilizing these arguments, the DAVERAGE function allows you to extract average values from a specific column in your database that meet the defined criteria. It provides a flexible and efficient way to analyze and summarize data based on specific conditions in Excel.
2. How to use DAVERAGE Function in Excel?
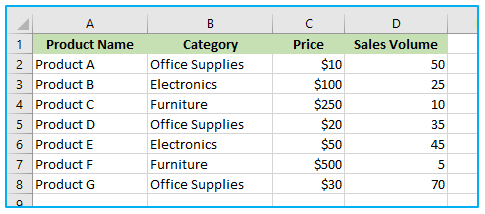
Suppose you are a sales manager and you have a list of sales data for a company’s products, including the product name, category, price, and sales volume. You want to calculate the average sales volume for a specific product category, such as “office supplies,” using the DAVERAGE function.
The use of the DAVERAGE function in Excel step by step is shown below:
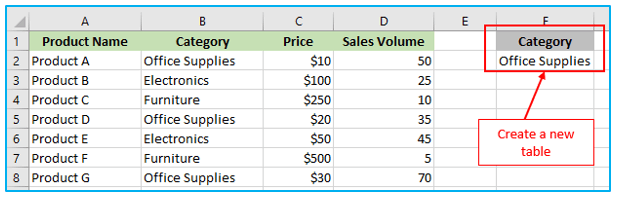
Step 1: You can create a new table that includes the product category you want to calculate the average sales for:
Step 2: Enter the DAVERAGE formula in a new cell, referencing the database range, field, and criteria range. For example, you can use the following formula to calculate the average sales volume for the “Office Supplies” category:
=DAVERAGE(A1:D7, “Sales Volume”, F1:F2)
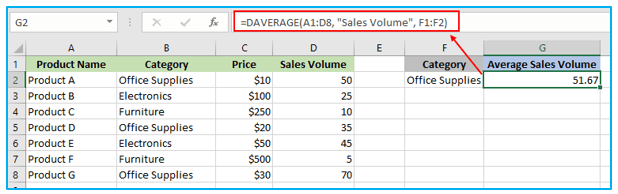
In this formula, A1:D7 is the database range, “Sales Volume” is the field you want to calculate the average of, and F1:F2 is the criteria range that specifies the condition “Category = Office Supplies”.
If you add more conditions to the newly created table, then the average function can also handle this.
Suppose you add this condition like below:
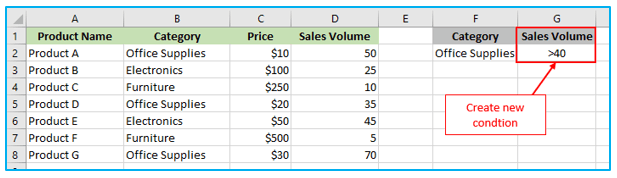
Step 3: Apply the below formula in cell H2, and the result looks like this:
=DAVERAGE(A1:D8, “Sales Volume”, F1:G2)
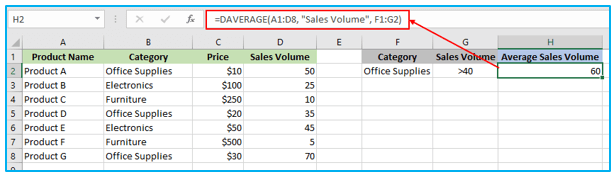
By utilizing the DAVERAGE function with multiple conditions, you can precisely filter your data and calculate average values based on specific criteria combinations. This enables you to perform in-depth data analysis and gain more detailed insights from your Excel dataset.
3. Examples of DAVERAGE Function in Excel:
Here are some examples of using the DAVERAGE function in Excel:
- Average sales of a specific product category.
- Average marks of students who scored above a certain threshold.
- Average price of products within a certain price range.
- Average revenue for a particular region or department.
- Average temperature readings during a specific time period.
- Average number of units sold on weekdays versus weekends.
- Average salary of employees based on job title.
- Average customer satisfaction ratings for a specific product.
- Average duration of customer service calls based on call type.
- Average inventory levels during different seasons.
These examples demonstrate how the DAVERAGE function can be used to calculate averages based on specific criteria, allowing for insightful data analysis and decision-making in various scenarios.
Application of DAVERAGE Function in Excel
- Database Analysis: DAVERAGE function allows users to calculate averages based on specified criteria within a database range.
- Selective Calculation: Users can specify criteria to extract data subsets for calculating targeted averages.
- Dynamic Aggregation: Utilize DAVERAGE to dynamically aggregate data from large datasets without the need for manual filtering.
- Custom Criteria: Apply custom criteria to calculate averages, such as sales within a specific region or orders placed by a particular customer.
- Data Validation: Use DAVERAGE to verify the accuracy of calculated averages against predefined criteria, ensuring data integrity.
- Trend Analysis: Employ DAVERAGE to analyze trends over time by calculating rolling averages within a dataset.
For ready-to-use Dashboard Templates:
