Find range in Excel to unlock the potential of your data analysis, providing you with insights into the spread and variability of your datasets. This fundamental statistical concept is crucial for data analysts, researchers, and anyone who seeks to understand the depth and dynamics of their data. Whether you’re assessing financial risks, analyzing scientific data, or monitoring market trends, this guide will lead you through the simple yet effective steps to accurately find the range in Excel. By mastering this function, you’ll be able to derive meaningful insights from your data, facilitating informed decisions and strategic planning.
Find Range in Excel by using MAX and MIN functions
Usually, we refer the Range in Excel as a cell or collection of cells in the worksheet.
But in this tutorial, we discuss Range, which refers to the range in the data set, i.e. the difference between the highest and lowest value in the data set.
In a simple data set which includes only 110, 130, 135, 140, 150, and 160. To determine the range, we first find out the MIN value, i.e., 110, and MAX value, i.e., 160.
So, the Rage is 160 – 110 = 50.
Let’s take a little bit large data set to find the range on excel. The first set of data is Sorted, so that we can easily find the Minimum value is 13,320 and the Maximum value is 43,125, accordingly Range is 43,125 – 13,320 = 29,805.
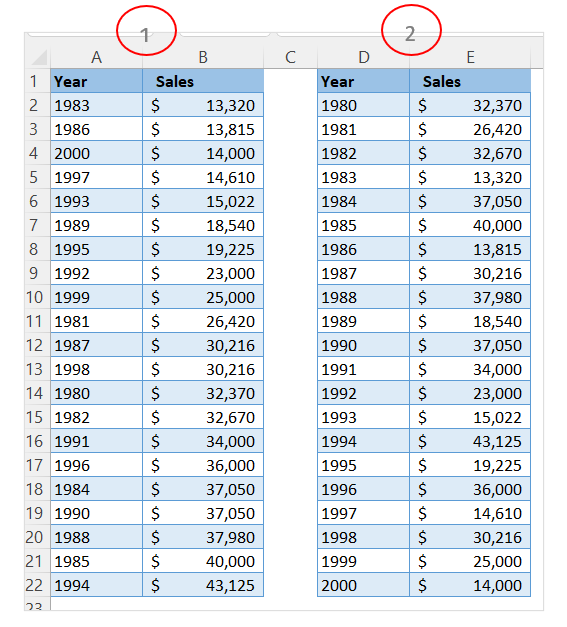
But in reality, data will not be sorted as mentioned in the first data set, in the second data set, there are unsorted data. Let’s see how to calculate the Range by using MIN and MAX functions.
In the second data set, the range is calculated through MIN and MAX function. Formula for Range in Excel:
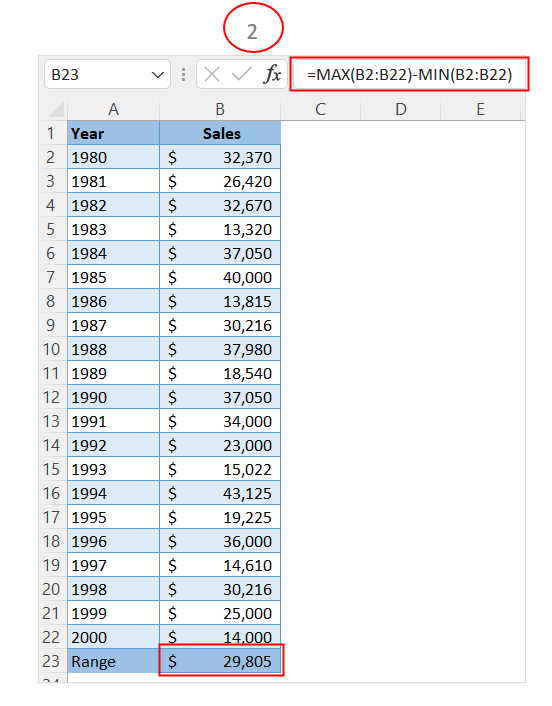
Range = MAX(B2:B22) – MIN(B2:B22)
How to Find Range in Excel using Outlier functions?
Sometimes, we want to calculate the range of data by excluding certain unusual, temporary, or seasonal data. Due to certain factors data in a particular period data may be substantially higher or lower than usual data this unusual data is called outlier. In that case we need to eliminate these data.
We can incorporate a condition to MAX function using MAXIFS or MIN function using MINIFS. Both MAXIFS and MINIFS functions are available in later versions of Excel 2019 and Office 365 subscribers.
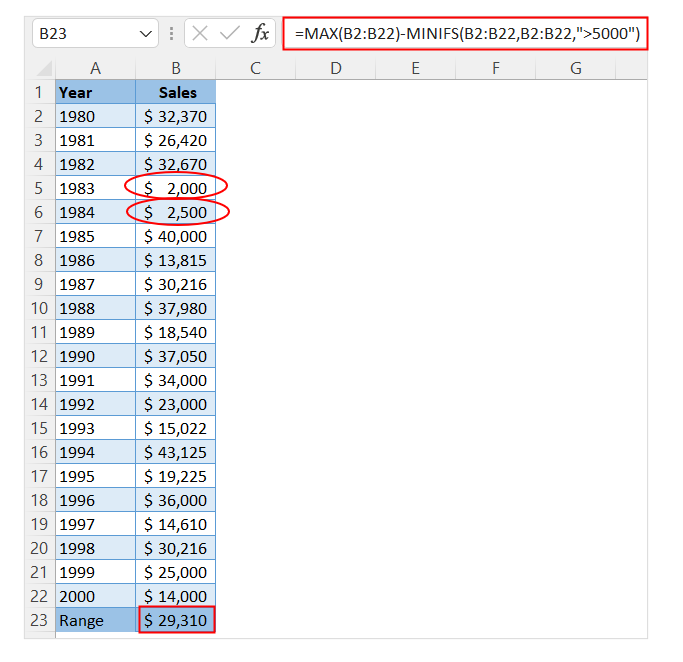
First, we use MINIFS function in the below data set. The syntax for the MINIFS function is MINIFS(min_range, criteria_range1, criteria).
Here we excluded data those are below of 5,000. Due to certain factors two years data are substantially lower than other years’ data. So we consider data those are above of 5,000.
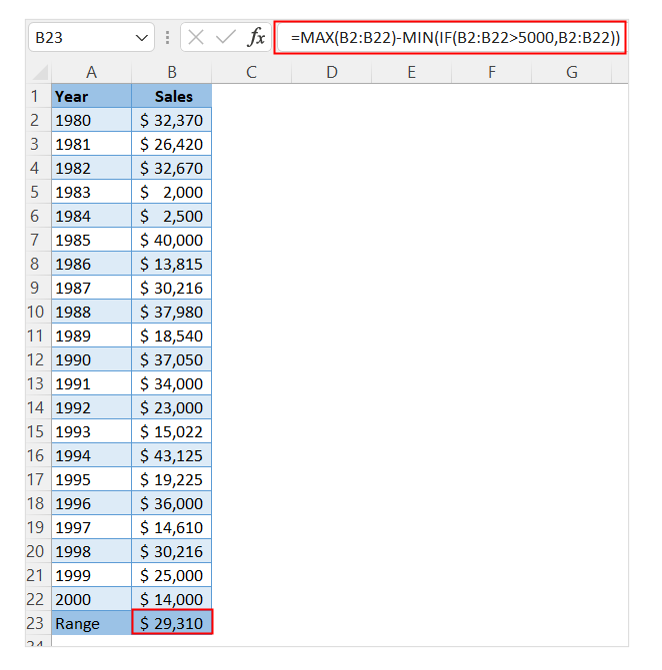
For Excel 2016 or earlier versions, we can incorporate IF function in MIN function to exclude outlier data from a data set. See the below formula:
Second, we use MAXIFS function in the below data set. The syntax for the MAXIFS function is MAXIFS(max_range, criteria_range1, criteria).
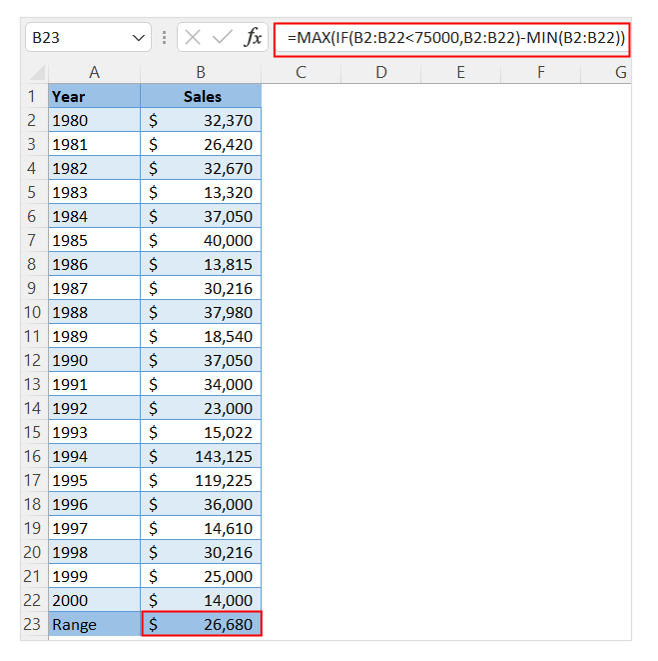
Here, we excluded data that are above 75,000. Due to certain factors, two years data are substantially higher than other years’ data. So, we consider data those are less than 75,000.
For Excel 2016 or earlier version, we can incorporate IF function in MAX function to exclude outlier data from a data set. See the below formula:
Application of ‘Find Range’ in the real world scenarios:
- Market Analysis: Analysts use the range in Excel to assess the volatility of stock prices or market indices over a specific period, helping investors understand potential risks and returns.
- Quality Control: Manufacturing professionals apply the range to monitor the consistency of product measurements, identifying variations that may indicate production issues or defects.
- Academic Research: Researchers find the range in datasets to analyze the spread of results in experiments or surveys, providing insights into data variability and reliability.
- Healthcare Data Analysis: Medical professionals use the range to track the spread of health-related metrics, such as blood pressure or cholesterol levels, aiding in patient diagnosis and treatment plans.
- Sports Performance Monitoring: Coaches and sports analysts apply the range to assess the performance consistency of athletes, from tracking times in races to measuring shot accuracy in ball games.
- Financial Budgeting and Forecasting: Financial analysts use the range to understand the variability in revenue or expense items, aiding in more accurate budgeting and financial forecasting.
For ready-to-use Dashboard Templates:
