Cost-Benefit Analysis is an essential tool for making informed financial and strategic decisions in Excel. By comparing the total expected costs against the anticipated benefits, users can determine the feasibility and profitability of projects, investments, or business choices. Whether you’re evaluating a marketing campaign or a new software investment, Cost-Benefit Analysis empowers you to make data-driven decisions with clarity and confidence. Excel’s built-in formulas and charts simplify this process, allowing users to visualize outcomes and maximize returns.
- What Is the Cost-Benefit Analysis?
- How to do Cost-Benefit Analysis in Excel? Example-1
- How to do Cost-Benefit Analysis in Excel? Example-2
- Limitations of using Cost-Benefit Analysis in Excel.
- Purpose of using Cost-Benefit Analysis in Excel?
1. What Is the Cost-Benefit Analysis?
By analyzing the expected total cost and the overall expected service, CBA provides an efficient means of evaluating the economic feasibility of decisions, projects, or investments.
It is a systematic data control approach used to assess the advantages and disadvantages of alternative options, particularly for financial, economic, or business decision-making. The primary concern is determining whether the advantages of an action, initiative, or strategy will exceed the costs and by what means. It is typically evaluated against the expected overall service, usually by using financial measures.
The decision is typically justified if the service is more valuable than the cost.
2. How to do Cost-Benefit Analysis in Excel?
Step 1: Here given,
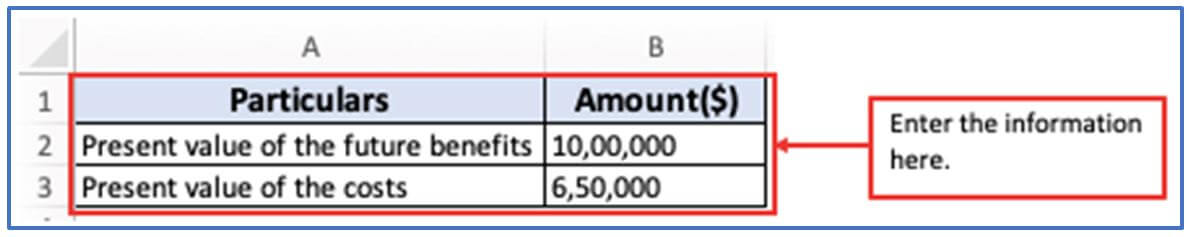
The present value of the future benefits of a project is $10,00,000.
The present value of the costs is $6,50,000.
Assess the project’s net value (NPV) to decide if it is worth continuing with the task.
Inputting the above information into the excel sheet here.
Step 2: Now, choose and add them column in A4 and B4 to get the output of Cost-Benefit.
Column is added here.

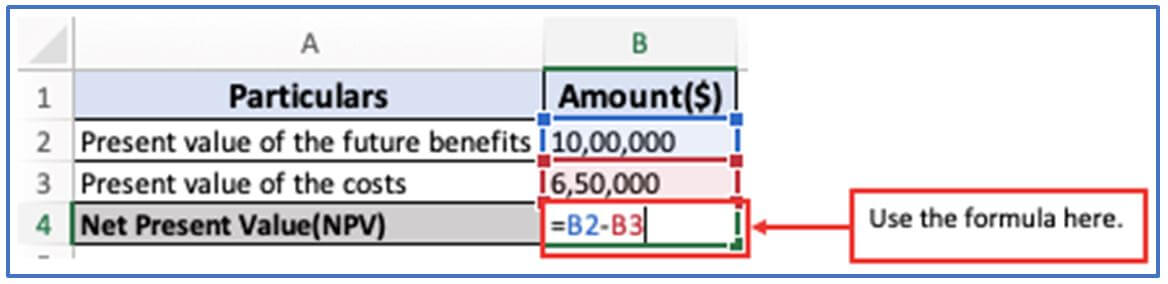
Step 3: Use the Cost-Benefit formula in cell B4. The formula: =B2-B3 or Present value of the future benefits-Present value of the costs.
The formula has been added here.
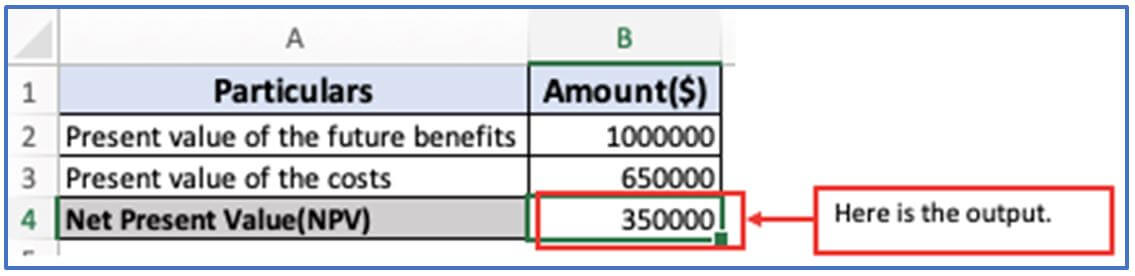
Step 4: Here is the Cost-Benefit output.
After analyzing the output this can be said that, the project must be run due to the positive NPV.
3. How to do Cost-Benefit Analysis in Excel? Example-2
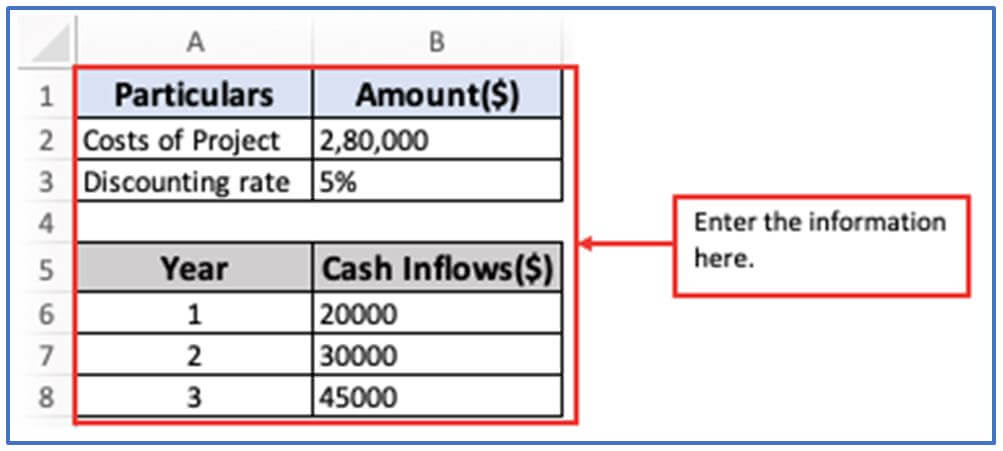
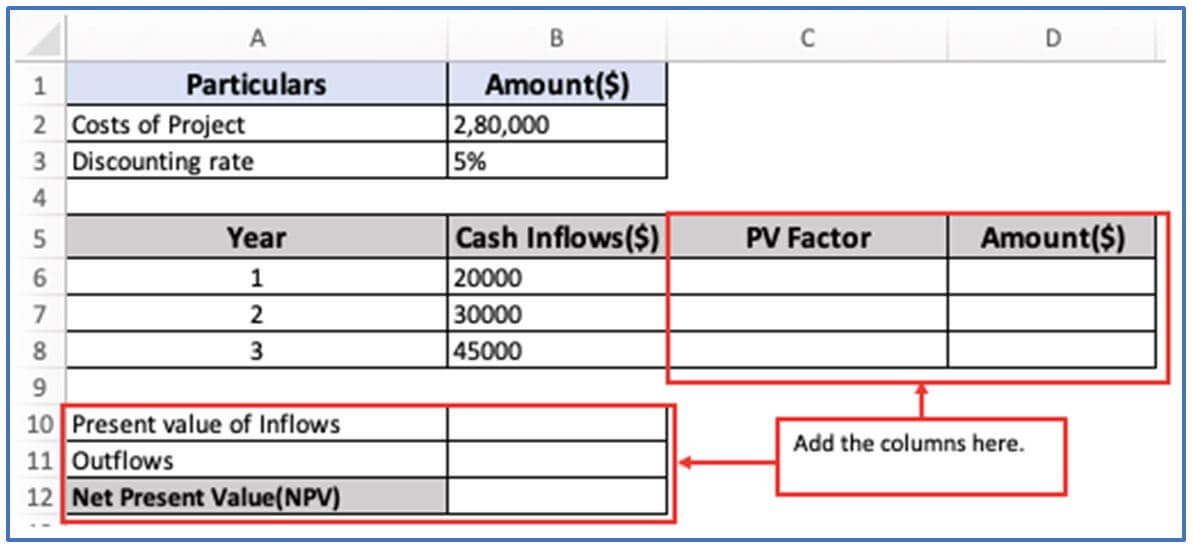
Step 1: You can use the information as displayed below for doing Cost-Benefit Analysis in excel.
The data is placed here.
Step 2: Now you need to enter some columns. Add column C5:C8 for getting PV Factor, column in D5:D8 for getting PV Factor Amount. Include column in A10,B10 to get the output of Present value of Inflows, Columns in A11,B11 for getting the output of Outflows, Columns in A12,B12 to acquire the amount of Net Present Value(NPV).
Adding the columns.
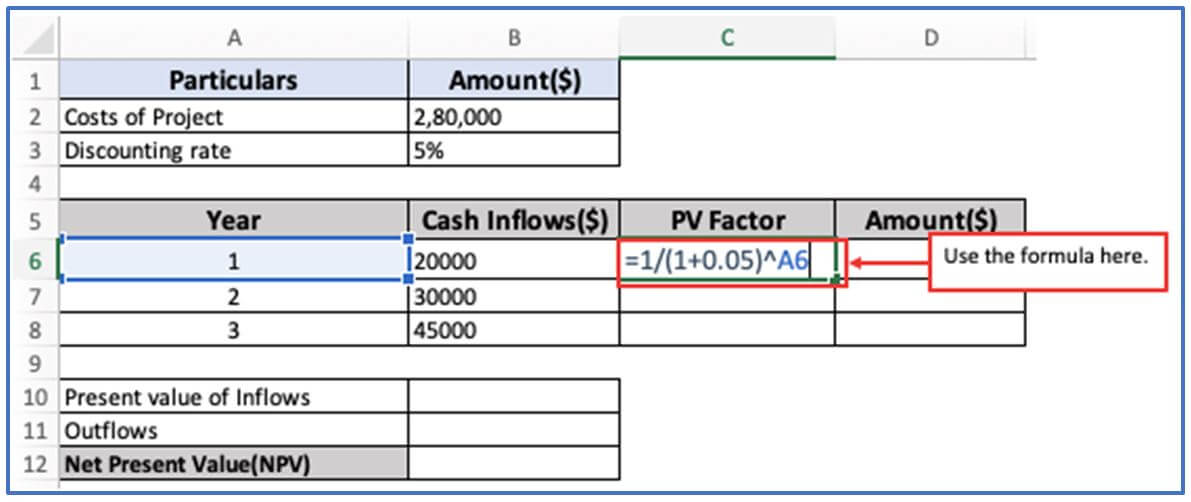
Step 3: First you need to find out the PV factor. For this use the formula in cell C6. Them formula: =1/(1+0.05)^A6
The formula is entered here.
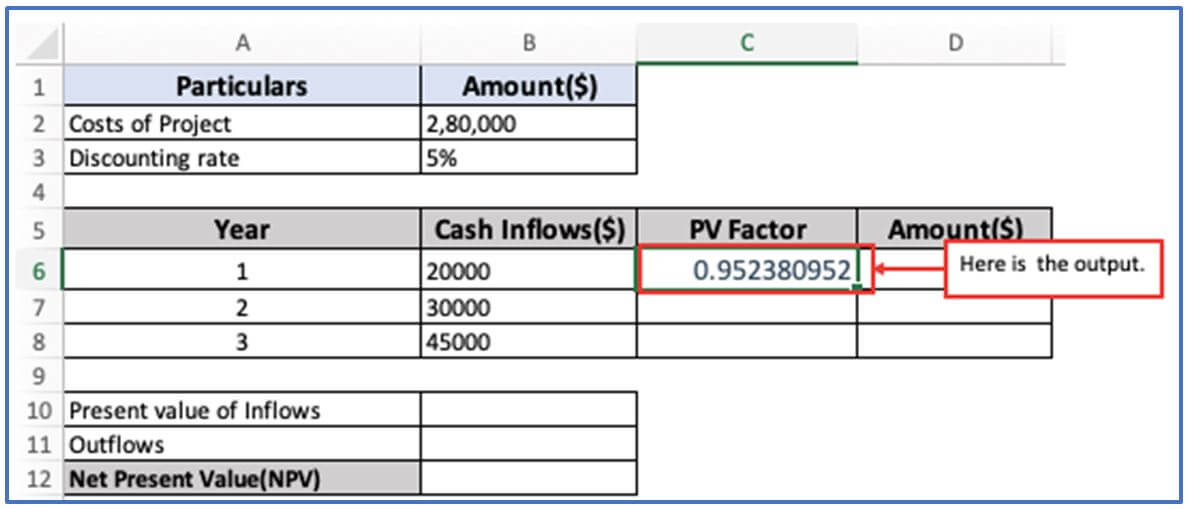
Step 4: Here is the PV factor show.
Output of PV factor is outlined.
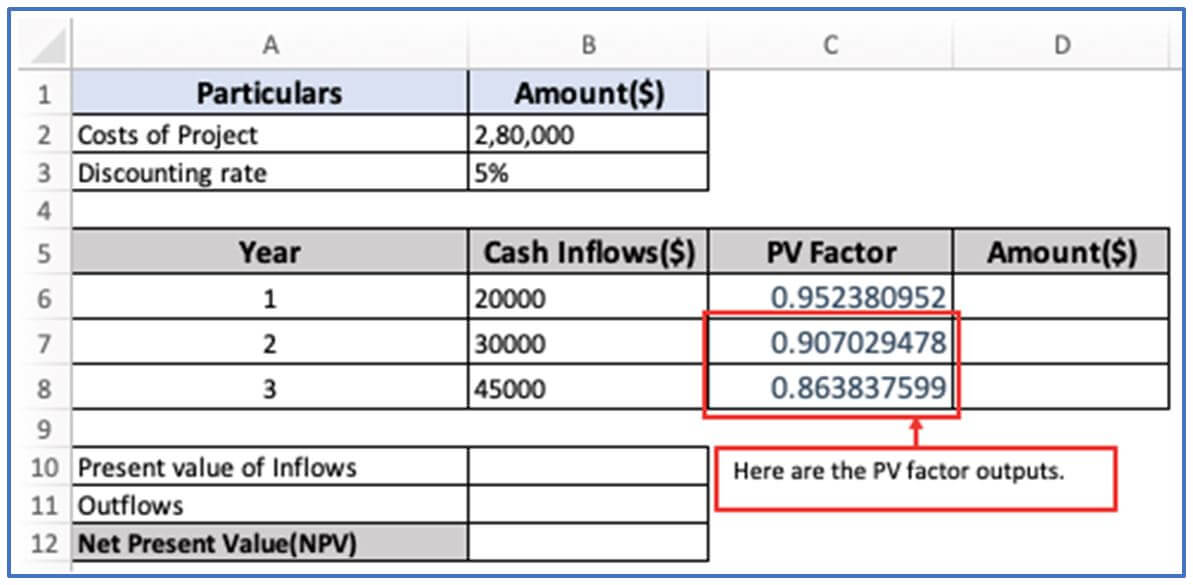
Step 5: Now, drag-down the formula from C6:C8 or use the same formula from step 3.
Here are all the PV factor outputs.
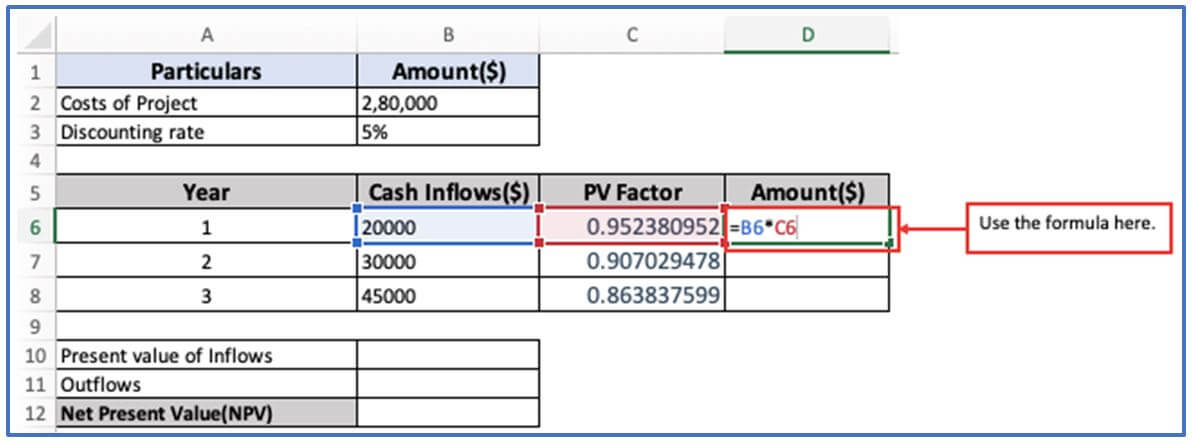
Step 6: For getting the PV factor amount, use this formula in cell.
Using the formula here.
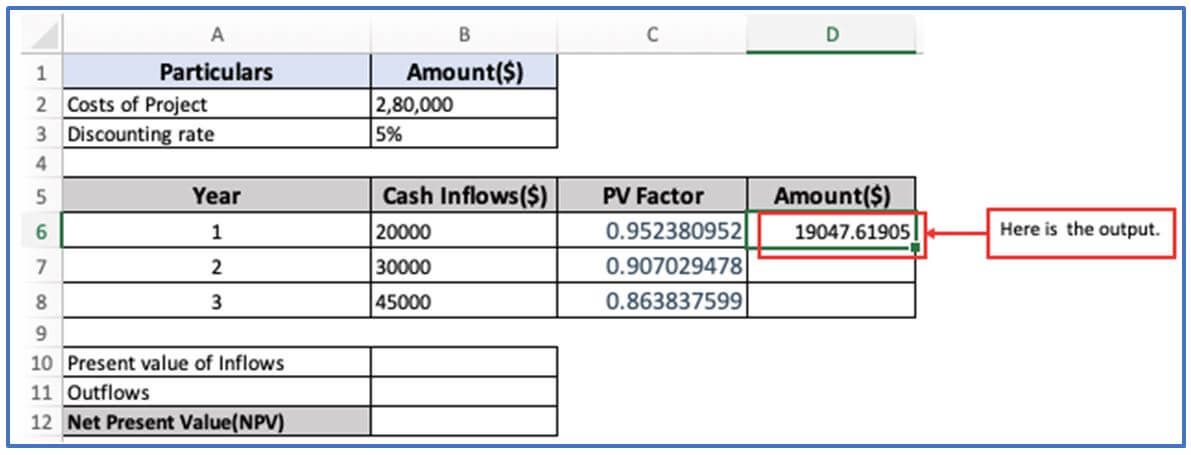
Step 7: Now, press enter and the amount of PV factor will come out.
Here is the amount of PV factor.
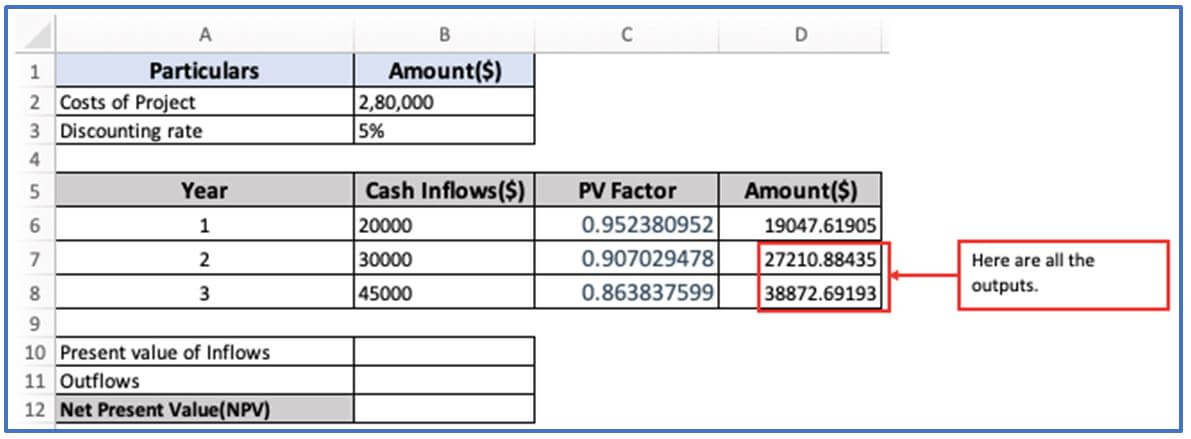
Step 8: Afterward, drag them cursor from D2:D8 or use the same expression from Step 6.
All PV factor Amounts are presented.
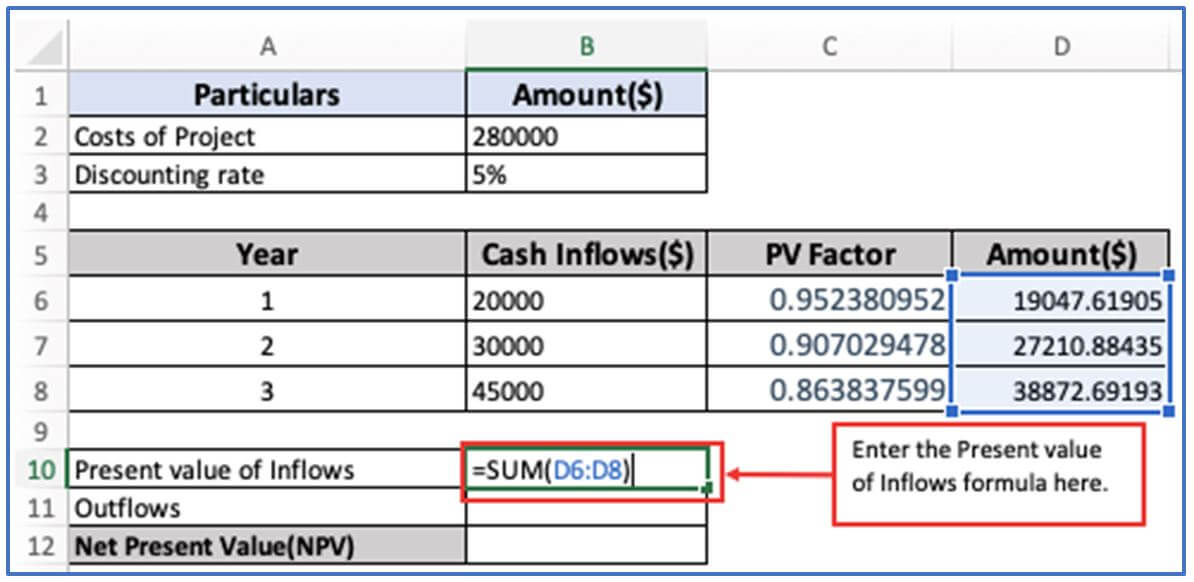
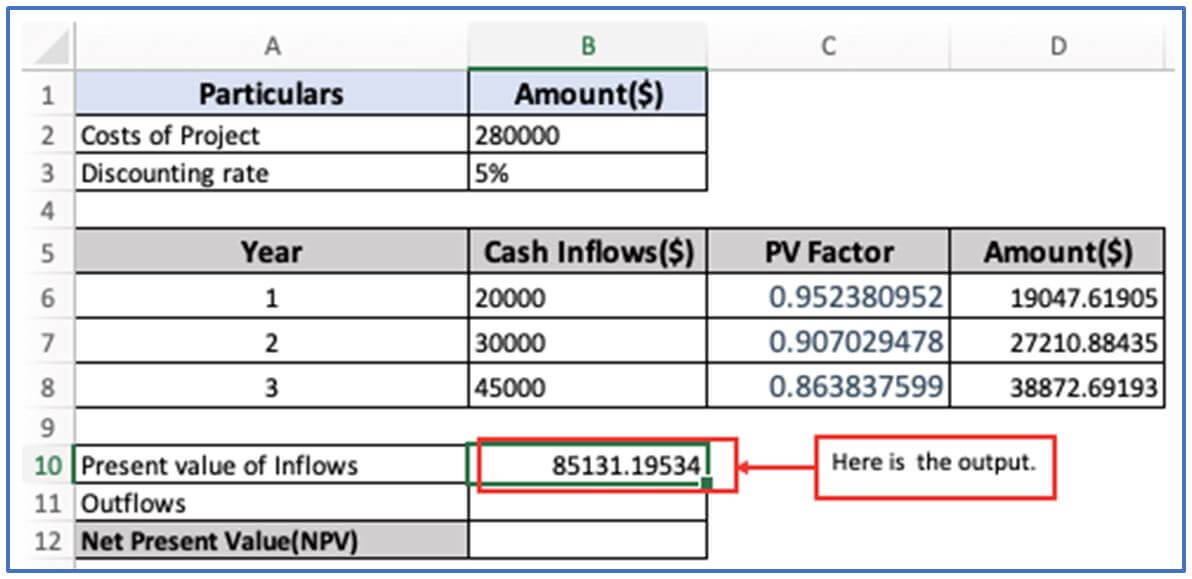
Step 9: Now, use formula of the Present Value of Inflows in cell B10. The formula: =SUM(D6:D8)
The formula has been placed here.
Step 10: Here is the amount of the Present Value of Inflows.
The output is outlined below.
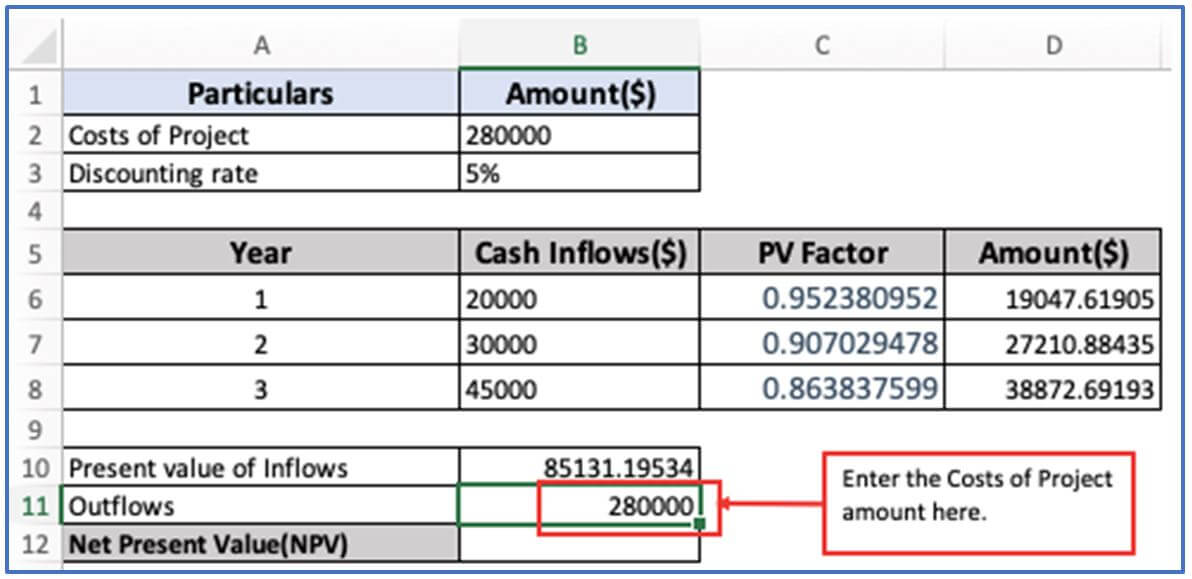
Step 11: In cell B11, enter the Outflow (costs of project) amount which is given above in step 1.
Here costs of project 2,80,000 is entered below.
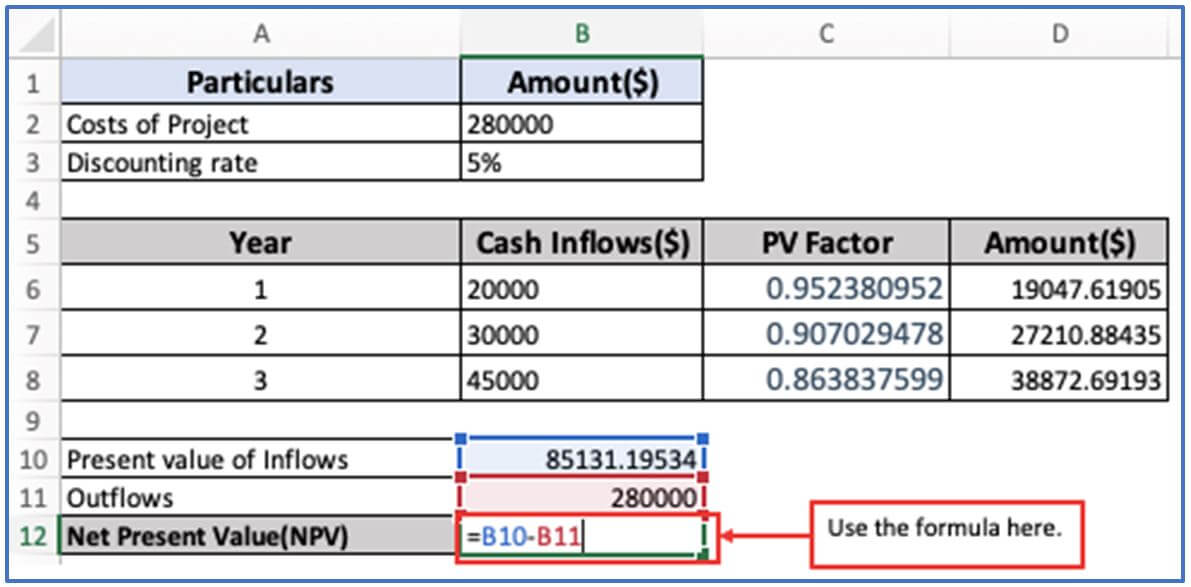
Step 12: For getting the Net Present Value you need to use the formula for it. The formula: =B10-B11
The formula is inserted below.
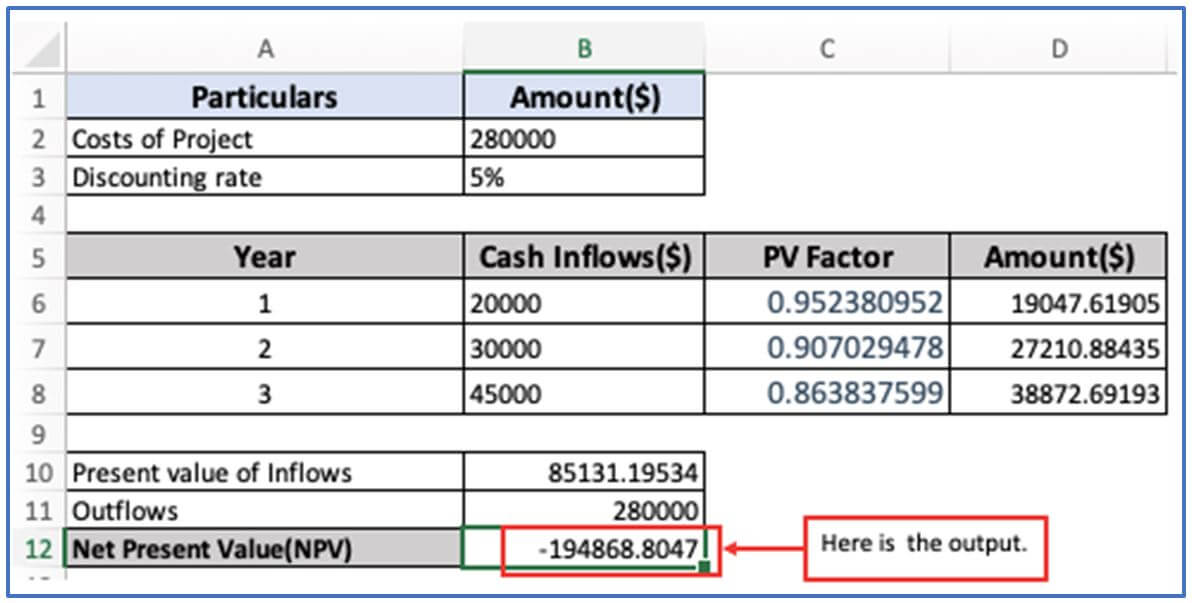
Step 13: When the net value of the project is over 0, it should be implemented. Here NPV is over Minus(-) figure, so the project cannot be executed.
Here is the output.
4. Limitations of using Cost-Benefit Analysis in Excel.
Complex Model: The lack of automation in Excel does not support augmented automation unless combined with macros (VBAs) or external tools. Manual updating of large dynamic models increases the likelihood of human error.
- Formula Small errors: In the formula Cell Formula (for example, incorrect area, missing parentheses) can also result in inaccurate results. As the model becomes more complicated, persecution and testing of formulas without tools or plugins becomes more difficult
- Financial value is highly valued for brand value: Customer satisfaction, employee morality, and other financial value, but is not standardized in Excel. Subjectivity in these estimates can lead to biased or misleading results
- Issues related to version control and collaboration: Excel is more susceptible to version conflicts when shared between multiple users. Cloud no sync (like OneDrive or Google Sheets), team collaboration can be bothersome and dangerous.
- Risks to Data Integrity and Security: Excel files can be unintentionally corrupted or altered. We do not provide integrated user access control or robust data verification for large teams.
- Limited visualization and reporting function: Lack diagrams and conditional formatting in Excel’s dynamic dashboards and enhanced visualization tools without Add-Ins or Power BI integration.
- Flexibility Issues: For small to medium-sized analyses, Excel is a good choice. Company-level CBA managing large data records, multiple projects, or lengthy schedules in Excel can make it a difficult and slow task.
- Unified Scenario: Management doesn’t have an easy way to switch scenarios (best or worst case) unless you build them manually tools such as Scenario Manager are useful, but they are not intuitive or scalable.
5. Purpose of Cost-Benefit Analysis in Excel?
The purpose of Excel’s Cost Benefit Analysis (CBA) is to help an individual or organization make sound decisions by comparing the costs and benefits of a project, as well as investments or decisions using a structured quantitative approach. Excel is especially useful for this as it provides flexibility, formulas and tools for clear analysis and visualization.
Key purpose of using Excel for cost analysis:
- Costs and Services Quantification: Excel can list all potential costs (costs, workers, materials, etc.) and benefits (income, savings) in an organized way You can use the formula to automatically calculate the total and net services.
- Run Scenario Analysis: “What -If” scenarios can be created to see how variable changes (increased costs, delayed income, etc.) affect the outcome This is simplified with tools such as data tables, target searches, and scenario managers.
- Financial Metric Calculation: Use Excel to use important metrics such as,Data Control Decision: Excel’s clear CBA supports objective decisions by presenting all relevant financial data in one place.
Obtaining records and tracking: Excel files serve as a detailed record of assumptions, calculations, and sources used in analyses that may be useful for stakeholders and audits.
Application of Cost-Benefit Analysis in Excel
-
Project Evaluation
Analyze the financial viability of proposed projects by comparing projected costs and expected returns. -
Investment Decisions
Determine whether an investment is worthwhile by calculating net benefits over time. -
Budget Allocation
Prioritize spending by evaluating which initiatives offer the highest return for the cost incurred. -
Operational Efficiency
Assess whether process improvements or technology upgrades deliver enough benefit to justify their costs. -
Risk Management
Weigh potential risks against benefits to make informed decisions and minimize financial exposure. -
Policy and Strategy Planning
Support strategic planning by quantifying the benefits and costs of different business approaches or policy options.
For ready-to-use Dashboard Templates:
