Criteria validity in Excel is crucial for ensuring the accuracy and reliability of data analysis. By understanding and implementing criteria validity, Excel users can confidently filter and analyze datasets based on specific conditions. This process enhances the integrity of the results, enabling informed decision-making and effective problem-solving. With Criteria Validity in Excel, users can streamline workflows, identify trends, and draw meaningful insights from their data. Whether you’re conducting financial analysis, market research, or performance evaluation, mastering criteria validity empowers you to extract valuable information and drive actionable outcomes.
This Content covers:
- What is criterion validity in Excel?
- Why is criterion validity used in Excel?
- Apply Unique values with criteria.
- How to measure criterion validity?
- Types of criterion validity in Excel?
1. What is criterion validity in Excel?
Criterion validity, referred to as concurrent or predictive validity, is a concept used in research and statistics to assess the validity of measurement tools and tests. They are statistical and psychometric concepts that can be analyzed or calculated using Excel..
Criterion validity involves evaluating how well a measurement or test correlates with a specific criterion or standard.
Excel allows you to calculate correlation coefficients (such as the Pearson correlation coefficient) to assess the strength and direction of the relationship between two variables. For concurrency validity, look at the correlation between the test or measurement and the concurrency criterion. To obtain predictive validity, test results are used to predict future outcomes and evaluate the accuracy of the prediction.
2. Why is criterion validity used in Excel?
Criterion validity is a thought for evaluating the effectiveness of measurement tools and tests in research and evaluation. Although Excel is not a tool specifically designed to assess criterion validity, it can be used in research and data analysis to assist in assessing criterion validity in the following ways:
- Data Collection : Excel can be used to collect and organize data. Contains data related to measurement instrument results and standards. Excel allows you to create spreadsheets, enter data, and manage records efficiently.
- Correlation Analysis: To assess the validity of a criterion, it is often necessary to calculate the correlation coefficient to measure the relationship between the measurement instrument and the criterion. Excel provides functions such as CORREL and PEARSON that help you calculate these correlations and determine the strength and direction of the relationship.
- Data Visualization: Excel provides tools for creating a variety of charts and graphs. These visualizations allow you to visually explore and represent relationships between measurement instruments and standards to aid in data interpretation.
- Statistical analysis: Excel can be used to perform statistical tests such as t-tests and regression analysis related to assessing criterion validity. These tests help determine the significance of the relationship between measurements and criteria.
- Data Reporting: After you perform your analysis, you can use Excel to report and summarize your criterion validity results and easily communicate your results to others.
3. Apply Unique values with criteria.
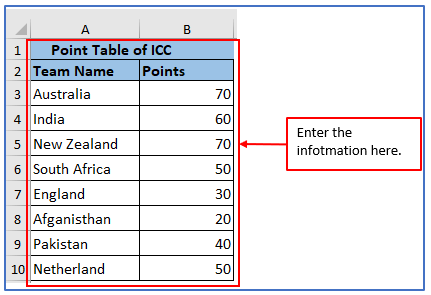
Step 1: You need to first take some data and make a data table as shown below.
Entered the data here.
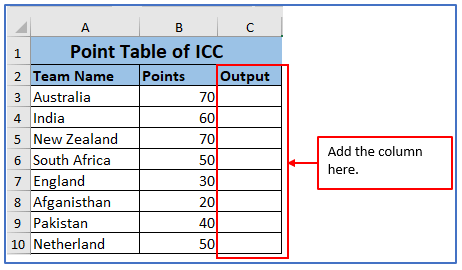
Step 2: Now, add a column in to get the result.
The column has been added.
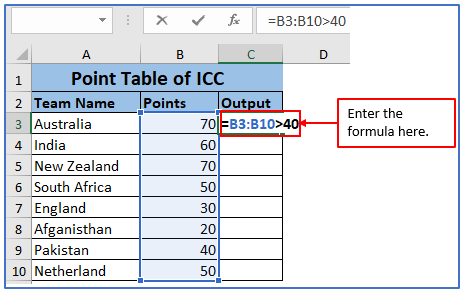
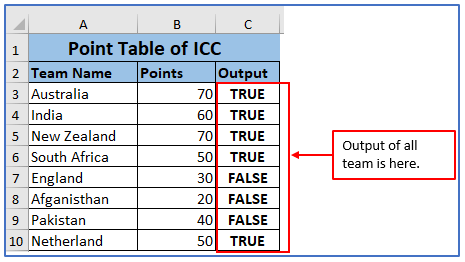
Step 3: Set up a limit that you want to extract unique values from a list with a point table greater than 40. For this, the formula is: =B3:B10>40
Applied the formula here.
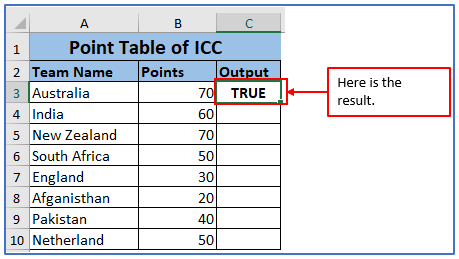
Step 4: After applying the formula you will get the result.
The result is true because the column B10 score is greater than 40. The result is below.
Step 5: Now apply the same formula for every team according to your Excel column or drag down the cursor from column C3.
Every result in the above image returns an array containing TRUE and FALSE values. Look at column D. If the specified value within the range which is greater than 40, meets the criteria, the result is TRUE, if it doesn’t meet the criteria then the result is FALSE.
4. How to measure criterion validity?
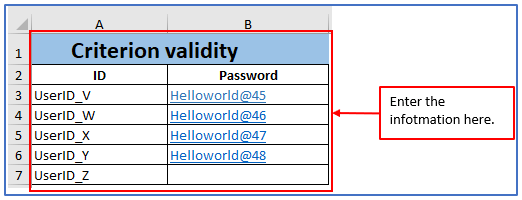
Step 1: In the below example, here are using some data and left one column for using the formula there and there are some restrictions on users from entering limited text.
Entered the data here.
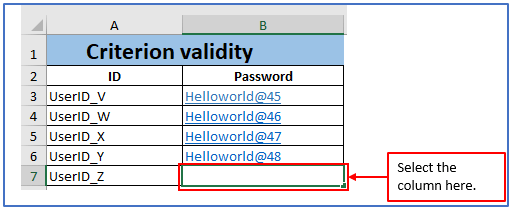
Step 2: NOW, you need to Choose a cell B7 from the excel sheet.
Select the cell here.
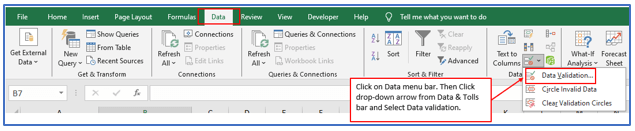
Step 3: Now, Click the Data Validation tool through the Data menu bar.
Selected the Data validation option here.
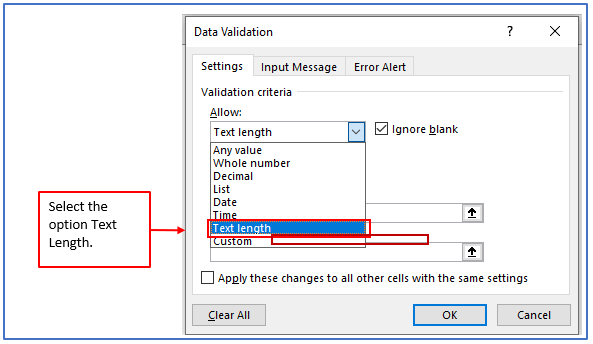
Step 4: Pick Text Length from the Allow drop-down list after clicking on the Data validation option.
Selected the text length option.
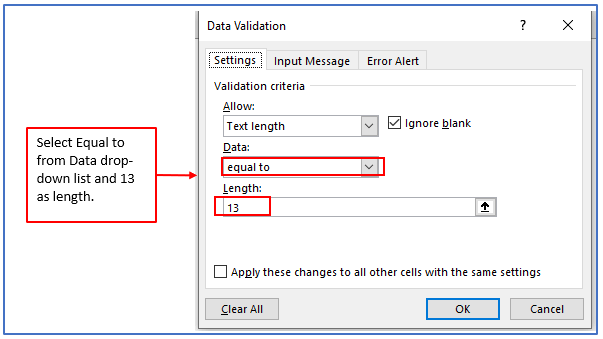
Step 5: Now, choose the equals from the data drop-down list and write down the password length you want (here is 13) shown below.
Choose the equal to option here.
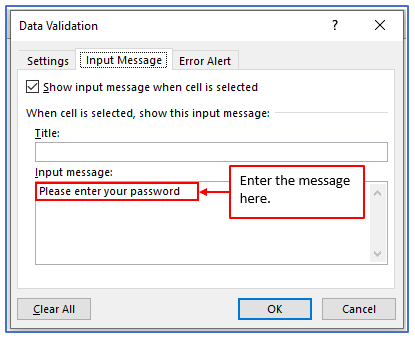
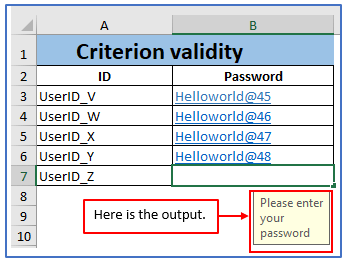
Step 7: Choose the Input Messages tab and provide the message “Please enter your password” to be displayed when a cell is selected as shown.
Entered the message here.
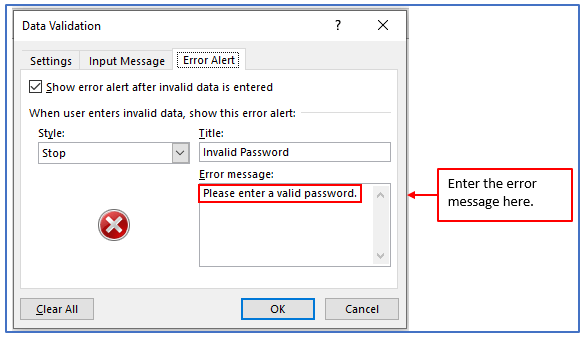
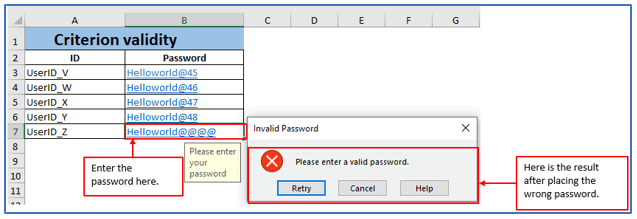
Step 8: Click the Error Warning tab to provide the error title and message, which will be displayed if the user enters a password of invalid length.
You set up the text length as 13 but if you enter a text whose length is more than 13 it will show an invalid password.
Step 9: Parameters will be set for the selected cell after pressing the OK button When selecting a cell, an input message will be displayed.
The result outlined here.
Step 10: Now, type a text, which has a length of 11 not following the other password format..
Entered a password below. When you write an invalid password. It will show you that is an error message as shown.
5. Types of criterion validity in Excel?
There are two main types:
- Concurrent validity: This type of criterion validity assesses how well a test or measurement correlates with criteria that are measured simultaneously. In other words, it measures the degree of association between two actions taken at the same time (such as a new test and an established standard).
- Predictive validity: Predictive validity, on the other hand, assesses how accurately a test or measurement device can predict future results. It measures how well test results collected at one point in time can predict performance based on future criteria.
Excel allows you to calculate correlation coefficients (such as the Pearson correlation coefficient) to assess the strength and direction of the relationship between two variables. For concurrency validity, look at the correlation between the test or measurement and the concurrency criterion. To obtain predictive validity, test results are used to predict future outcomes and evaluate the accuracy of the prediction.
Application of Criteria Validity in Excel
- Filter Data: Criteria validity allows users to filter data based on specific conditions, refining datasets for analysis.
- Conditional Formatting: It helps apply formatting rules to cells based on defined criteria, highlighting important information.
- Data Validation: Criteria validity ensures that data entered into cells meets specific criteria, maintaining data integrity.
- SUMIF Function: It enables users to sum values in a range that meet specific criteria, providing tailored calculations.
- COUNTIF Function: It counts the number of cells within a range that meet given criteria, aiding in data analysis.
- AVERAGEIF Function: It calculates the average of cells that meet specified criteria, offering insights into data trends.
You may be interested:
