Profit margin is a crucial metric for evaluating business profitability and financial health. Understanding and calculating profit margin in Excel allows businesses to quickly assess performance, identify cost-saving opportunities, and make strategic pricing decisions. By mastering profit margin analysis, you empower your financial reporting with clarity and precision. Use Excel’s built-in formulas to streamline your calculations and gain a competitive edge through informed decision-making.
- What is Profit Margin?
- How to use Profit Margin in Excel?
- Why Use Profit Margin in Excel?
- What is Net Profit Margin and what are the key consideration of it?
- How to calculate Net Profit Margin in Excel?
- What is Gross Profit Margin?
- How to use Gross Profit Margin in Excel?
- What is Operating Profit Margin?
- How to use Operating Profit Margin in Excel?
1. What is Profit Margin?
The financial distribution of a company’s profits to earnings ratio is known as profit ratio. The fraction represents the portion of sales that are retained as profits, deducted from various expenses. Greater profit margin results in greater profitability. Profit margins can be classified into different categories, each with its own cost base these are:
- Net Profit Margin
- Gross Profit Margin
- Operating Profit Margin
2.How to use Profit Margin in Excel?
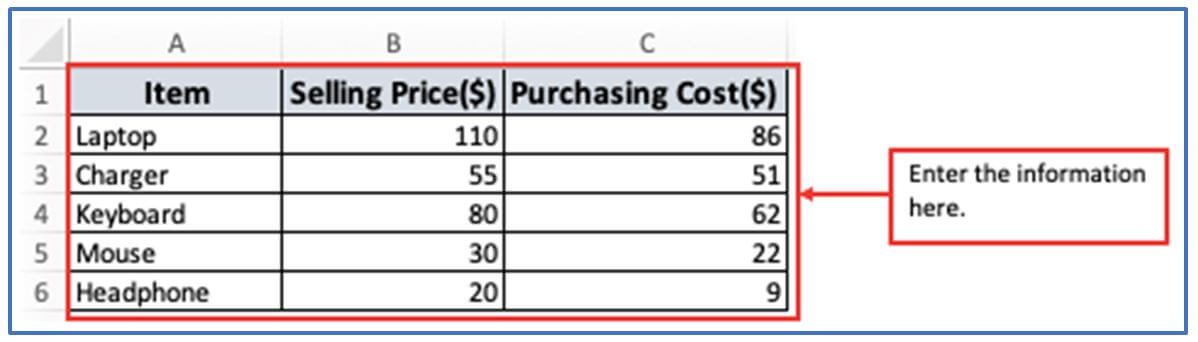
Step 1: Here given Some electronics products, purchasing cost and selling price. Now, enter the below information into your Excel sheet.
Inputting the information here.
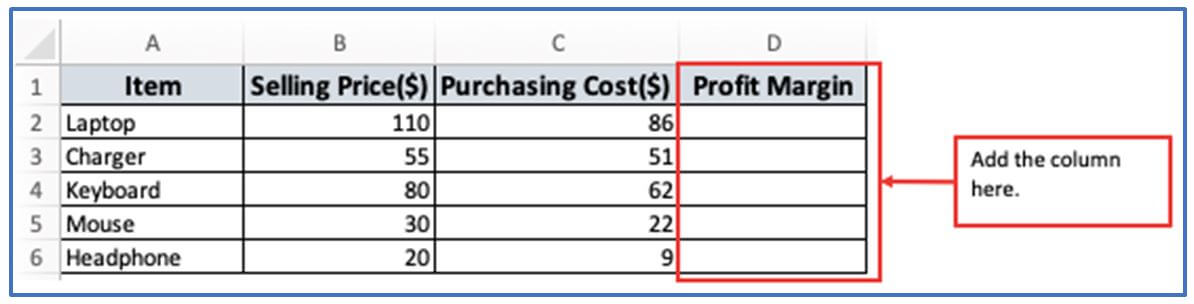
Step 2: Add the column in D1:D6 to get them Profit Margin there.
The columns have been added here.
Step 3: Use the Profit Margin formula. The formula: =(B2-C2)/B2
Applying the formula here.

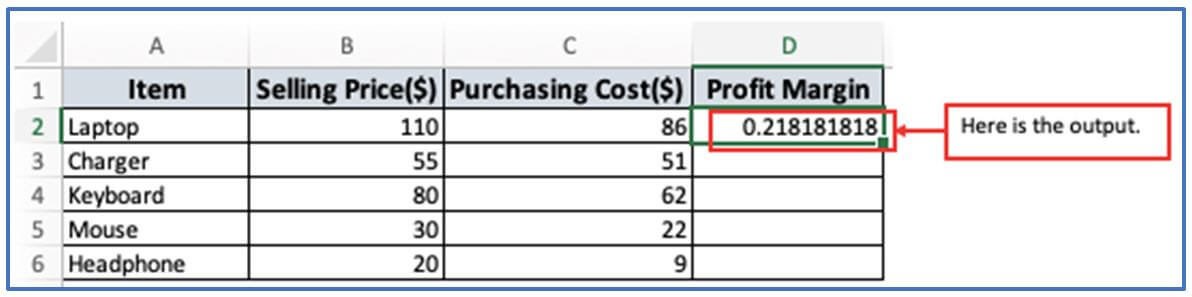
Step 4: After using the formula press enter and you will get the result of Profit Margin.
Here is the result below.
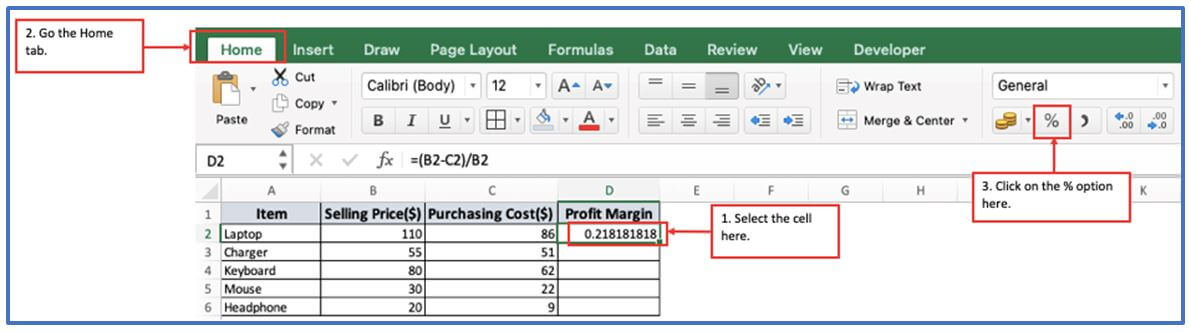
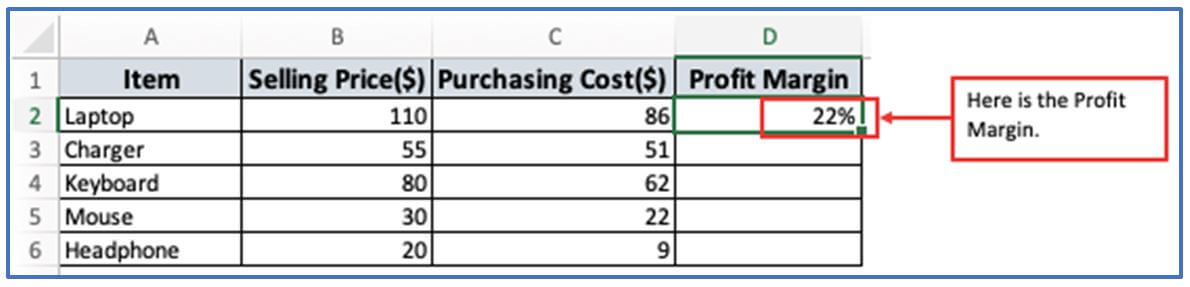
Step 5: Now, you need to convert Profit Margin into Percentage. For this select the cell D2, go to them home tab>select the % option here.
The above-mentioned information is followed below.
Step 6: Here is the output after clicking on the % option.
Profit Margin is outlined below.
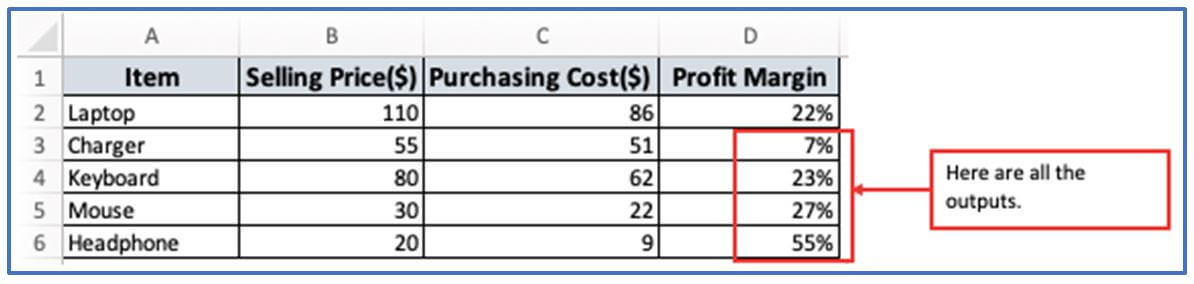
Step 7: For getting rest of the outputs use them same formula from step 3 or Drag-down the cursor from D2.
Here are all the Profit Margin outputs.
3. Why Use Profit Margin in Excel?
- Quick calculations and manual tasks.
- Easy-to-use formula: Excel can easily implement a net profit margin formula Once you have set up, update your net profit and total sales, the calculation will be done automatically.
- Large Data Record Efficiency: When dealing with historical financial data or data for multiple business units, you can apply formulas consistently across all rows, which is much quicker and more efficient than manually calculating.
- A comparison of trends over time:
- Observing the performance: Historical Net Profit and Total Sales Data can be calculated for different periods (monthly, quarterly)
- Visualization: Chart or graph function allows you to create a tie diagram to visualize how net profits tend over time It may assist in identifying whether the profit is higher, lower or seasonal.
- A comparison and assessment:
- Comparison of different business units or products: With Excel, you can determine the net profit ratio for each segment of your business and identify the area with the lowest profitability.
- Points of comparison for Competitors or Industrial Average: Access Excel’s average net profit ratio by your competition or industry, and measure your company against these benchmarks. The relative profitability can be assessed through this.
- Analyzing and forecasting potential scenarios:
- Impact of modifications: The creation of an “if” scenario is feasible in Excel. By modifying income forecasts or assuming spending, you can immediately observe how these changes will impact profit margin. Financial planning and risk assessment greatly benefit from this.
- The introduction of upcoming earnings: Excel can provide a list of net beneficiaries for the next stages by using data from previous years and providing assumptions about future income and expenses.
- Incorporated into various financial analysis:
- To build a complete financial model: In Excel, the net profit margin plays a crucial role in managing complex financial models, such as evaluating updated cash flow or ratio analytical control panels.
- Income account data link: By connecting your net profit margin to your data containers in the income report, you can ensure accurate reporting and update it whenever you modify fundamental financial information.
- Clarity in language and presentation:
- Detailed information available: By utilizing an organized formatted Excel, you can view net margin figures in conjunction with basic income and cost.
- Stakeholders’ visualization: By using Excel-generated graphics, it is possible to effectively convey trends and compare profits with management, investors, and other stakeholders.
4. How to calculate Net Profit Margin in Excel?
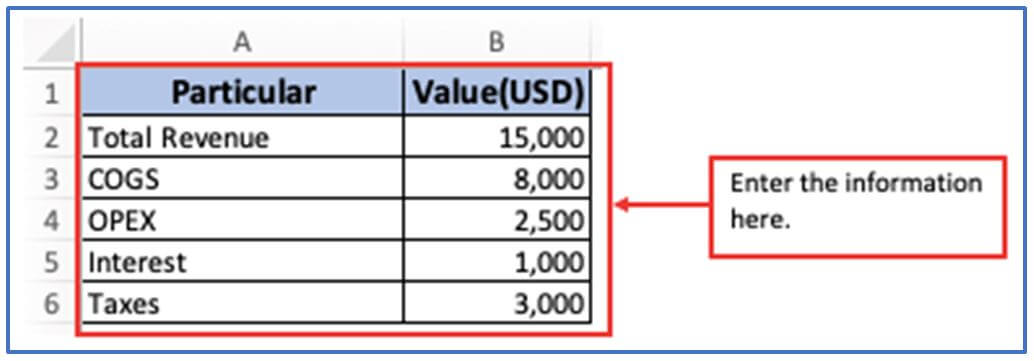
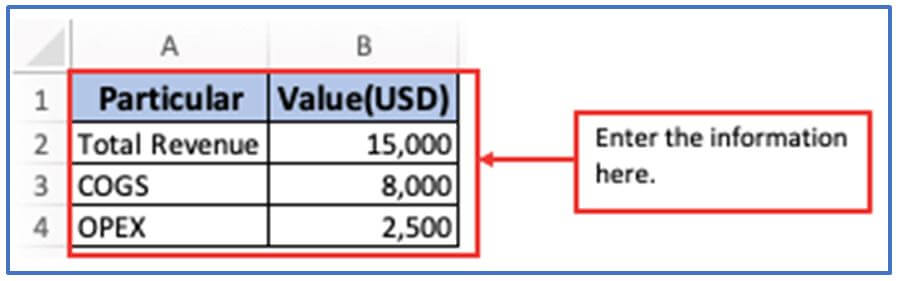
Here given,
Total Revenue= $15,000
COGS(Cost of Goods sold)=$8,000
OPEX(Operating expenses)=$2,500
Interest=$1000
Taxes=$3,000
Step 1: Create a data table first with the above information.
The above information has been placing below.
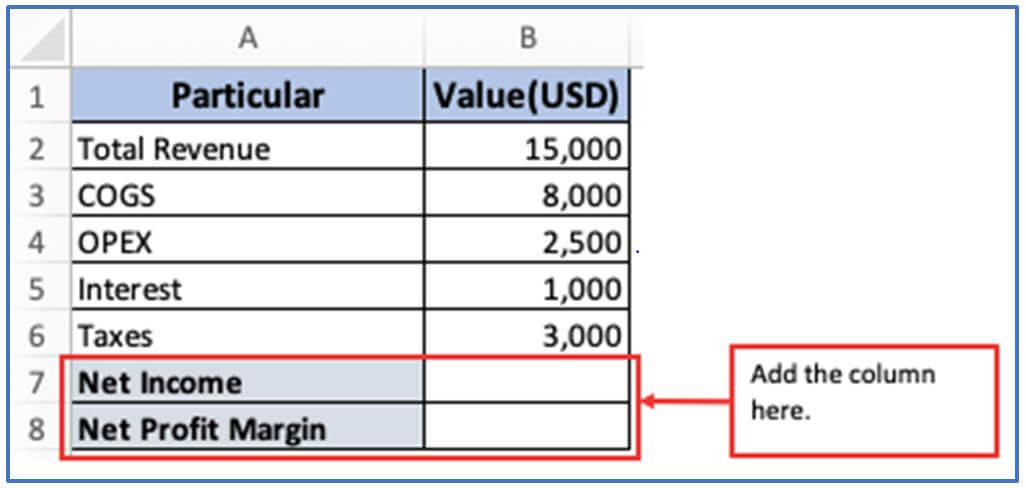
Step 2: To get the net profit margin, first you need to find the net income. Now, add the column in A7,A8 and B7,B8 to get the Net Income and Net Profit Margin there.
The columns have been included here.
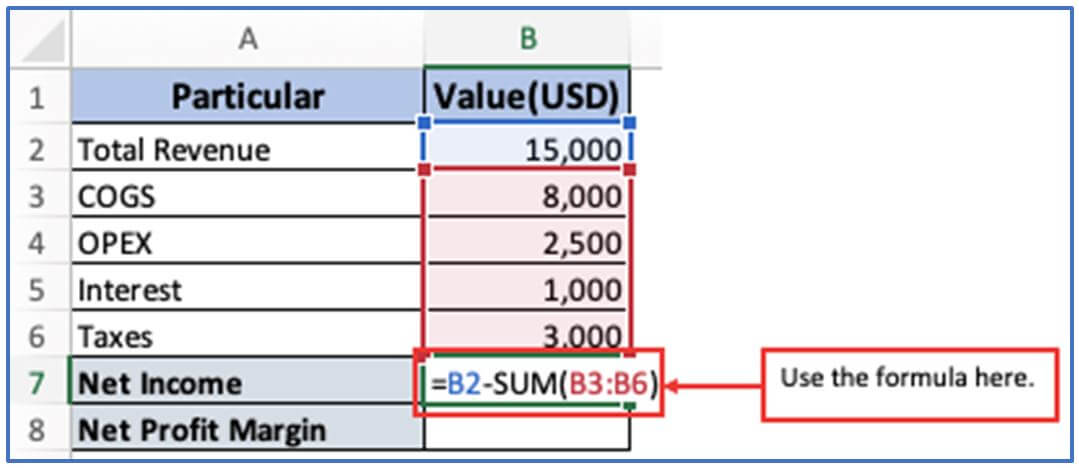
Step 3: Enter the Net Profit formula now. The formula: =B2-SUM(B3:B6)
Add them following formula you can see.
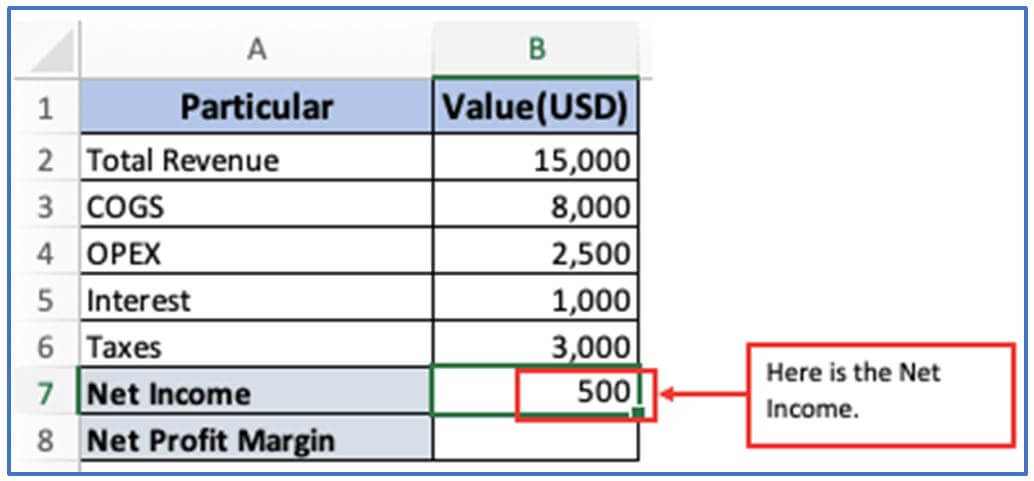
Step 4: In the end, click the enter button to get the Net Income amount.
Here is the Net Income is outlined below.
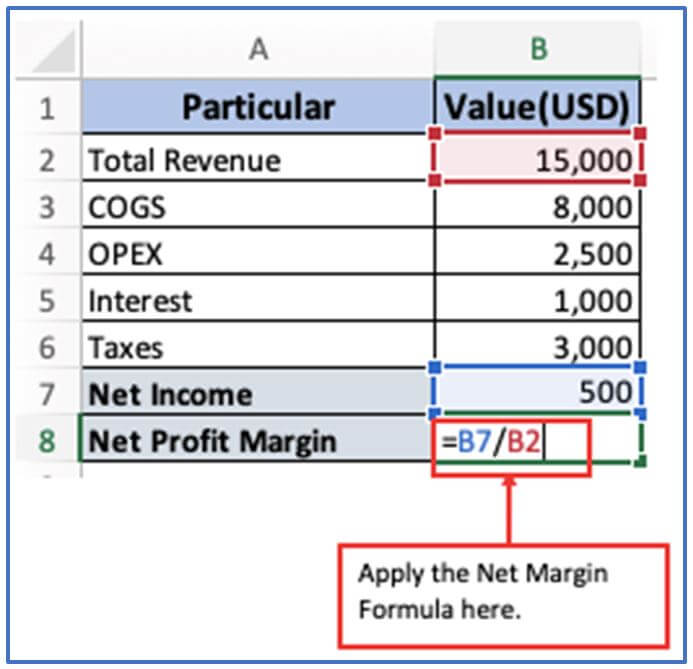
Step 5: For getting the Net Profit Margin divide the Net income(B7) by Total Revenue(B2). you need to use this formula. Formula: =B7/B2 or =(B2-SUM(B3:B6))/B2
Using the Net Profit Margin formula below.
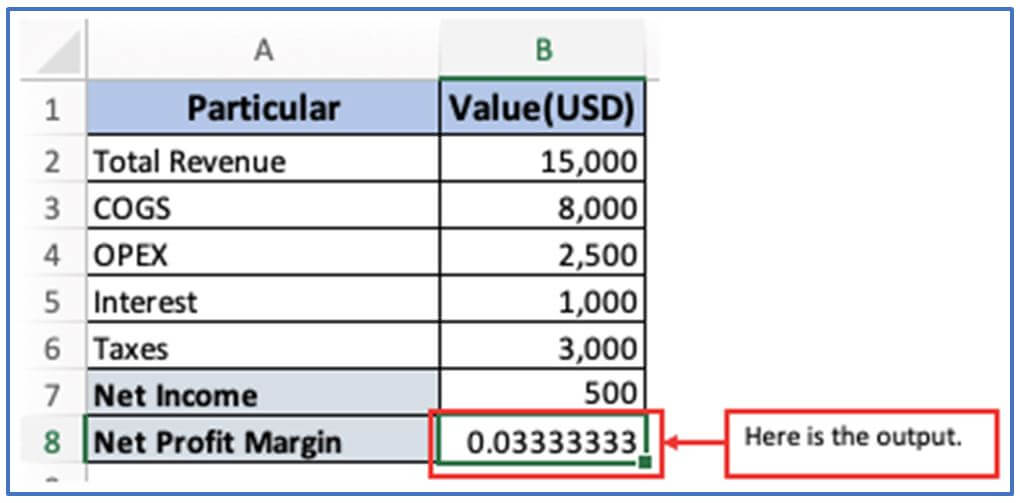
Step 6: Now, press Enter.
You can see is the Net Profit Margin is 0.333.
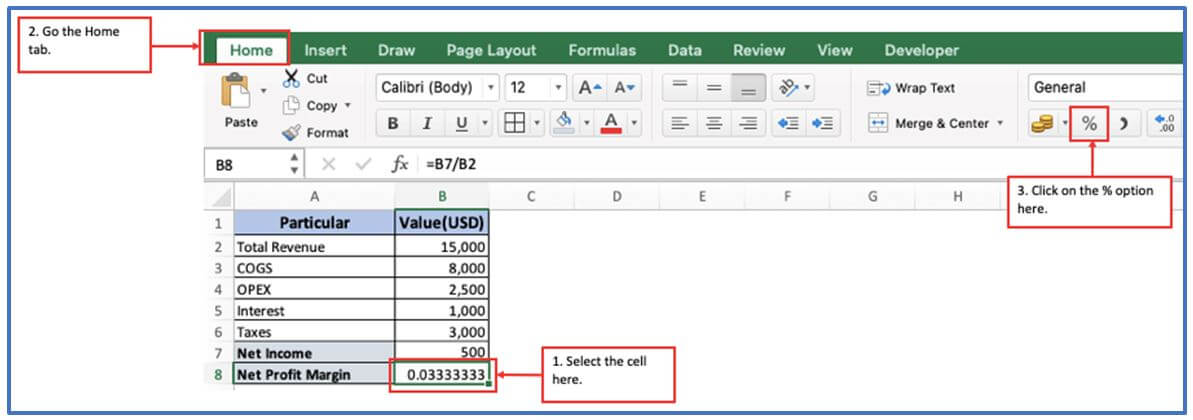
Step 7: Now, select the cell(B8) then go to them Home tab to convert Net profit Margin(B8) into percentage and click on “%” option there.
Following them above instructions below.
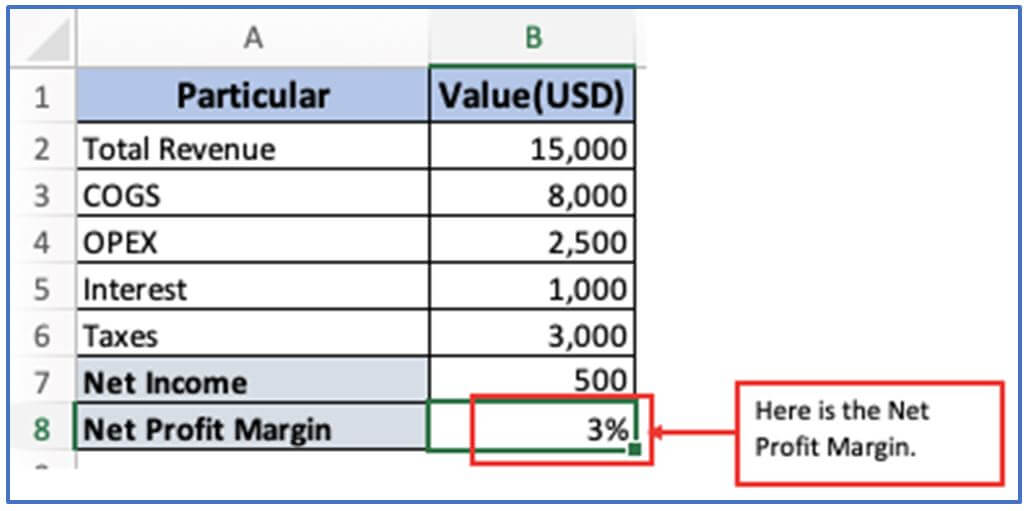
Step 8: After clicking on the % option here is the final output.
Here is the Net profit Margin which is 3%.
5. What is Net Profit Margin and what are the key consideration of it?
Net profit ratio is a financial relationship that measures a company’s profitability by deducting the percentage of remaining income after all operating costs, interest, taxes and preferred stock dividends. The main point is the measure of a company’s profitability in terms of sales.
- View Overall Stability: The measurement is comprehensive and encompasses all expenses.
- Listed as a percentage: This promotes profitability in various periods, businesses, and even industries (but industry comparisons should be performed with caution)
- Generally high: When the net profit margin increases, the company’s ability to convert costs into profits is enhanced.
- Key Investor Indicators: Investors frequently consider net profit margins as a means of evaluating the financial health and efficiency of an organization.
- A trend can be shown: The pursuit of net profit margin over the course of Hours can be a measure of whether or the company is.
6. What is Gross Profit Margin?
The profitability ratio, which measures the percentage of sales that are deductible from COGS sold, is known as Gross Profit Margin. In essence, it demonstrates the overall return earned by an organization’s core business operations, taking into account other operating expenses, interest, and taxes.
7. How to use Gross Profit Margin in Excel?
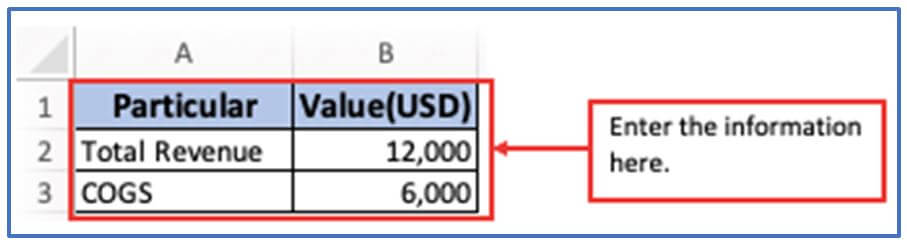
Step 1: Here taken, Total Revenue is $12,000 and Cost of goods sold(COGS) is $6,000.
Enter the data into an Excel spreadsheet to get an organized table of data as shown in the image.
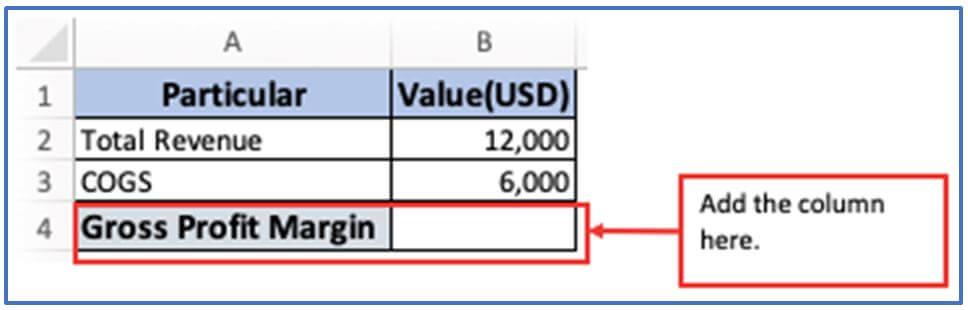
Step 2: Now add the column in A4 and B4 to get the Gross Profit Margin result there.
Column has added here.
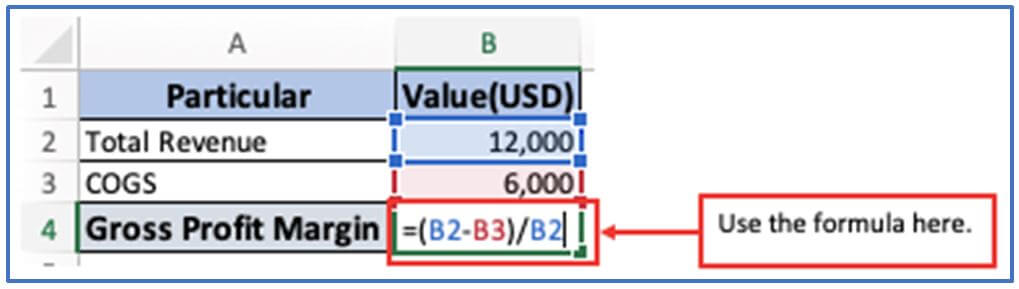
Step 3: Based on the Excel spreadsheet column, you need to use the formula.
The formula is: =(B2-B3)/B2
Applying the formula below.
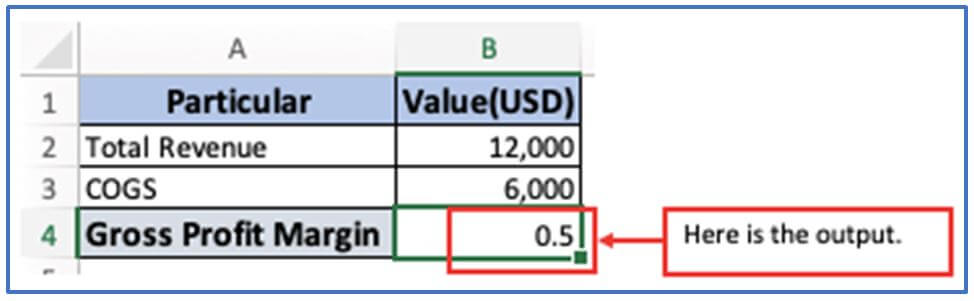
Step 4: Now, press Enter and you will get the result.
The result is shows in the image.
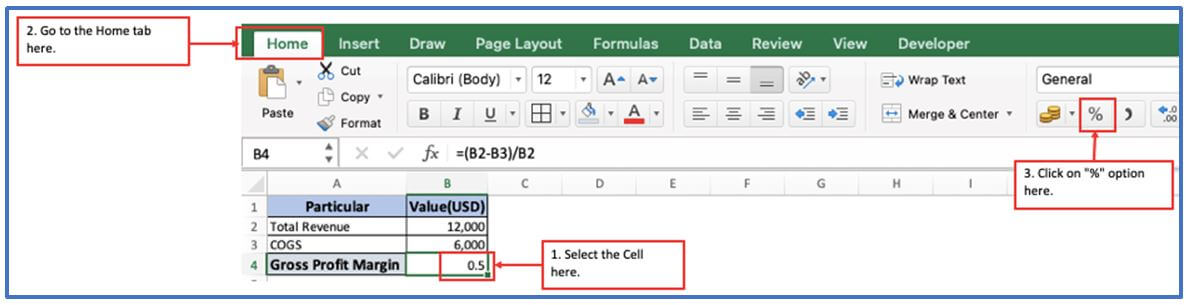
Step 5: Now, you need to convert Profit Margin into Percentage. For this select the cell B4, go to them home tab>select the % option here.
The above-mentioned information is followed below.
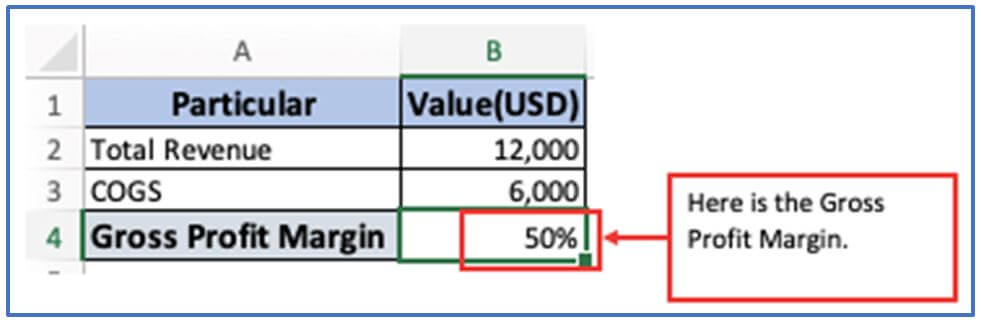
Step 6: Here is the output after clicking on them % option.
Gross Profit Margin is outlined below.
8. What is Operating Profit Margin?
Operating profit margin (OPM), also known as EBIT margin or OPM, is a measure of profitability, which refers to the percentage of profit earned from pursuing underlying activities before interest and income tax deductions are factored in. Essentially, it shows how much profit a company is achieving from its key business activities with every income A higher operating profit margin generally indicates that a company is efficient in its business and its operating costs are managed appropriately
9. How to use Operating Profit Margin in Excel?
Step 1:</st irong> Enter the data into an Excel spreadsheet to get an organized table of data as shown in the image.
You can follow the below example.
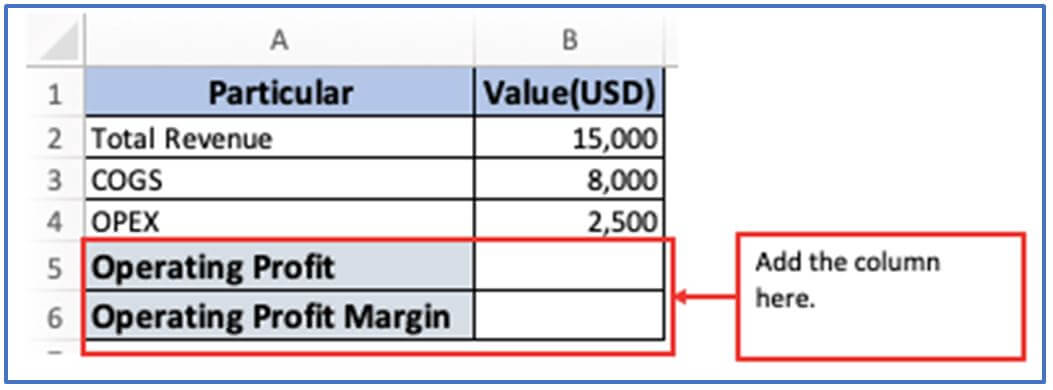
Step 2: First you need to figure out the Operating Profit to get the Operating Profit Margin. Now add the column A5,A6 and B5,B6 to get the Operating Profit and Operating Profit Margin there.
Columns have added here.
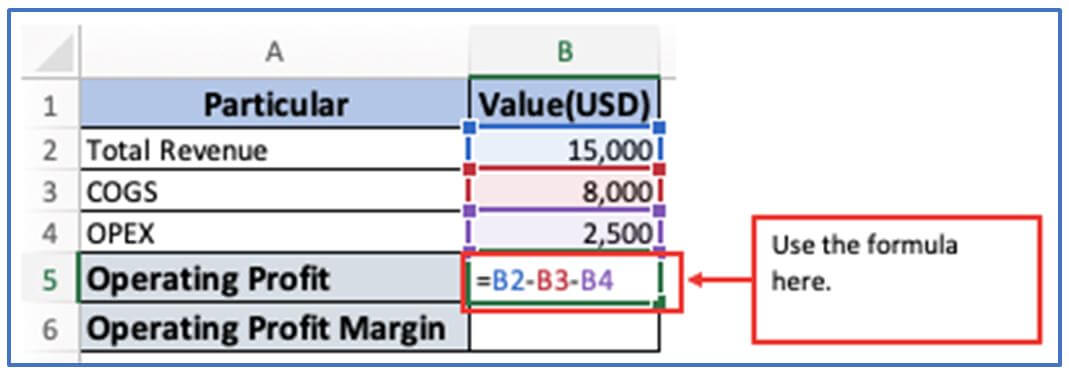
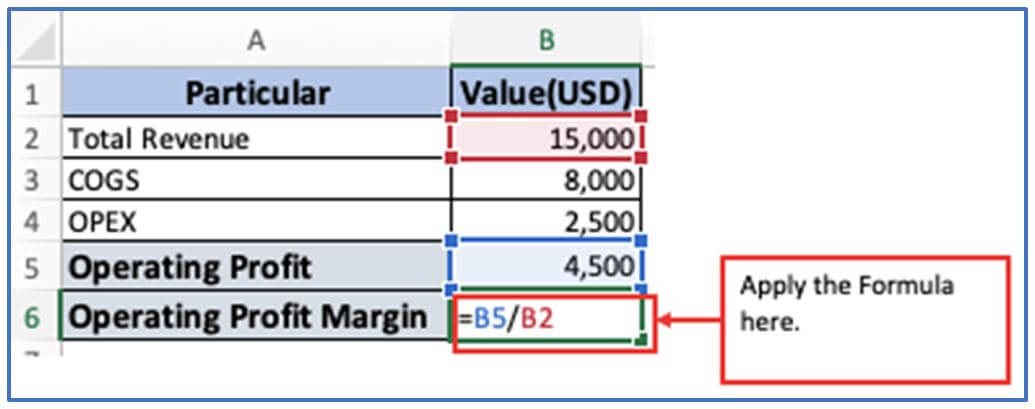
Step 3: Now, use the Operating Profit Margin formula.
Formula: =B2-B3-B4
You can see below the formula is used in the image.
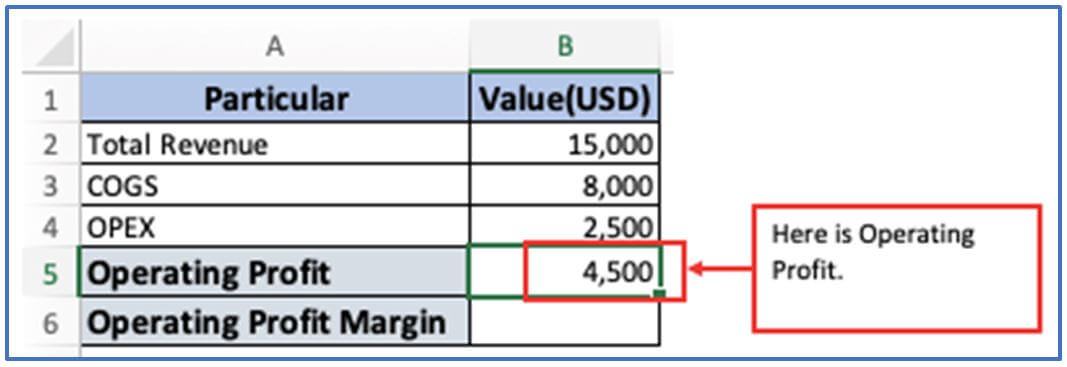
Step 4: After Entering the formula then press on enter.
Here is the result of Operating Profit.
Step 5: Now, divide the Operating Profit by Total revenue for getting the Operating Profit Margin.
The formula: =B5/B2 or =(B2-B3-B4)/B2
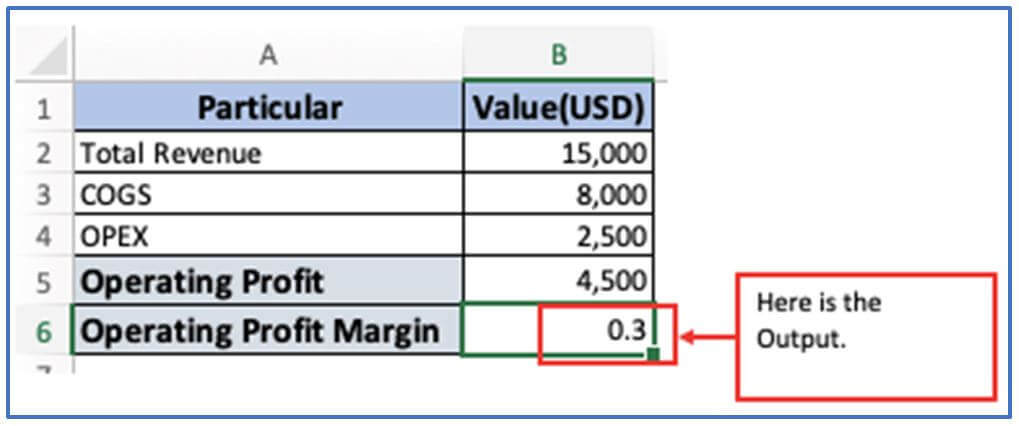
Step 6: Now, press Enter.
You can see is the Operating Profit Margin is 0.3.
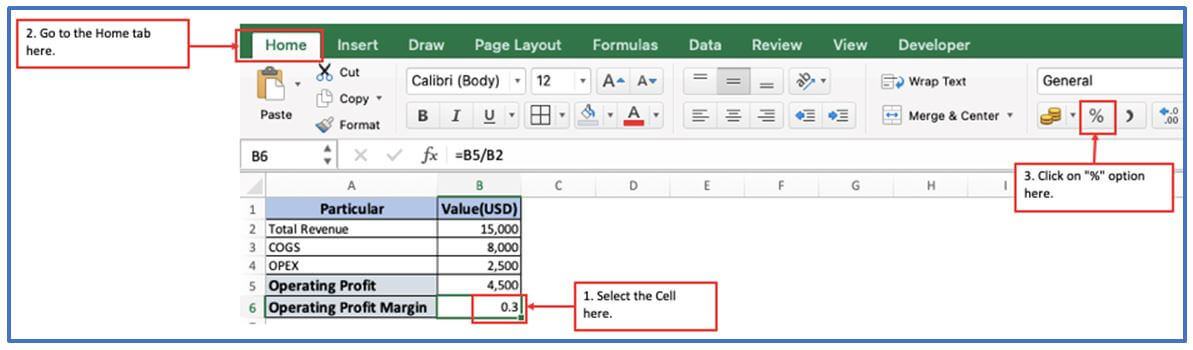
Step 7: Now, select the cell(B6) then go to them Home tab to convert Operating profit Margin(B5) into percentage and click on “%” option there.
Following them above instructions below.
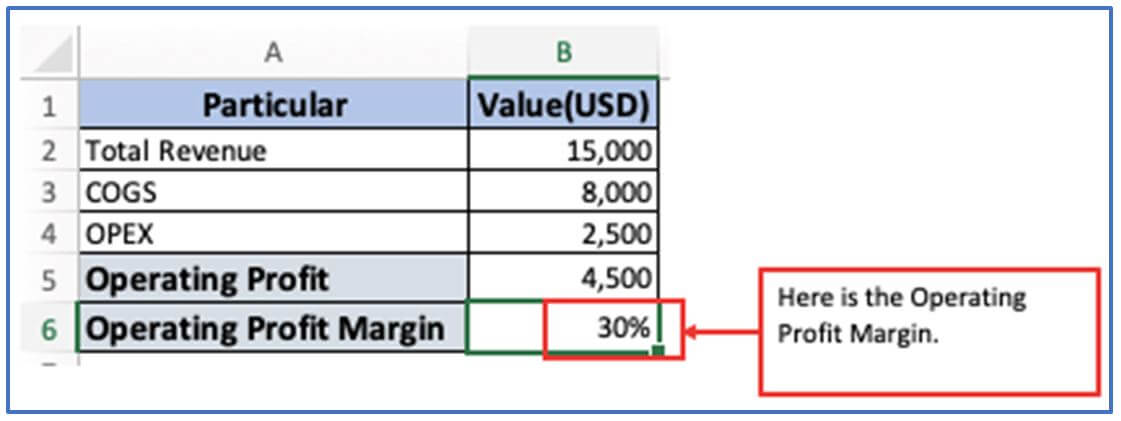
Step 8: After clicking on the % option here is the final output.
Here is the Operating Profit Margin which is 30 %.
Application of Profit margin in Excel
-
Evaluate Business Performance: Calculate profit margin to measure how efficiently a business converts revenue into profit.
-
Compare Product Profitability: Analyze different products or services to determine which ones yield higher margins.
-
Financial Forecasting: Use historical profit margin data to project future earnings and plan budgets.
-
Pricing Strategy Optimization: Adjust pricing based on margin calculations to ensure profitability while remaining competitive.
-
Cost Management: Identify areas of high cost that reduce margins and make informed cost-reduction decisions.
-
Investor Reporting: Create clear reports showcasing profit margins to stakeholders and investors for better transparency.
For ready-to-use Dashboard Templates:
