Sales dashboards are invaluable assets in the quest to drive business growth, offering a dynamic blend of insights and foresight. Here we unveil a curated list of the most effective sales dashboard designs that stand as the compass for navigating market trends and customer behavior. These sales dashboards, with their intuitive layouts and actionable data visualizations, are not just tools but game-changers, empowering sales teams to transform raw data into a strategic roadmap for success. Discover how these top-tier examples and templates can revolutionize your sales strategy, sharpen your competitive edge, and propel your business to new heights.
The Anatomy of an Effective Sales Dashboard
An effective sales dashboard is much more than a mere display of numbers; it’s a strategic tool designed to guide decision-makers through the complexities of sales data with clarity and insight. The essential features of a sales dashboard pivot around interactivity, real-time data updates, customization, and goal tracking. Interactivity allows users to drill down into metrics for deeper analysis. Customization is also paramount; a dashboard must cater to the specific needs of its users. Goal tracking is another indispensable feature; Gartner highlights that dashboards that visually track progress against targets significantly enhance the likelihood of meeting and exceeding those targets.
Visualization plays a pivotal role in the utility of a sales dashboard. It’s not just about presenting data; it’s about presenting it in a way that tells a story. Charts, graphs, and heat maps translate complex data sets into intuitive visuals, making trends and patterns immediately apparent.
The anatomy of an effective sales dashboard, therefore, is a blend of these essential features and the smart use of visualization. It’s about turning data into a compelling narrative that can drive strategic actions and, ultimately, business growth.
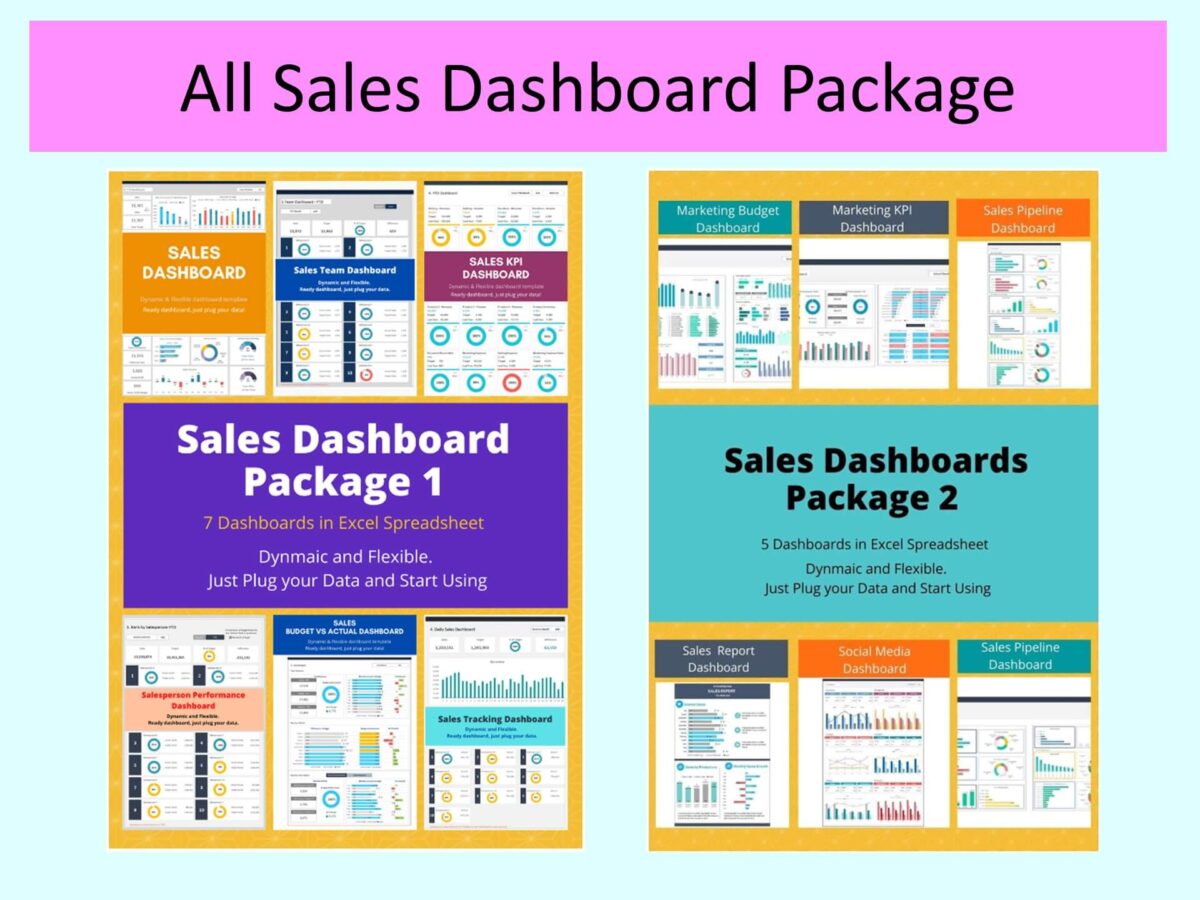
Sales Dashboard Examples and Templates
1. Sales Dashboard Template
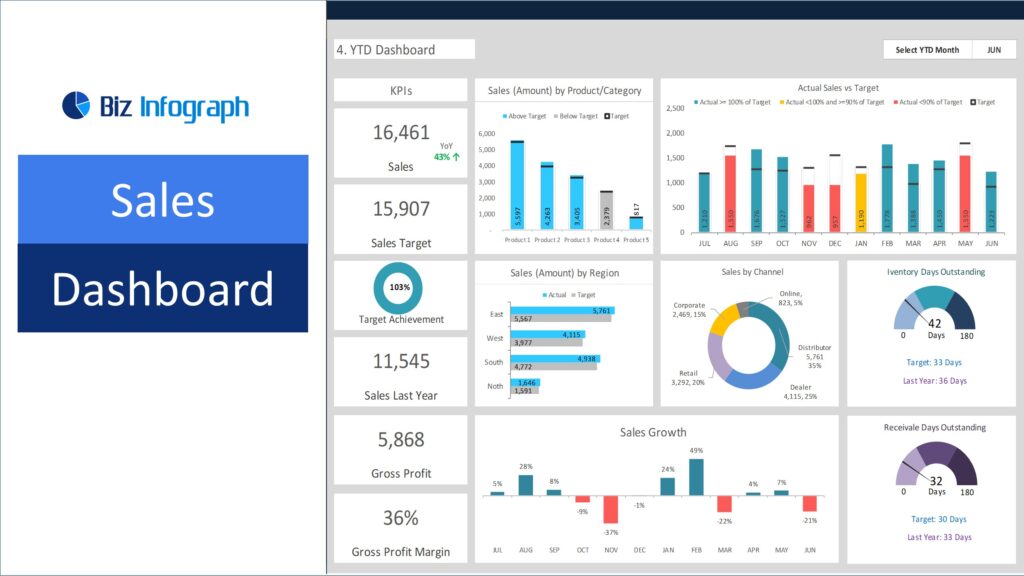
A sales dashboard serves as the nerve center for a sales team, providing an at-a-glance view of performance against key objectives. Its purpose is to distill complex sales metrics into actionable insights, allowing for quick assessment and strategic decision-making. It acts as a compass, pointing sales leaders towards areas that need attention or opportunities ripe for pursuit.
Sales Dashboards Important Metrics
The metrics displayed on a sales dashboard typically include:
· actual vs. budgeted sales
· sales by category or product
· monthly sales achievements
· sales growth year-over-year or month-over-month
· and sales by distribution channel
These metrics offer a comprehensive view of sales health and trajectory, enabling teams to measure performance across multiple dimensions.
Best Practices for Implementation
When implementing a sales dashboard, best practices include setting clear objectives for what you aim to track, ensuring data accuracy, regularly updating the dashboard, and making it accessible to all stakeholders. The dashboard should be user-friendly and designed with the end-user in mind, focusing on visual clarity and minimizing information overload.
2. Budget vs Actual Sales Dashboard
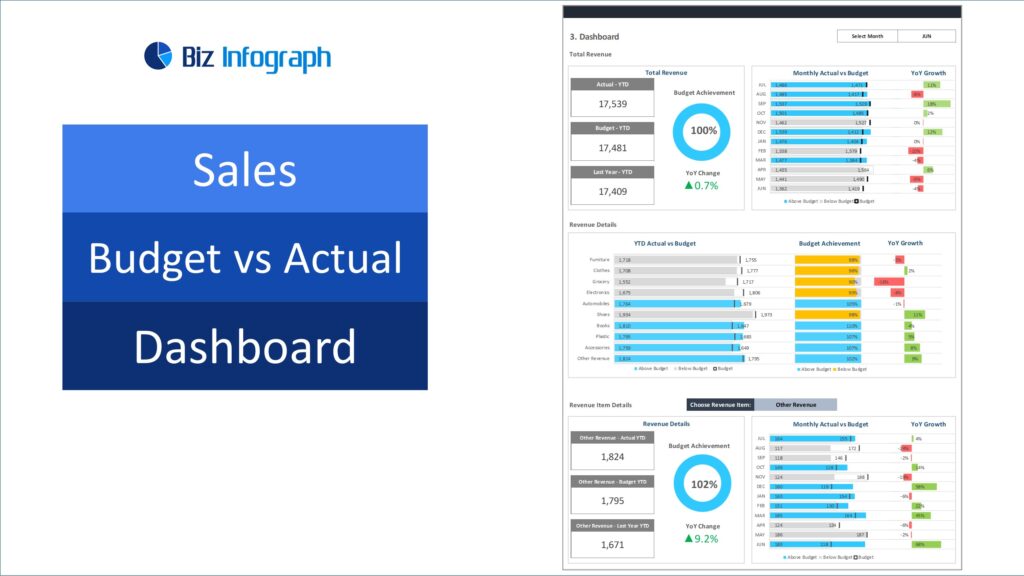
Importance of Budgeting in Sales
Budgeting is the financial blueprint for a company’s sales strategy, essential for setting realistic goals and benchmarks. A budget vs actual sales dashboard provides a critical comparative view that helps companies measure their financial health and strategic adherence. This dashboard is pivotal in enabling businesses to respond proactively to market conditions and align sales efforts with financial targets.
Metrics to Track and Compare
· Total Sales for the Month vs Budgeted Sales
· Year-to-Date (YTD) Actual Sales compared to Budget
· Monthly Budget Achievement Percentage
· Revenue Details, including Budget Achievement and Growth Rates
· Breakdown of Sales Variances by Product or Service Line
· Forecasted vs Actual Profit Margins
· Cumulative Budget Performance over the Fiscal Year
These metrics allow for a comprehensive analysis of performance and are vital for course-correcting and refining sales strategies.
Visualization Techniques
To effectively convey the data, visualization techniques such as variance charts, bar graphs contrasting actual and budgeted figures, and line charts for trend analysis are commonly used. Conditional formatting can highlight areas that exceed, meet, or fall short of budget expectations, and gauge charts can represent progress towards sales targets. Interactive elements may allow users to delve into specific data points for a granular analysis.
3. Sales KPI Dashboard
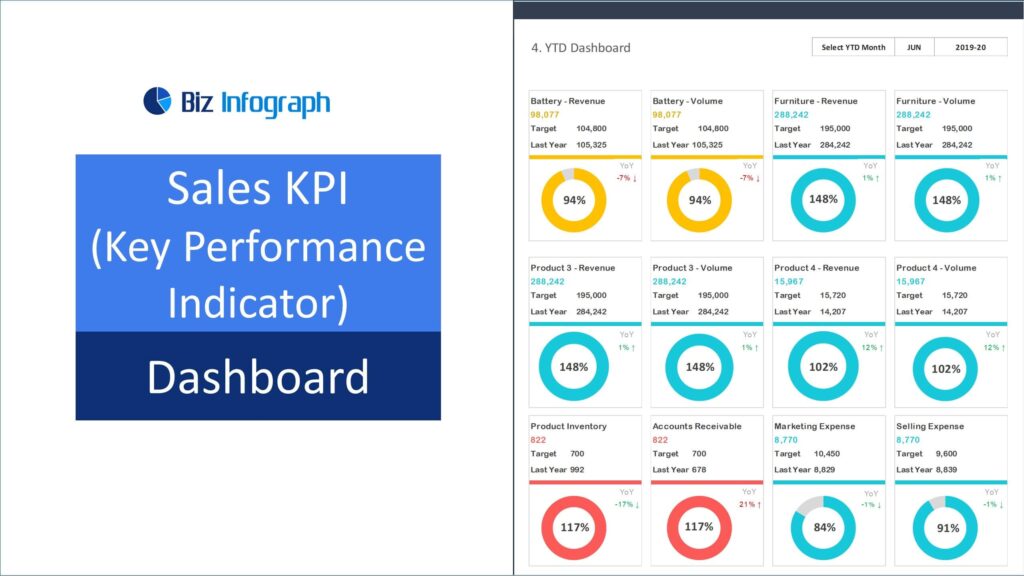
Defining Sales KPIs
Sales Key Performance Indicators (KPIs) are metrics that gauge the effectiveness and success of a sales team’s activities. Sales KPI Dashboard provides quantifiable measures of performance, directly tied to sales goals and overall business objectives. Accurate KPIs offer insights into the sales process, helping identify strengths and pinpoint areas that require improvement.
Selecting the Right KPIs to Create Sales Dashboard
Choosing the right KPIs for a sales dashboard is critical and should align with the strategic goals of the organization. Common sales KPIs include conversion rate, average deal size, sales cycle length, and customer lifetime value. The selection should also consider the sales funnel stages and the specific actions and outcomes each sales activity aims to influence.
Customization Tips
When customizing a sales KPI dashboard, it’s important to:
· Prioritize clarity by displaying KPIs that provide direct value to the user.
· Use segmentation to provide detailed insights into different markets, products, or teams.
· Incorporate trend lines or comparative data to contextualize performance over time.
· Ensure that the dashboard is scalable and can evolve with the changing needs of the business.
4. Sales Team Dashboard
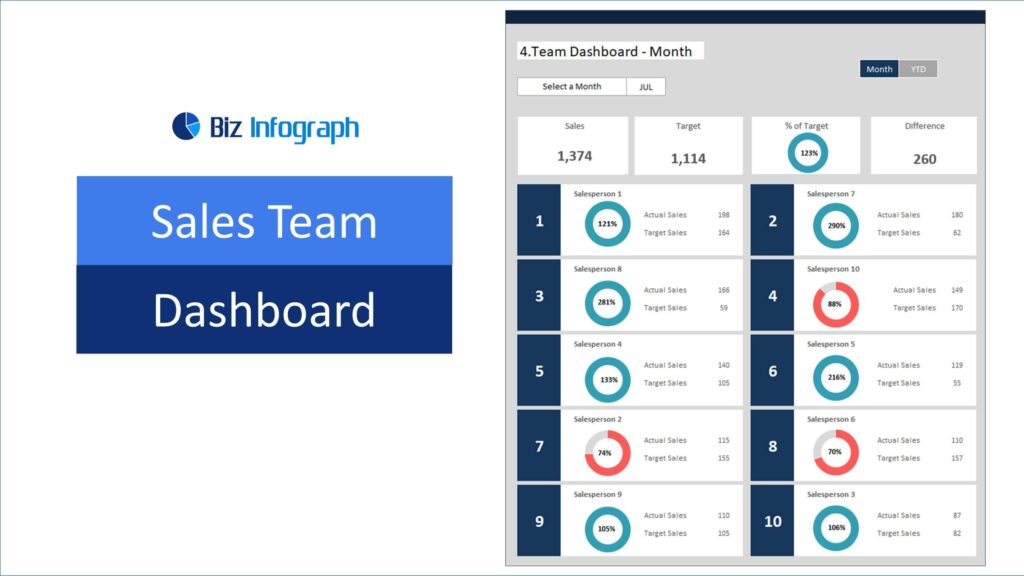
Enhancing Team’s Sales Performance through Dashboards
Sales team dashboard is instrumental in fostering a culture of continuous improvement and accountability. By providing a unified view of performance metrics, these dashboards enhance transparency and enable teams to collaboratively focus on achieving collective goals. They act as a catalyst for performance by allowing team members to monitor their progress and benchmark against team averages or top performers.
Metrics for Team Evaluation
Key metrics for evaluating a sales team typically include:
· Individual and team sales quotas and achievements – Sales leaderboard
· Lead conversion rates
· Call-to-close ratios
· Customer acquisition costs
· Sales cycle lengths
· Customer satisfaction and retention rates
· Revenue per sales rep
Collaboration and Dashboard Access
To maximize the effectiveness of a sales team dashboard, it’s crucial to ensure it is collaborative and easily accessible. This means:
· Providing real-time access to relevant data for all team members
· Enabling features that allow team members to update their progress
· Setting up alerts and notifications for milestones or performance deviations
5. Sales Tracking Dashboard
Real-Time Tracking and Its Importance
Real-time tracking in sales dashboards is crucial for maintaining a pulse on the business’s day-to-day operations. The dashboard helps for immediate response to trends, issues, or opportunities, ensuring that sales strategies are agile and data-driven. This instant visibility into sales activities helps managers and teams to stay proactive, align resources efficiently, and make informed decisions promptly.
Dynamic Metrics for Sales Tracking
A comprehensive sales tracking dashboard should include a variety of dynamic metrics such as:
· Daily Sales Achievement: Tracks sales figures against daily targets, offering insights into daily performance trends.
· Monthly Sales Achievement: Compares monthly sales figures to targets, providing a broader view of performance over a longer period.
· Rank by Salesperson – Monthly and Year-to-Date (YTD): Ranks salespeople based on their sales achievements, fostering a competitive and motivated sales environment.
· Summary Report: Offers an overview of sales performance, highlighting key metrics and insights that are crucial for strategic planning.
· Salesperson Report: Provides detailed performance metrics for individual salespeople, aiding in personalized coaching and development.
These metrics provide a multifaceted view of sales activities, empowering businesses to track progress, identify areas of improvement, and recognize outstanding performance effectively.
6. Salesperson Performance Dashboard
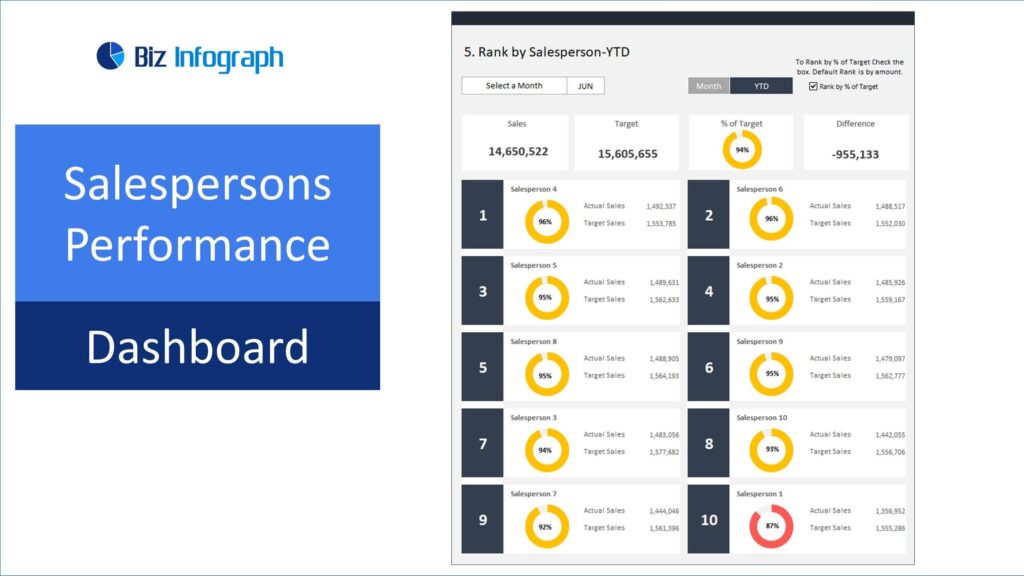
Individual Sales Performance Dashboard Metrics
Individual performance metrics on a salesperson performance dashboard are pivotal in providing a clear picture of each salesperson’s contributions. Metrics such as sales volume, conversion rates, average deal size, customer retention rates, and time spent on each sale offer a detailed analysis of performance strengths and areas needing improvement. These metrics not only help in evaluating sales representative performance but also in setting personalized goals and benchmarks.
Motivating Sales Personnel with Data
Data-driven motivation is about leveraging the insights from a salesperson performance dashboard to inspire and energize the sales team. Recognizing achievements, setting realistic and challenging targets, and providing clear pathways for growth and development can significantly boost morale. When sales personnel see a direct correlation between their efforts and the data on the dashboard, it reinforces positive behaviors and fosters a culture of accountability and continuous improvement.
Customization for Individual Analysis
Customization is key to making a salesperson performance dashboard truly effective. Tailoring the dashboard to display relevant metrics for each individual allows for a more focused analysis and personal development plan. This could involve setting individual KPIs, incorporating personal targets, or even personalizing the dashboard’s visual layout to suit the preferences of each salesperson. Customization ensures that each team member receives insights that are directly applicable and beneficial to their unique sales approach and strategy.
7. Sales Pipeline Dashboard
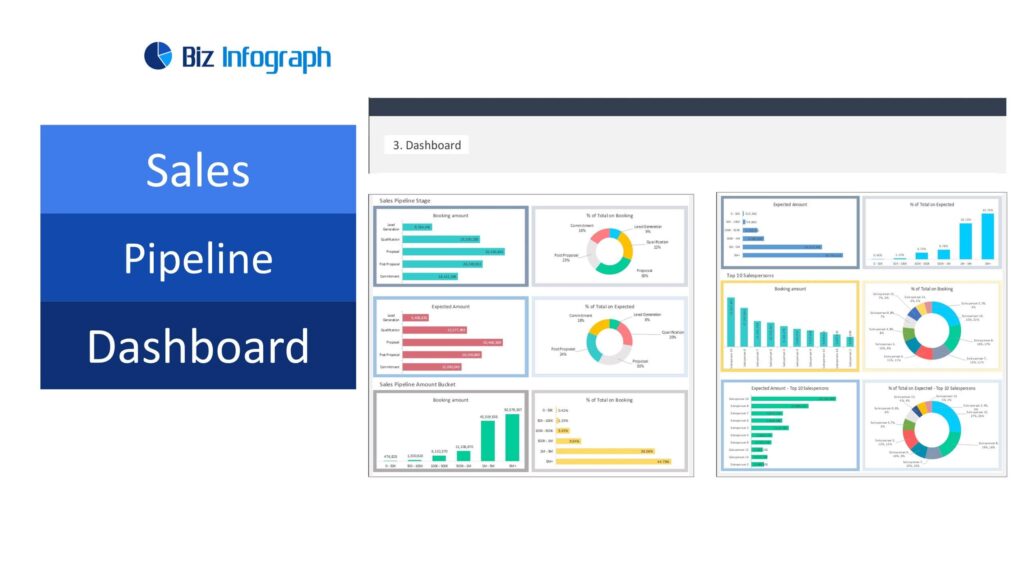
Stages of the Sales Opportunities Pipeline
A sales pipeline dashboard vividly represents the different stages of the sales process, from initial contact to the closing of a deal. These stages typically include prospecting, initial contact, qualification, proposal, negotiation, and closure. Understanding each stage allows sales teams to systematically manage and nurture leads, ensuring no potential sale falls through the cracks.
Tracking Sales Cycle Progress through the Pipeline
Effective tracking of progress through the sales pipeline is crucial for maintaining momentum and ensuring a consistent flow of sales. A sales pipeline dashboard provides real-time visibility into the status of various deals, sales conversions, highlighting bottlenecks and successes at each stage. This insight helps sales teams to prioritize their efforts, focus on promising leads, and swiftly address any issues that could impede progress.
Predicting Sales and Revenue
A sales pipeline dashboard is not just a tracking tool but also a predictive instrument. By analyzing the movement and conversion rates at each stage of the pipeline, sales managers can forecast future sales and revenue with a higher degree of accuracy. This predictive capacity enables better resource planning, informed decision-making, and strategic adjustments to the sales process, aligning it closely with market dynamics and business objectives.
8. Marketing Budget Dashboard
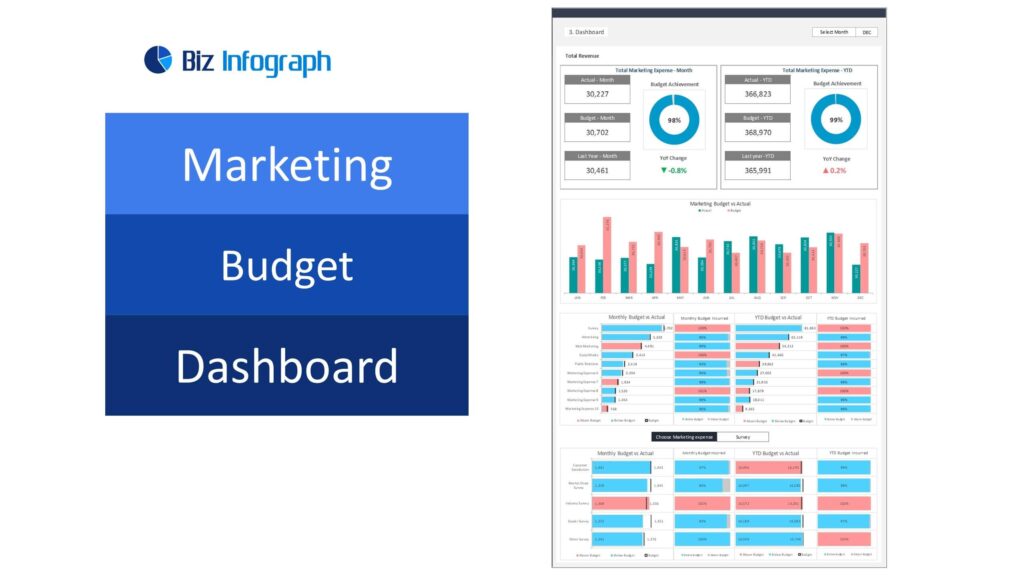
Overview of Marketing Budget Planning
Marketing budget planning is a strategic activity that aligns marketing initiatives with business goals while ensuring optimal allocation of resources. A marketing budget dashboard provides a clear, concise view of budget allocations, expenditures, and performance across various marketing channels. This holistic view is essential for ensuring that marketing efforts are cost-effective, targeted, and aligned with overarching business objectives.
Metrics for Budget Tracking
Effective budget tracking involves monitoring key metrics that provide insights into the utilization and performance of the marketing budget. Metrics on a marketing budget dashboard may include total budget vs actual spend, ROI by marketing channel, cost per lead, cost per acquisition, and campaign-specific performance metrics. These metrics offer a granular view of budget efficiency and campaign effectiveness, enabling marketers to make data-driven decisions.
Aligning Sales and Marketing through Data
A marketing budget dashboard plays a pivotal role in aligning sales and marketing efforts. By providing data on lead generation, customer acquisition costs, and marketing-driven sales, the dashboard fosters collaboration between the two departments. This alignment ensures that both sales and marketing are working towards common goals, using shared data to optimize strategies, and ultimately driving business growth in a cohesive manner.
9. Marketing KPI Dashboard
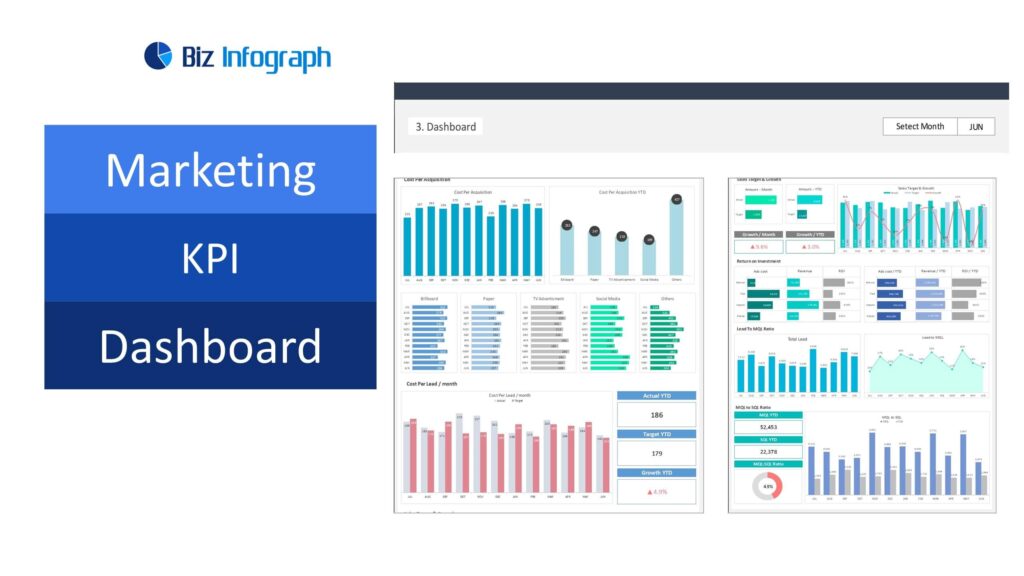
Key Marketing KPIs for Growth
Identifying and monitoring key marketing KPIs is essential for driving growth and measuring the effectiveness of marketing strategies. Essential KPIs on a marketing dashboard often include conversion rates, cost per lead, customer lifetime value, website traffic and engagement metrics, and social media engagement rates. These KPIs provide a comprehensive overview of marketing performance, highlighting areas that significantly impact growth and ROI.
Dashboard Design for Marketers
A well-designed marketing KPI dashboard should be intuitive, visually engaging, and tailored to the specific needs of the marketing team. It should prioritize clarity and simplicity, presenting complex data in an understandable format. Utilizing graphs, charts, and color coding can help in visualizing trends and making the data more actionable. Moreover, the dashboard should be customizable and scalable, allowing marketers to focus on metrics that are most relevant to their current objectives.
Actionable Insights from Marketing Data
The ultimate goal of a marketing KPI dashboard is to provide actionable insights that can drive marketing strategies and decisions. By presenting data in a structured and analytical manner, the dashboard should highlight opportunities for optimization, areas of underperformance, and trends that can inform future marketing initiatives. It should not only report on what has happened but also provide insights that marketers can use to proactively shape their strategies to achieve better outcomes.
10. Sales Report Dashboard – Sales Manager Dashboard
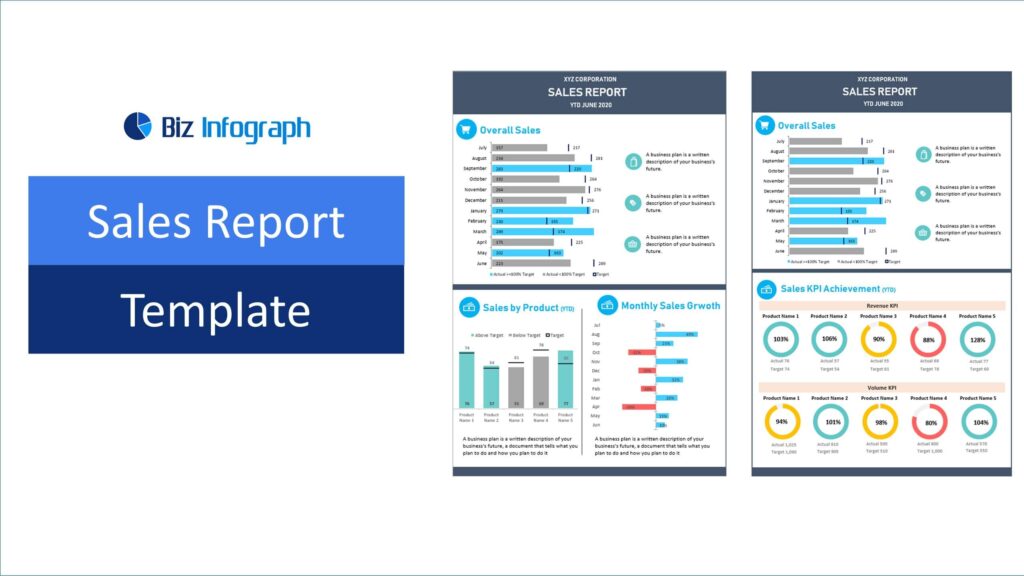
Consolidating Sales Data into Reports for Sales Managers
A sales report dashboard is a centralized platform where sales data is consolidated into comprehensive reports, providing a holistic view of sales performance. It typically includes sales analytics such as overall sales, sales by product or region, monthly growth rates, and the extent of sales KPI achievement. These reports offer a unified, detailed snapshot of sales activities, enabling businesses to track progress, pinpoint trends, and make informed strategic decisions.
Customizing Reports for Stakeholders
Customization is key to making sales report dashboards effective communication tools for various stakeholders, from sales reps to top-level executives. Tailoring reports involves highlighting the most relevant data for each audience, using visual elements that resonate with the viewer, and presenting data in a format that aligns with the stakeholders’ decision-making processes. Customized reports ensure that every stakeholder receives insights that are not only relevant but also actionable, thereby fostering informed discussions and strategic alignment across the organization.
Bringing It All Together
Integrating multiple dashboards into a unified system provides a comprehensive view of business operations, ensuring that decision-making is based on a holistic understanding of performance across various domains. A unified dashboard system consolidates insights, fosters alignment across departments, and accelerates strategic decision-making by presenting a cohesive picture of business health.
In this article, we’ve explored the top sales dashboards and how they can drive business growth by providing actionable insights into sales performance, market trends, and customer behavior. Adopting and customizing these dashboards to fit your business needs can lead to enhanced data-driven decision-making, streamlined operations, and ultimately, substantial business growth.
Leverage the power of these sales dashboards to transform your business’s data analysis and decision-making processes. If you need further guidance or customization to align these tools with your specific business context, consider reaching out for professional consultation services. Start harnessing the full potential of your data today to drive informed decisions and foster business growth.
To help businesses embark on their data-driven decision-making journey, Biz Infograph offers a range of professionally designed dashboards to simplify the data analysis process. From the best Excel dashboard templates to help companies visualize data to Executive Dashboards that businesses can utilize offer top-level leaders a comprehensive overview of the company’s performance, integrating critical metrics and data from various departments to aid in strategic decision-making and long-term planning.
Get in touch with us to use financial dashboard templates and make the right data-driven decisions!
For ready-to-use Dashboard Templates: