
Introduction to Quality Management Dashboards
Understanding the Role of Quality Dashboards in Quality Management
Quality control dashboards are vital tools in quality management, providing a visual representation of an organization’s quality metrics and performance indicators. They help businesses monitor, analyze, and enhance their product quality and project management processes. By utilizing a well-structured quality assurance dashboard, companies can identify areas for improvement, enforce quality standards, and ensure project compliance with set quality metrics. This comprehensive oversight aids in minimizing errors, reducing waste, and improving overall operational efficiency, leading to higher customer satisfaction and better market competitiveness.
Benefits of Implementing a Quality Control Dashboard
Implementing a quality control dashboard brings numerous benefits to an organization. It enables real-time tracking of quality KPIs, facilitates faster decision-making by highlighting critical issues and trends, and enhances project management through systematic tracking of project quality. Dashboards also contribute to improved product quality by enabling continuous monitoring and analysis of production quality metrics. Additionally, they foster a culture of quality assurance across the organization, ensuring all team members are aligned with the company’s quality objectives and control measures.
Designing Your Quality Control KPI Dashboard
Key Components of a Quality Dashboard Template
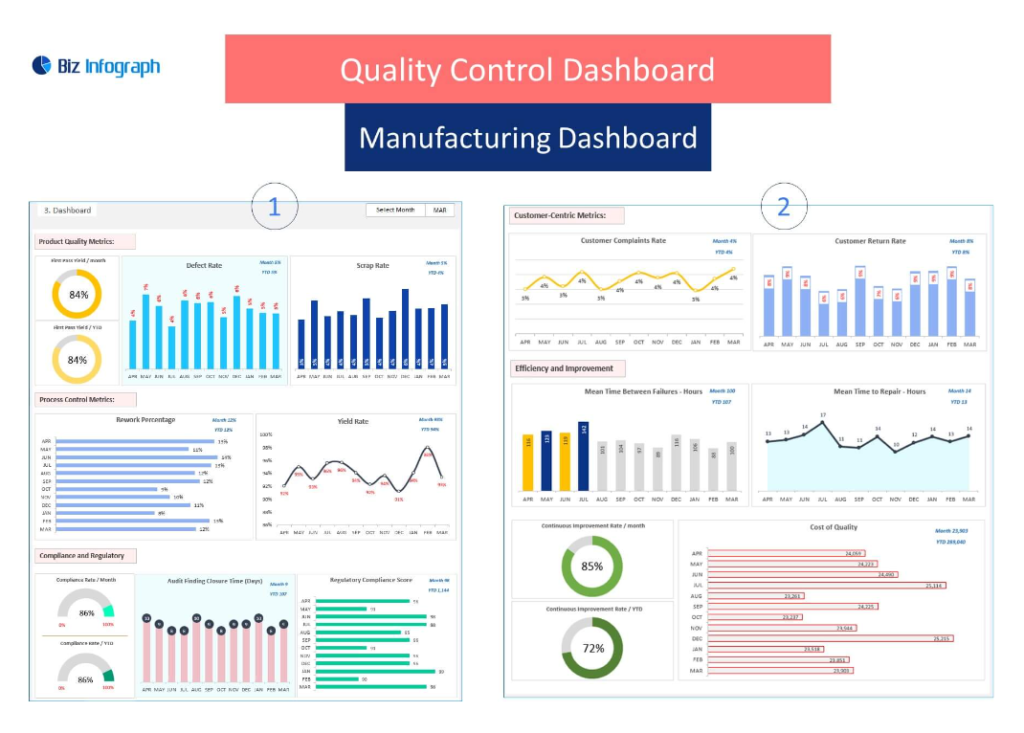
A quality dashboard template should include key components such as real-time data displays, quality control KPI dashboard indicators, and visual aids like charts and graphs for easy data interpretation. It should offer a clear view of project quality, product quality, and production quality, incorporating control measures and quality standards. The template should be customizable to suit various project management needs and designed to track and display quality performance effectively, ensuring all relevant information is accessible and understandable at a glance.
Selecting Quality Control KPIs for Effective Monitoring
Selecting the right quality control KPIs is critical for effective monitoring and management. These KPIs should align with the organization’s quality goals and provide actionable insights into the quality management process. Common KPIs include defect rates, customer satisfaction scores, and compliance rates with quality standards. By choosing relevant KPIs, businesses can accurately measure their quality performance, identify areas for improvement, and ensure their quality management dashboard reflects the true state of their quality control processes.
Quality Performance Management Dashboard Applications
Project Quality Control and Management
Project quality control and management are crucial aspects of ensuring that deliverables meet or exceed predefined quality standards. A quality management dashboard can significantly aid in this by providing a centralized platform to track project quality metrics, manage quality control processes, and ensure that project activities align with the quality management plan. By integrating dashboard tracking for project quality control, managers can ensure consistent quality across projects, identify potential issues early, and implement corrective actions promptly to keep projects on track.
Monitoring Production Quality and Project Monitoring Quality Control
Monitoring production quality is essential for maintaining product standards and customer satisfaction. A dedicated dashboard for tracking production quality enables businesses to oversee the entire production process, identify bottlenecks, and ensure that end products meet the desired quality standards. Similarly, a project monitoring quality control dashboard helps project managers oversee project progress, ensuring that all phases of the project adhere to the planned quality management strategies and methodologies, thereby assuring the overall success and quality of the project.
Quality Data Management and Reporting
Ensuring Data Quality through Quality Management Systems Dashboards
Quality management systems dashboards are instrumental in ensuring data quality across an organization. They provide a framework for tracking, evaluating, and improving the quality of data used in decision-making processes. By incorporating data quality dashboards, organizations can identify inaccuracies, inconsistencies, and gaps in their data, leading to more reliable and accurate data reporting. This, in turn, supports better business decisions, enhances operational efficiency, and improves the effectiveness of quality assurance models.
Dashboard to Track and Assess Customer Data Quality Management
A dashboard designed to track and assess customer data quality management is crucial for maintaining accurate and up-to-date customer information. It helps businesses monitor the integrity and completeness of customer data, ensuring that marketing, sales, and customer service efforts are based on reliable information. This type of dashboard can highlight areas where data quality needs improvement and track progress over time, aiding in the development of strategies to enhance customer data management and ultimately improve the customer experience.
Industry-Specific Quality Dashboards
Dashboard Tracking Quality for Construction and Garment Production
Industry-specific quality dashboards, such as those for construction and garment production, provide tailored solutions that address the unique quality challenges and requirements of these sectors. In construction, a quality dashboard might focus on project timelines, material quality, and compliance with safety standards. In garment production, the focus could be on garment production quality KPIs, adherence to design specifications, and quality control measures throughout the production process. These dashboards help businesses maintain high-quality standards and meet industry-specific regulatory requirements.
Food Quality Management Dashboard: Assuring Quality and Hygiene
A food quality management dashboard is essential for ensuring the safety, quality, and hygiene of food products. It can track critical metrics such as temperature controls, contamination levels, and compliance with food safety standards. By providing real-time insights into food production and storage conditions, this dashboard helps businesses prevent foodborne illnesses, reduce waste, and ensure that products meet both legal requirements and customer expectations. It is a key tool for assuring food quality and hygiene in the food industry.
Dashboard Implementation and Best Practices
Quality Management Plan (QMP) Dashboard: Tracking and Improvement
A Quality Management Plan (QMP) dashboard is a strategic tool for tracking the implementation and effectiveness of a company’s quality management plan. It should cover all aspects of the plan, from quality standards and control measures to project quality management strategies. By providing a clear and concise view of the QMP’s performance, this dashboard helps businesses ensure that their quality objectives are being met, facilitates continuous improvement, and aids in the efficient management of quality across projects and processes.
Quality Dashboard PPT PowerPoint Presentation for Stakeholder Communication
A quality dashboard PPT PowerPoint presentation is an effective way to communicate quality performance and improvements to stakeholders. It should highlight key quality metrics, a dashboard showing trends over time, and illustrate how quality control measures are impacting the business. This presentation can help build confidence among stakeholders by demonstrating a commitment to quality and by providing transparency into the organization’s quality management efforts. It is a valuable tool for sharing insights, updates, and future plans regarding quality assurance.
Advanced Quality Dashboard Features
Project Quality Management with Advanced Dashboards
Advanced dashboards for project quality management incorporate sophisticated analytical tools and functionalities to provide deeper insights into project performance and quality. These dashboards can track a wide range of quality metrics, integrate with other project management tools, and provide predictive analytics to forecast potential quality issues before they occur. By using these advanced features, project managers can better manage project quality, mitigate risks, and ensure that projects are completed within the defined quality standards.
Implementing Quality Control Dashboard Clipart and Infographics
Implementing quality control dashboard clipart and infographics enhances the visual appeal and readability of dashboards. By using graphical elements such as charts, graphs, and clipart, complex data can be presented in an easily digestible format, making it simpler for users to understand and act upon. These visual elements can highlight key information, draw attention to areas of concern, and make the dashboard more engaging and informative for all users.
Product Quality Improvement and Performance Analysis
Using the Dashboard to Improve Quality Standards and Performance
A quality control dashboard is an essential tool for improving quality standards and performance within an organization. By providing a real-time overview of quality metrics and performance indicators, the dashboard allows managers to identify areas where standards may be slipping and to initiate corrective actions promptly. Regular analysis of dashboard data helps in setting realistic quality goals, benchmarking against industry standards, and driving continuous improvement efforts across all levels of the organization.
Quality Control Dashboard with Success Rate Analysis
A quality control dashboard with success rate analysis offers insights into the effectiveness of quality control processes and measures. By tracking success rates, such as the percentage of products meeting quality standards or the rate of successful project completions, businesses can evaluate the efficiency of their quality assurance strategies. This analysis helps in identifying areas for improvement, optimizing processes, and ultimately enhancing the overall quality of products and services offered by the company.
Specialized Dashboards for Quality Assurance
Quality KPI Dashboard Portrait: In-depth Analysis Tools
A quality KPI dashboard portrait provides an in-depth analysis of key performance indicators related to quality assurance. This specialized dashboard allows businesses to delve deeply into specific areas of quality, such as call center performance, service quality, or product defects. By offering detailed insights and analysis tools, this dashboard helps organizations pinpoint the root causes of quality issues, monitor improvement over time, and make data-driven decisions to enhance quality across the board.
Call Center Quality and Service Quality Dashboards
Call center quality and service quality dashboards are specialized tools designed to monitor and improve the quality of customer service and support. These dashboards track metrics such as call resolution times, customer satisfaction scores, and service level agreement (SLA) compliance rates. By providing a clear view of service performance, these dashboards help businesses identify areas for improvement, train and support their staff more effectively, and ultimately enhance the overall customer experience.
Innovations and Trends in Quality Dashboards
Quality Dashboard for Linked Data: New Avenues in Data Management
The quality dashboard for linked data represents a new avenue in data management, focusing on the quality and interconnectivity of diverse data sources. By assessing the quality of linked datasets, businesses can ensure the reliability and accuracy of the information used in their decision-making processes. This type of dashboard is particularly valuable in complex environments where data from various sources need to be integrated and analyzed cohesively.
Dashboard Inspiration: Innovative Approaches in Quality Assurance
Seeking dashboard inspiration from innovative approaches in quality assurance can lead to the development of more effective and user-friendly quality dashboards. By exploring new designs, functionalities, and data visualization techniques, organizations can create dashboards that better meet the needs of their users and provide more meaningful insights into quality metrics. This continuous innovation is crucial for keeping dashboards relevant, engaging, and valuable in the ever-evolving landscape of quality management.
Conclusion: Integrating Quality Control Dashboards into Business Practices
The Future of Quality Management: Trends and Predictions
The future of quality management is likely to see increased integration of technology and data analytics, with quality control dashboards playing a central role. Trends such as automation, AI-driven analytics, and real-time monitoring are expected to shape the development of next-generation quality dashboards. These advancements will enable more precise and predictive quality management practices, helping businesses to stay ahead of quality issues and maintain high standards in an increasingly competitive market.
Ensuring Continuous Improvement through Quality Dashboards
Ensuring continuous improvement through quality dashboards is essential for any business committed to maintaining high standards of quality. By regularly reviewing and updating their dashboards with the latest data and metrics, organizations can keep their finger on the pulse of their quality performance. This ongoing commitment to monitoring and enhancement supports a culture of quality throughout the organization, drives constant improvement in processes and products, and ensures that the business remains aligned with its quality objectives and customer expectations.
You may be interested: