Introduction to Overall Equipment Effectiveness (OEE)
Understanding OEE and Its Importance in Manufacturing
Overall Equipment Effectiveness (OEE) is a comprehensive metric used in manufacturing to assess a machine’s productivity and efficiency. It combines availability, performance, and quality to provide a single figure that represents the overall effectiveness of manufacturing equipment. Understanding OEE is crucial as it helps identify areas where equipment is not performing optimally, allowing for targeted improvements. By measuring OEE, manufacturers can gain insights into production losses, benchmark progress, and drive continuous improvement efforts across the shop floor.
The Benefits of Using an OEE Dashboard for Operational Excellence
An OEE dashboard centralizes real-time OEE scores and other critical manufacturing data, offering a visualization of a production line’s efficiency. Utilizing an OEE dashboard can help streamline operational processes, improve decision-making, and enhance operational efficiency. By displaying OEE data in an accessible format, dashboards allow managers and operators to quickly identify trends, track shift progress, and pinpoint areas for improvement. The immediate availability of data through an OEE dashboard supports fast, informed decision-making and fosters an environment of continuous improvement.
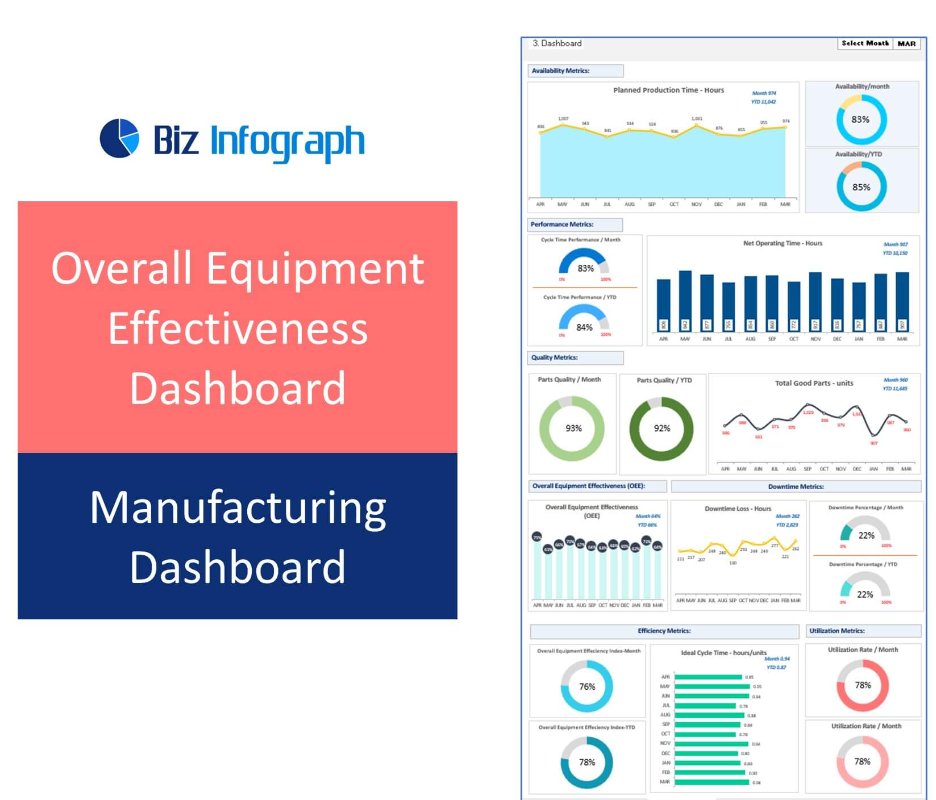
Components of an Effective OEE Dashboard
Key Metrics to Track OEE Dashboard
An effective OEE dashboard should include key metrics such as the OEE score, availability, performance, quality rates, and downtime reasons. These metrics offer a comprehensive view of production performance and help identify specific areas for improvement. Integrating KPIs related to production time, changeovers, and production process efficiencies can also provide deeper insights. A well-structured dashboard facilitates easy interpretation of data, helping users analyze effectiveness across various factors and machines, and supports informed decision-making.
Integrating Real-Time Production Data for Accurate Tracking
Incorporating real-time production data into the OEE dashboard allows for accurate and timely tracking of manufacturing performance. Real-time data capture eliminates the need for manual time studies and ensures that the information displayed is current and actionable. By connecting data streams directly from machines, the dashboard provides detailed visibility into production processes, enabling users to monitor and improve performance in real time, identify trends, and make better decisions to enhance productivity and operational efficiency.
Implementing an OEE Dashboard in Excel
Setting Up and Use OEE Dashboard Excel Template
Setting up an OEE Dashboard in Excel involves creating a template that can effectively display real-time OEE scores and other pertinent production data. The template should be designed to capture and calculate OEE metrics automatically, pulling data from various sources across the shop floor. This setup should include fields for planned production time, actual running time, downtime reasons, quality defects, and performance data. An effective Excel template will also offer customization options to fit the unique needs of different manufacturing operations.
Utilizing Excel Features for Dynamic OEE Data Analysis
Excel offers a range of features suitable for dynamic OEE data analysis, such as pivot tables, chart tools, and conditional formatting. These tools can help in visualizing data trends, comparing performance across different time frames or shifts, and identifying bottlenecks in the production process. By leveraging these features, manufacturers can create simple dashboards that still offer a detailed view of machine performance, production efficiency, and areas requiring attention, thereby improving the overall effectiveness of the manufacturing equipment.
Enhancing Productivity with OEE Insights
Analyzing Downtime and Identifying Production Line Bottlenecks
Utilizing OEE dashboards to analyze downtime reasons and identify production bottlenecks is vital for enhancing productivity. By capturing and reviewing data on machine downtime, low OEE scores, and poor machine performance, manufacturers can pinpoint specific issues affecting productivity. Understanding the root causes of downtime and bottlenecks allows for targeted interventions, such as equipment maintenance or process adjustments, leading to reduced downtime and improved manufacturing flow.
Leveraging OEE Data to minimize machine downtime and improve Manufacturing Equipment Performance
Leveraging OEE data through comprehensive analytics dashboards can significantly optimize manufacturing equipment performance. By monitoring machine OEE, tool status, and quality rates, manufacturers can assess how effectively each piece of equipment runs. This analysis helps in making performance improvements, such as fine-tuning machine settings, enhancing operator training, or adjusting maintenance schedules. Consequently, these actions lead to higher equipment efficiency, improved quality, and greater overall productivity. OEE dashboard is a production efficiency tool.
Advancing OEE Tracking with Technology Integration
Integrating ERP Systems for Comprehensive Production Insights
The integration of Enterprise Resource Planning (ERP) systems with OEE dashboards offers a more comprehensive view of production insights. This connection enables the seamless flow of data between the shop floor and upper management, facilitating better-informed decision-making. By leveraging ERP data, manufacturers can understand the impact of production performance on broader business metrics, such as inventory levels, supply chain efficiency, and overall business profitability.
Incorporating Human-Centric Data for a Holistic Approach to OEE
Beyond machine data, incorporating human-centric data into the OEE dashboard fosters a more holistic approach to measuring overall equipment effectiveness. This includes tracking human activities, such as manual interventions, operator efficiency, and team productivity. By combining machine and human-centric metrics, the dashboard provides a fuller picture of production effectiveness, helping managers and decision-makers identify areas for improvement not only in equipment but also in workforce deployment and training.
Strategic Use of OEE Dashboard for Continuous Improvement
Utilizing OEE Dashboards for Long-term Manufacturing Goals
OEE dashboards are instrumental in achieving long-term manufacturing goals by providing a framework for continuous improvement. Regular use of the dashboard to track and analyze OEE data helps manufacturers set realistic performance benchmarks, align production activities with business objectives, and gauge the effectiveness of improvement initiatives. Over time, this continuous monitoring and analysis support the achievement of higher OEE scores, better quality products, and more efficient production processes.
Best Practices for Maintaining and Updating Your OEE Dashboard
To ensure the OEE dashboard remains a valuable tool for continuous improvement, adhering to best practices for its maintenance and updating is essential. This includes regular reviews of the dashboard’s relevance, updating it to reflect changes in production lines or manufacturing processes, and ensuring data accuracy through periodic validations. Training staff on using and interpreting the dashboard effectively is also crucial, as this empowers them to make data-driven decisions and contribute to the culture of continuous improvement across the manufacturing operation.
You may be interested: