
Introduction to CEO Dashboard Google Sheets Templates
Defining CEO Dashboards and Their Importance
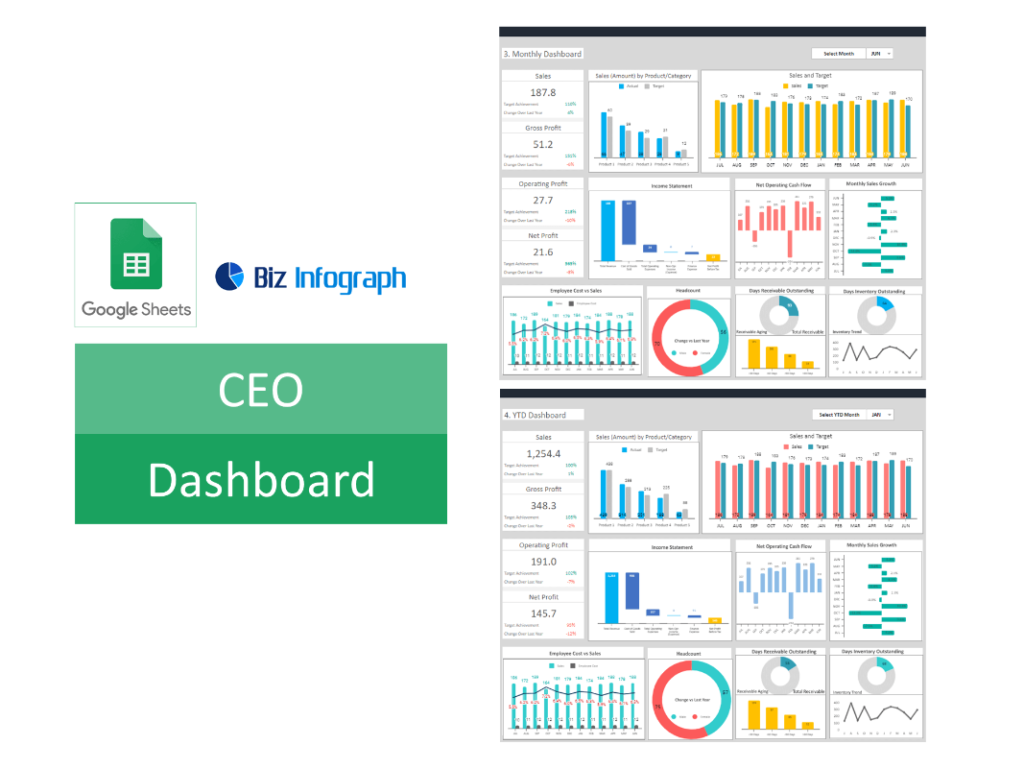
CEO Dashboards consolidate essential business metrics and KPIs in one easily accessible location, typically within a spreadsheet or analytics platform like Google Sheets. These dashboards are critical for CEOs because they provide a clear, concise view of the company’s performance across various areas, enabling quick, informed decisions. By integrating real-time data from different business areas, a CEO dashboard can highlight trends, identify potential issues, and track progress towards business goals, thereby serving as an indispensable tool for strategic planning and daily management.
Benefits of Implementing a CEO Dashboard in Google Sheets
Using Google Sheets for a CEO dashboard offers versatility, real-time data updates, and collaboration across teams. This approach provides CEOs with a comprehensive view of the company’s operations, financial health, and market position. The advantage of Google Sheets lies in its accessibility, cost-effectiveness, and compatibility with various data sources. By leveraging free Google Sheets dashboard templates, CEOs can quickly set up a dashboard that allows them to monitor critical metrics, such as monthly sales, marketing performance, and project timelines, ensuring that they have the necessary insights to make informed decisions.
Setting Up Your CEO Dashboard in Google Sheets
Step-by-Step to Create a Google Sheets CEO Dashboard
Creating a CEO Dashboard within Google Sheets involves a systematic approach: starting with identifying the key metrics that align with your strategic goals. Next, select a dashboard template from the myriad of free Google Sheets templates available online. Import your data, whether it’s sales figures, customer feedback, or operational costs, and use Google Sheets’ array of functions to organize and visualize this data effectively. Customize your dashboard to ensure it reflects the unique aspects of your business, focusing on clarity, relevance, and real-time updates.
Customizing Google Sheets Dashboard Templates for Executive Use
To effectively use a dashboard template in Google Sheets for executive purposes, customization is key. Tailor the dashboard to focus on KPIs that directly impact strategic decisions and business outcomes. Integrate advanced visualization tools within Google Sheets to represent data in an intuitive, easily digestible format. This might include executive KPI dashboard, sales funnels, profit margins, or customer acquisition costs. Additionally, ensure the dashboard is scalable and adaptable to the evolving needs of the business, allowing for modifications as objectives change or new data becomes available.
Best Practices for Dashboard Design and Layout
Effective dashboard design and layout are crucial for ensuring that CEOs can quickly access and understand key business information. Best practices include organizing the dashboard logically, with the most critical information at the top, using consistent color schemes and fonts for clarity, and avoiding information overload by focusing on essential metrics only. Regularly review the dashboard layout with stakeholders to ensure it remains relevant and functional, encouraging feedback to continually refine and improve the tool for better decision-making support.
CEO KPI Dashboard Template for Google Sheets
Selecting the Right KPIs for Your CEO Analytics Dashboard Template
The right KPIs for a CEO dashboard depend on the specific goals and challenges of the business. Identify metrics that provide a clear indication of performance in areas critical to the company’s success, such as revenue growth, cost management, customer satisfaction, and employee performance. These KPIs should be directly actionable, offering clear insights that can lead to informed strategic decisions. Regularly review and update these KPIs to ensure they remain aligned with the business’s evolving objectives and market conditions.
Integrating and Visualizing KPIs in Google Sheets Spreadsheet
Integrating KPIs into a Google Sheets dashboard allows CEOs to monitor their business’s health and performance continuously. Utilize Google Sheets’ features like pivot tables, charts, and conditional formatting to visualize data effectively, making it easier to identify trends, outliers, and areas requiring attention. Ensure that these visualizations are clear, concise, and updated in real-time to facilitate quick decision-making. Regularly refine these visualizations based on user feedback and changing business needs to keep them relevant and effective.
Examples of Essential KPIs for Management Dashboard
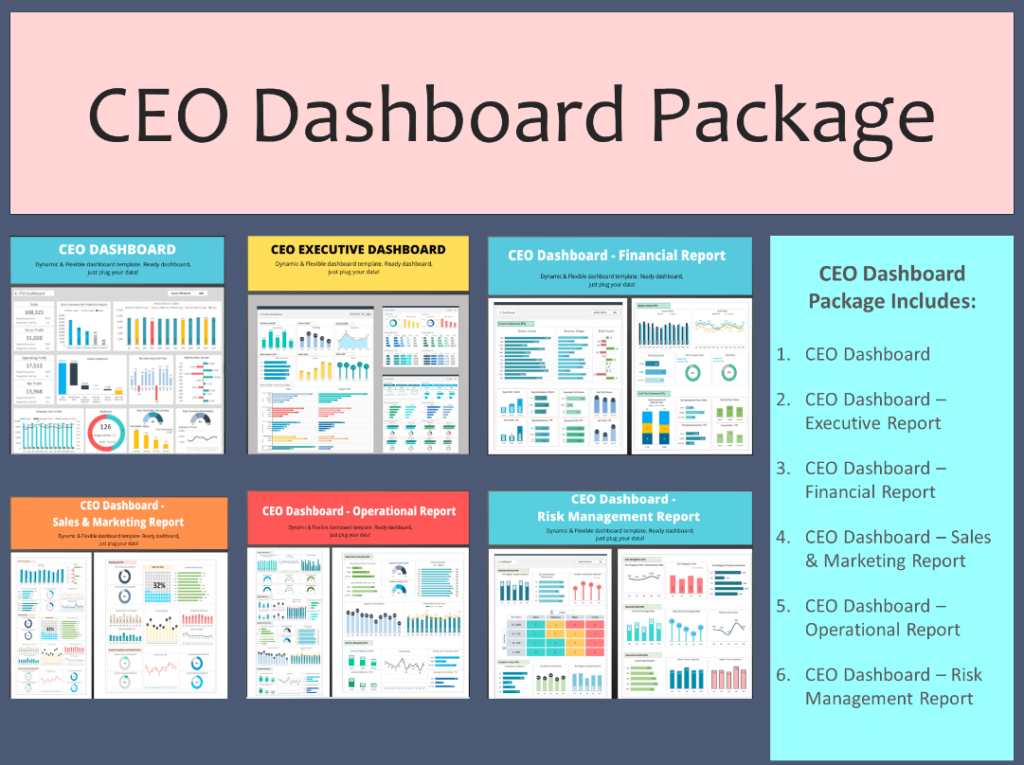
Essential KPIs for a CEO might include financial indicators like EBITDA, operational metrics such as customer churn rate, and strategic KPIs like market share growth. These should provide a holistic view of the business’s performance and help the CEO understand where the company stands concerning its long-term objectives and industry benchmarks. Regularly assess these KPIs for their relevance and alignment with the company’s strategic goals, adjusting as necessary to ensure they continue to provide valuable insights. For top executives you can add marketing timeline template, marketing KPI template, marketing campaigns dashboard, and project tracking template.
Enhancing Decision-Making with Sales and Marketing Dashboards
Designing a Sales Dashboard for Strategic Insights
A sales dashboard should provide a comprehensive view of the sales process, from lead generation to final sales, highlighting areas of success and those requiring improvement. Incorporate metrics like sales growth, lead conversion rates, and average deal size to give CEOs a clear picture of sales performance. Regularly updating this information allows for real-time monitoring and quick adjustments to sales strategies, ultimately leading to better sales outcomes and increased revenue.
Crafting a Marketing Dashboard for CEO Overview
A marketing dashboard should offer insights into the effectiveness of various marketing strategies and campaigns, tracking metrics such as lead generation, conversion rates, and ROI. This allows CEOs to gauge how well marketing efforts are contributing to the company’s overall goals and where adjustments might be needed. By providing a clear view of marketing performance, a well-constructed dashboard can help CEOs allocate resources more effectively and improve overall marketing efficiency.
Utilizing Data to Drive Sales and Marketing Strategies
Data-driven decision-making is crucial for aligning sales and marketing strategies with company objectives. A CEO dashboard should integrate sales and marketing data to provide a unified view of customer behavior, market trends, and campaign effectiveness. This holistic approach enables CEOs to identify synergies between sales and marketing, optimize customer touchpoints, and direct resources to the most effective strategies, ultimately driving better business results.
Project and Team Management Insights
Tracking Project Progress and Team Performance
A CEO dashboard should include project and team management insights, providing visibility into project timelines, milestones, and team productivity. This can help CEOs ensure projects align with strategic goals, resources are allocated efficiently, and teams are performing at their best. Regularly reviewing these metrics can help identify potential issues early and allow for timely interventions to keep projects on track and teams engaged and productive.
Managing Timelines and Deliverables via Google Sheets Project Management
Leverage Google Sheets to manage project timelines and deliverables effectively. Using features like Gantt charts and timelines, CEOs can track project progress in real-time, ensuring that deliverables are met and timelines are adhered to. This level of oversight helps in making informed decisions about resource allocation, prioritization, and adjustments to project scopes, leading to better project outcomes and more efficient use of company resources.
Aligning Project Management KPIs with CEO Goals
Align project management KPIs with overarching CEO goals to ensure that all projects contribute to the broader business objectives. Metrics such as project completion rates, budget adherence, and team efficiency should reflect the company’s strategic priorities and provide actionable insights for the CEO. Regular evaluation of these KPIs helps maintain alignment between project outcomes and business goals, ensuring that every project delivers value to the organization.
Advanced Analytics for CEOs
Leveraging Advanced Google Sheets Features for Data Analysis
To make the most out of Google Sheets, CEOs should utilize its advanced features for deeper data analysis. Functions like QUERY, IMPORTDATA, and custom scripts can transform raw data into meaningful insights, enabling predictive modeling, trend analysis, and scenario planning. These advanced analyses can provide CEOs with foresight into potential market changes, operational challenges, and business opportunities, guiding more strategic and forward-thinking decisions.
Integrating External Data and Analytics into Your CEO Dashboard
Incorporate external data sources into your CEO dashboard for a more rounded view of the business landscape. Linking Google Sheets with external databases, CRM systems, and analytics platforms like Google Analytics can provide a deeper understanding of customer behavior, market trends, and operational efficiency. This integration enables more informed strategic planning and decision-making by providing a comprehensive view of both internal operations and external market conditions.
Predictive Analytics and Forecasting for Strategic Planning
Employing predictive analytics and forecasting within your CEO dashboard can significantly enhance strategic planning. By analyzing historical data and current trends, CEOs can forecast future performance, anticipate market changes, and make informed decisions about strategic directions. This forward-looking approach enables proactive rather than reactive management, helping to secure a competitive edge and drive sustainable business growth.
Maximizing the Impact of Your CEO Dashboard
Regular Maintenance and Updates for Dashboard Accuracy
To ensure your CEO dashboard remains effective and accurate, commit to regular maintenance and updates. This includes verifying data sources, refreshing visualizations, and updating KPIs to reflect the latest business objectives and market conditions. An up-to-date dashboard is crucial for providing reliable insights that CEOs can base their decisions on, ensuring the business stays aligned with its strategic goals and responds effectively to market dynamics.
Training and Empowering Your Team to Use the Dashboard Effectively
For a CEO dashboard to be truly effective, the executive team and other key stakeholders must understand how to use it. Provide training sessions and resources to ensure your team knows how to interpret the data, utilize the dashboard’s features, and apply the insights in their decision-making processes. Empowering your team in this way not only enhances the value of the dashboard but also fosters a more data-driven culture within the organization.
Reviewing and Acting on Dashboard Insights for Business Growth
The ultimate goal of a CEO dashboard is to provide actionable insights that drive business growth. Regularly review the data and insights to identify opportunities for improvement, areas of concern, and potential growth strategies. Use these insights to inform business decisions, strategize new initiatives, and guide the company toward achieving its objectives. Acting on the data provided by your dashboard can lead to improved efficiency, greater market share, and increased profitability.
Conclusion: Elevating Executive Oversight
Summarizing the Impact of a Well-Designed CEO Dashboard
A well-designed CEO Dashboard is an invaluable tool for executive oversight, providing a clear and concise overview of a company’s performance across all key areas. By offering real-time insights into financial, operational, and market data, a comprehensive dashboard enables CEOs to make informed, strategic decisions quickly and efficiently. The right dashboard can transform data into actionable intelligence, driving better business outcomes and ensuring strategic alignment across the organization.
Next Steps: From Dashboard Implementation to Action
After implementing a CEO dashboard, the next steps involve regular monitoring, analysis, and action. Use the dashboard to track progress towards business goals, identify and address challenges, and seize growth opportunities. Continuously refine the dashboard to ensure it meets the evolving needs of the business and remains a valuable tool for strategic decision-making.
Resources and Further Learning for CEO Dashboard Mastery
To maximize the benefits of a CEO dashboard, continue to explore resources and further learning opportunities. Engage with online communities, attend webinars, and consult with experts to learn best practices and innovative approaches to dashboard design and data analysis. Expanding your knowledge and skills in this area will enhance your ability to leverage your CEO dashboard for effective business management and leadership.
You may be interested: