
Introduction to Inventory Management in Excel
The Importance of an Inventory Management Dashboard
The importance of an Inventory Dashboard in Excel cannot be overstated. It serves as a crucial tool in inventory management, enabling businesses to have a centralized view of stock levels, inventory value, and movement patterns. By leveraging a well-designed inventory dashboard, companies can gain insights into inventory turnover, optimize stock levels, and enhance inventory visibility. This leads to improved decision-making, better management of supply chain, and ultimately, higher profitability. Additionally, such dashboards provide real-time data that helps in identifying trends, managing out-of-stock scenarios, and planning for future inventory needs, thus ensuring that businesses maintain an optimal balance between supply and demand.
How Excel Templates Streamline Inventory Management
Inventory dashboards provide a straightforward way to organize and track inventory data, streamline warehouse operations, and manage stock levels. These templates can be customized to suit the specific needs of the organization, allowing for efficient tracking of KPIs, inventory metrics, and other key data points such as average inventory, SKU details, and order details. By using Excel templates, businesses can avoid the complexities and costs associated with more sophisticated BI tools while still benefiting from robust inventory analysis and management capabilities. These templates enable users to easily see and evaluate their inventory levels, making it simpler to optimize inventory, forecast demand, and prevent excess stock or stock shortages.
Setting Up Your Inventory Dashboard in Excel
Key Components of an Excel Inventory Dashboard
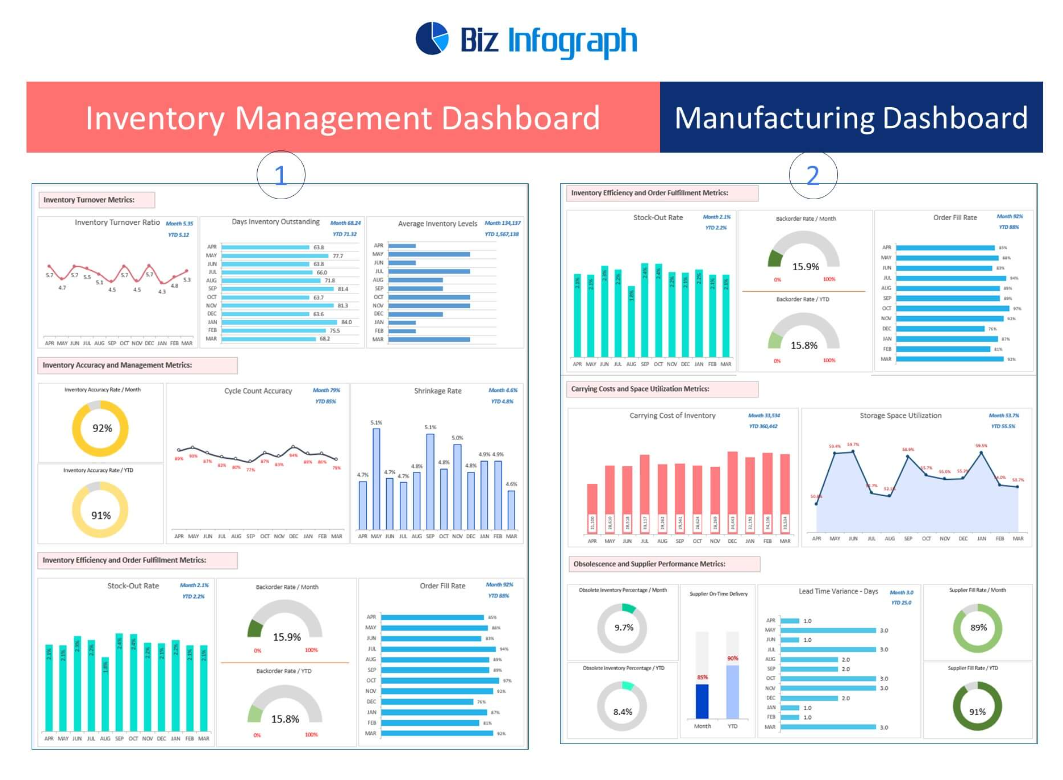
An effective Excel Inventory Dashboard includes various key components to provide a comprehensive view of the inventory management system. These include KPIs for tracking performance, inventory metrics such as inventory turnover ratio and average inventory, and visual aids like charts and graphs for easy data interpretation. The dashboard should also include sections for stock availability, shipment details, and reorder points to streamline the management process. Integrating these components into the dashboard ensures that inventory managers have all the necessary information at their fingertips, enabling them to make informed decisions and maintain efficient warehouse management.
Customizing Your Excel Template for Inventory Control
Customizing your Excel template for inventory control involves configuring the dashboard to align with the specific needs of your organization’s inventory management system. This can involve setting up formulas for automatically updating stock levels, creating drop-down lists for categorizing products, and defining conditional formatting rules for highlighting critical inventory metrics such as low stock levels or high return rates. By tailoring the Excel template to reflect your inventory management practices, you can optimize your inventory control process, enhance inventory visibility, and ensure that your team has the right tools to manage stock effectively and meet customer demand.
Dashboard Functionality and Features
Utilizing KPIs for Effective Inventory Management
Key Performance Indicators (KPIs) are vital for effective inventory management as they provide measurable values that reflect the performance and efficiency of your inventory system. In an Excel inventory dashboard, integrating KPIs such as turnover ratio, return rate, and out-of-stock incidents helps organizations evaluate their inventory’s health and performance. Inventory dashboards provide visibility to managers to identify areas for improvement, make informed decisions to optimize inventory levels, and ultimately enhance profitability and customer satisfaction. By tracking these indicators, businesses can align their inventory management practices with their overall strategic objectives, ensuring a streamlined and effective inventory management process.
Enhancing Visibility with Warehouse Management Features
Enhancing visibility with warehouse management features in an Excel dashboard involves incorporating data that provide insights into warehouse operations and inventory distribution. This includes real-time tracking of stock availability, warehouse capacity, and location of items within the warehouse. By implementing features such as inventory maps and stock movement logs, businesses can improve the efficiency of their warehouse management, reducing the time spent locating items and ensuring that inventory is stored optimally. Increased visibility into warehouse operations allows for better planning, reduced waste, and improved alignment with supply chain management practices.
Stock Availability and Supply Chain Integration in Excel
Incorporating stock availability and supply chain integration into your Excel dashboard enables comprehensive monitoring of inventory levels and supply chain operations. This involves linking inventory data with supplier information, shipment schedules, and customer demand forecasts to create a cohesive inventory management system. By having a clear overview of stock or inventory availability and supply chain dynamics, businesses can better manage reorder points, minimize the risk of stockouts, and optimize their inventory based on market demands and supply chain constraints. Effective integration leads to a more resilient and responsive inventory system, which is crucial for maintaining high levels of customer satisfaction and operational efficiency.
Inventory Control and Optimization
Implementing Inventory Control Techniques in Excel
Implementing inventory control techniques in Excel involves the use of formulas, data validation, and conditional formatting to manage and monitor inventory levels effectively. Techniques such as setting minimum and maximum stock levels, calculating reorder points, and tracking product expiration dates can be incorporated into the Excel template. This allows businesses to maintain optimal inventory levels, prevent overstocking or stockouts, and ensure timely replenishment of inventory. Effective inventory control is essential for reducing carrying costs, improving cash flow, and increasing overall profitability.
Streamlining Warehouse Operations with Excel Dashboards
Streamlining warehouse operations with Excel dashboards can significantly enhance efficiency and accuracy in inventory management. By creating an organized and user-friendly dashboard, businesses can track warehouse activities, monitor inventory levels in real-time, and quickly identify discrepancies or inefficiencies. Features such as automated data entry, easy navigation, and clear visual indicators help streamline processes, reduce manual errors, and improve workflow. Additionally, Excel dashboards can facilitate better communication and coordination among warehouse staff, leading to smoother operations and more effective inventory control.
Managing Open Purchase Orders (Open POs) in Excel
Managing Open Purchase Orders (Open POs) in Excel allows businesses to track and analyze pending orders and their impact on inventory levels. By integrating open POs into the inventory dashboard, companies can gain insights into upcoming stock replenishments, evaluate supplier performance, and plan for future inventory needs. This helps in maintaining optimal stock levels, avoiding overstocking or shortages, and improving order fulfillment rates. Effective management of open POs in Excel also aids in budgeting, forecasting, and supply chain coordination, contributing to a more efficient and proactive inventory management approach.
Analytics and Reporting in Excel
Leveraging Excel for Inventory Analytics
Leveraging Excel for inventory analytics enables businesses to analyze and interpret large sets of inventory data to make informed decisions. By using Excel’s advanced analytical tools, such as pivot tables, charts, and conditional formatting, businesses can uncover trends, patterns, and insights within their inventory data. This can include analyzing inventory turnover rates, identifying best-selling products, and assessing the impact of promotional activities on stock levels. An effective inventory dashboard helps to better inventory optimization, reduce costs, and improve profitability.
Creating a KPI Dashboard in Excel for Inventory Management
Creating a KPI Dashboard in Excel for inventory management involves the integration of key performance indicators that measure the effectiveness of inventory practices. This dashboard should provide a clear and concise overview of inventory metrics such as stock turnover, fill rate, and order accuracy. By regularly monitoring inventory KPIs, businesses can identify areas for improvement, adjust their inventory strategies, and enhance operational efficiency. A well-designed KPI dashboard in Excel not only aids in decision-making but also helps in communicating inventory performance to stakeholders.
Interpreting Data for Supply Chain Management Optimization
Interpreting data for supply chain management optimization involves analyzing inventory levels, supplier performance, and logistics efficiency to improve the overall supply chain operation. Using Excel, businesses can visualize complex data through charts and graphs, identify bottlenecks in the supply chain, and develop strategies to address them. Effective data interpretation helps in reducing lead times, lowering transportation costs, and enhancing supplier collaboration, leading to a more agile and responsive supply chain. By leveraging Excel for data analysis, businesses can ensure a smoother flow of goods from suppliers to customers, improving service levels and customer satisfaction.
Practical Examples and Templates
Excel Dashboard Examples for Inventory Management
Excel dashboard examples for inventory management provide practical insights into how different businesses track and manage their inventory. By studying these examples, companies can learn how to set up their own dashboards to track inventory metrics, analyze stock levels, and monitor order fulfillment. These examples often include best practices for layout, data visualization, and dashboard functionality, making it easier for businesses to develop a dashboard that meets their specific needs. By leveraging these examples, companies can improve their inventory management processes, leading to better decision-making and increased efficiency.
Template Walkthrough: Setting Up Your Inventory Dashboard
A template walkthrough for setting up your inventory dashboard in Excel guides users through the process of customizing and utilizing their dashboard effectively. This can include instructions on how to input inventory data, configure formulas for automatic updates, and create visualizations for easy data interpretation. By following a detailed walkthrough, users can ensure that their dashboard is set up correctly and tailored to their inventory management needs. This step-by-step guidance can help businesses maximize the utility of their Excel dashboard, enhancing their inventory control and analysis capabilities.
Tips for Maintaining and Updating Your Excel Inventory Dashboard
Maintaining and updating your Excel inventory dashboard is crucial for ensuring its effectiveness and relevance over time. Tips for upkeep may include regular data validation, updating inventory records, and revising formulas and functions as needed. Additionally, businesses should periodically review their dashboard’s layout and features to ensure they continue to meet the organization’s changing needs. By following best practices for maintenance and updates, companies can ensure that their Excel inventory dashboard remains a valuable tool for inventory management and decision-making.
Advanced Techniques and Tips
Advanced Excel Functions for Inventory Tracking
Utilizing advanced Excel functions for inventory tracking can significantly enhance the dashboard’s accuracy and functionality. Functions such as VLOOKUP, INDEX MATCH, and SUMIFS can be used to manage inventory data more efficiently, enabling users to retrieve, analyze, and summarize inventory information quickly. Implementing these advanced functions helps in automating tasks, reducing manual errors, and providing deeper insights into inventory performance. By mastering these Excel functions, businesses can improve their inventory tracking capabilities, leading to more informed and strategic decision-making.
Streamlining Your Supply Chain with Excel Dashboards
Streamlining your supply chain with Excel dashboards involves using the tool to monitor and analyze supply chain operations, from inventory management to shipment tracking. By integrating supply chain data into the dashboard, businesses can gain a comprehensive view of their operations, identify inefficiencies, and optimize processes. Excel dashboards can be used to track supplier performance, analyze transportation costs, and manage lead times, contributing to a more efficient and cost-effective supply chain. By leveraging Excel for supply chain management, companies can improve coordination, reduce costs, and enhance overall supply chain performance.
Best Practices for Inventory Management in Excel
Best practices for inventory management in Excel include organizing data effectively, using formulas and functions for automation, and regularly reviewing and updating the dashboard. It’s also important to ensure data accuracy by validating input data and performing regular checks. Businesses should also focus on making their dashboards user-friendly by using clear labels, intuitive layouts, and helpful visualizations. By adhering to these best practices, companies can make the most of their Excel inventory dashboards, leading to improved inventory management and business outcomes.
Conclusion and Next Steps
Maximizing the Potential of Your Excel Inventory Dashboard
Maximizing the potential of your Excel inventory dashboard involves continuous learning and adaptation to ensure it meets the evolving needs of your business. This includes regularly updating the dashboard with new data, refining formulas and features based on user feedback, and exploring new ways to visualize and analyze inventory information. By actively managing and improving the dashboard, businesses can maintain an effective tool for inventory management that helps in making informed decisions, reducing waste, and improving profitability.
Continuously Improving Inventory Management Processes
Continuous improvement of inventory management processes is essential for maintaining operational efficiency and meeting customer demands. By using the Excel inventory dashboard as a tool for ongoing monitoring and analysis, businesses can identify areas for improvement, test different strategies, and implement best practices. Continuous improvement efforts should focus on optimizing inventory levels, enhancing supply chain collaboration, and streamlining warehouse operations. By committing to ongoing optimization, businesses can ensure that their inventory management practices remain effective and responsive to market changes.
Resources for Further Learning and Excel Template Enhancement
Exploring resources for further learning and Excel template enhancement can help businesses expand their inventory management capabilities and make better use of their dashboards. This can include online tutorials, Excel forums, and professional courses that offer advanced training in Excel features and functions. Additionally, businesses can seek out new templates, add-ins, and tools that extend the functionality of their Excel dashboards. By investing in further learning and development, companies can enhance their inventory management practices, improve their use of Excel, and drive better business results.
You may be interested: